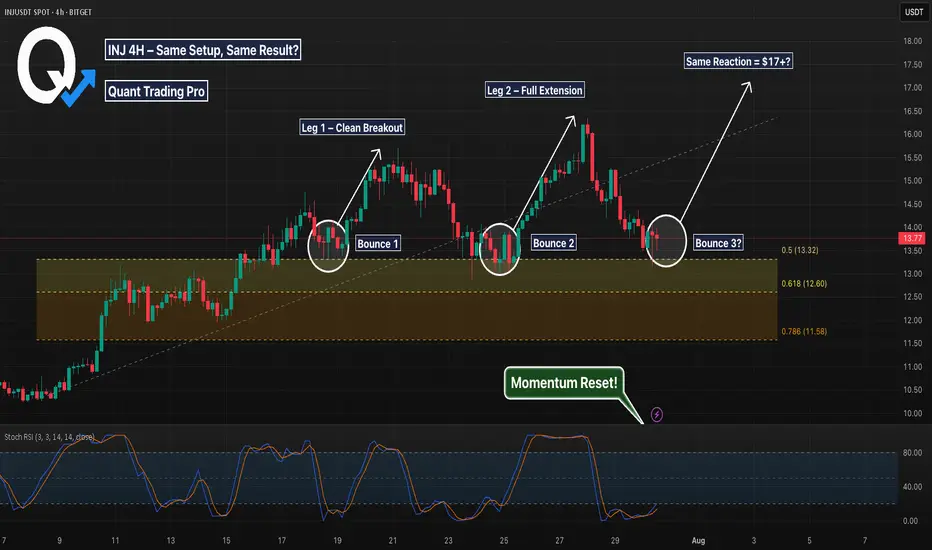
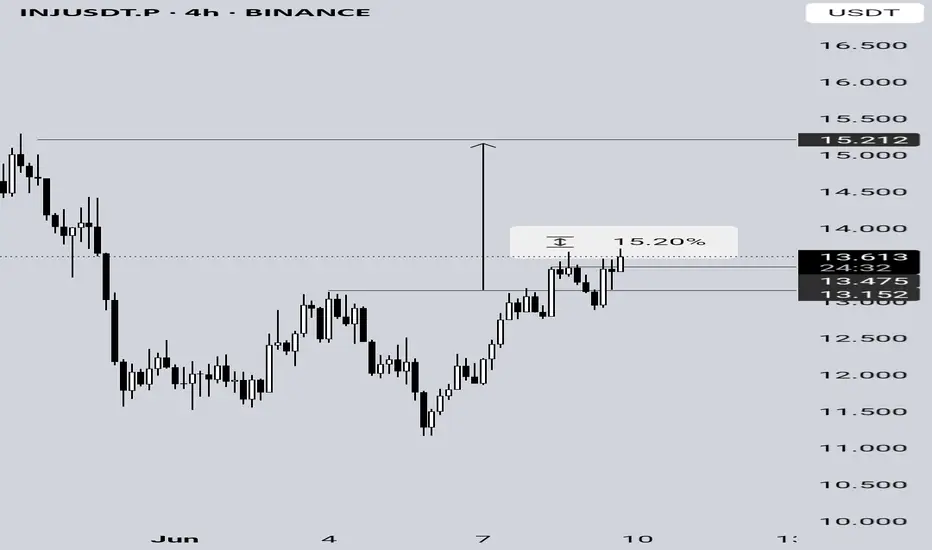
INJ 4H – Bounce Structure Repeating for a 3rd Time?INJ is showing one of the cleanest bounce structures we’ve seen all week.
Twice now, price has pulled back into this Fib zone (between the 0.5 and 0.618) and reversed cleanly — forming back-to-back legs up. Now we’re right back in that same golden pocket, with Stoch RSI fully reset and price showing signs of stabilizing.
🔍 What This Chart Shows:
Bounce 1: Clean reversal off the golden pocket → new local high
Bounce 2: Identical pullback → full extension into $16+
Current setup: Testing the same zone again (0.5 = 13.32, 0.618 = 12.60)
Momentum: Stoch RSI reset + structure still intact
Measured move projection: $17.50+ if we see a similar reaction
🧠 Why It Matters:
This is where high-RR trades are born — when you can define your invalidation below the Fib zone and let structure do the heavy lifting. It’s not about predicting—it’s about positioning.
One setup. One zone. Three chances to catch the move.
Inj
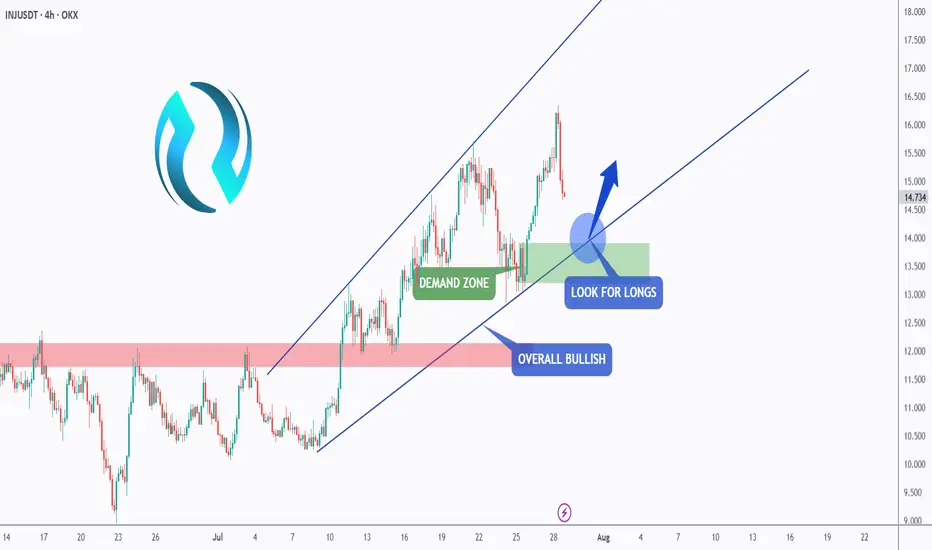
INJ - Back Bullish!Hello TradingView Family / Fellow Traders. This is Richard, also known as theSignalyst.
📈INJ has been overall bullish trading within the rising wedge pattern marked in blue.
This week, INJ has been retesting the lower bound of the wedge.
Moreover, the green zone is a strong demand.
🏹 Thus, the highlighted blue circle is a strong area to look for buy setups as it is the intersection of the lower blue trendline and green demand.
📚 As per my trading style:
As #INJ approaches the blue circle zone, I will be looking for trend-following bullish reversal setups (like a double bottom pattern, trendline break , and so on...)
📚 Always follow your trading plan regarding entry, risk management, and trade management.
Good luck!
All Strategies Are Good; If Managed Properly!
~Richard Nasr
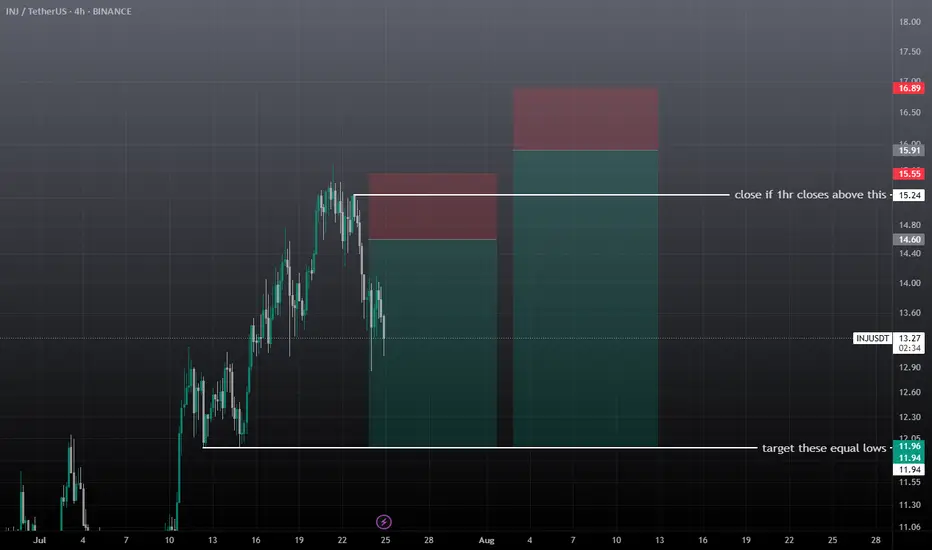
inj swing short setupWait for the entry, don't take it at current market price, entry can take time. There are two short setups forming on injusdt, after achieving the first entry if 1hr closes above the mentioned zone then close trade before sl, and then take the 2nd short setup, if tp achieves first then don't take the trade wait for the new setup.
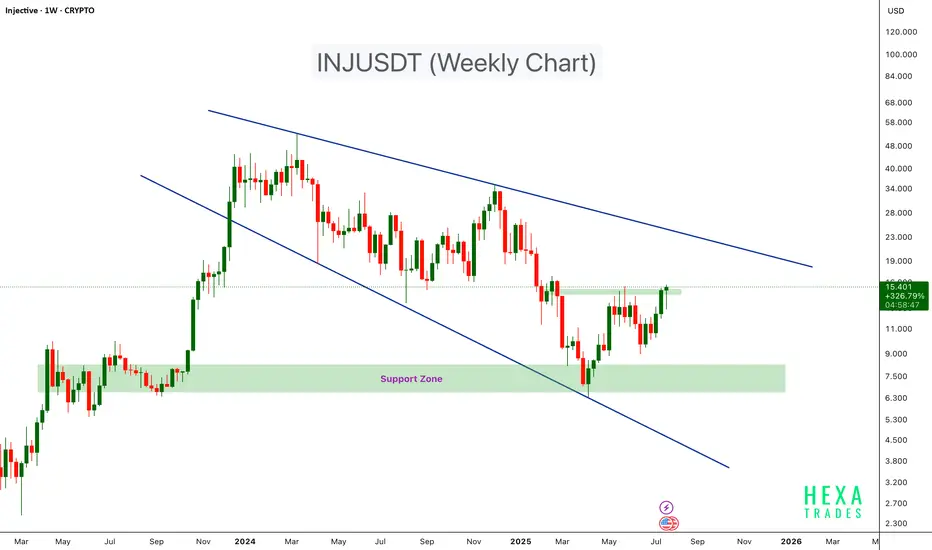
INJUSDT Descending Broadening WedgeINJUSDT is showing signs of a potential bullish breakout after rebounding from the lower boundary of a descending broadening wedge classic reversal pattern.
The price bounced from strong support around the $7.5–$9 zone, which aligns with historical buying interest. After bouncing from this key demand area, INJ has pushed higher and is now approaching a critical resistance level near $15.5. If the resistance breakout confirms, we can expect a bullish continuation towards the $25-$50. level
Cheers
Hexa
INJUSDT Daily Chart Analysis | Uptrend Brewing at Crucial LevelINJUSDT Daily Chart Analysis | Uptrend Brewing at Crucial Resistance
🔍 Let’s break down the INJ/USDT setup, examining its technical structure and mapping out key opportunities as it gears up for a decisive move.
⏳ Daily Overview
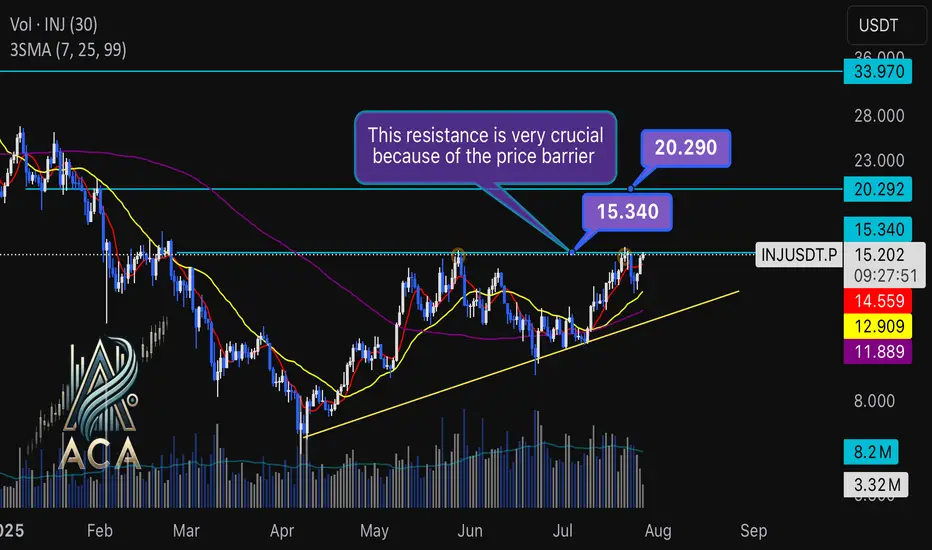
The INJUSDT pair is forming a solid bullish structure, supported by a clear ascending triangle pattern on the daily timeframe. Notably, the 3SMA (7, 25, 99) are crossing to the upside, signaling the early stage of a potential upward trend. This momentum is reinforced by the ascending triangle’s rising trendline, showing steady accumulation and higher lows.
🔺 Bullish Scenario:
Price is consolidating just below the critical resistance at $15.340—a key zone highlighted by multiple rejections in recent months. A confirmed breakout above this level, especially if backed by a surge in volume, would not only trigger a triangle breakout but also complete the weekly candle formation as a bullish hammer, strengthening the bullish case.
If this breakout sustains, short-term targets line up at $20.290, with the long-term roadmap pointing toward $33.970.
📊 Key Highlights:
- 3SMA (7, 25, 99) MA cross signals the beginning of an upward trend.
- Daily ascending triangle points to persistent bullish pressure.
- $15.340 remains a crucial resistance; price has tested and failed here twice before.
- Breakout confirmation (with volume) could ignite a rapid move to $20.290.
- Failure to break may result in another retest of the triangle’s trendline support.
🚨 Conclusion:
All eyes are on the $15.340 resistance. Wait for clear daily close and volume confirmation before entering. A successful breakout aligns with a bullish weekly hammer and could trigger the next phase higher. Beware of fakeouts, as rejection at resistance could send INJUSDT to retest lower trendline zones.
Stay sharp and plan your entries wisely!
TradeCityPro | INJ Battles Key Resistance Amid Altseason Buzz👋 Welcome to TradeCity Pro!
In this analysis, I want to review the INJ coin for you. It’s one of the RWA and AI projects, currently ranked 63 on CoinMarketCap with a market cap of $1.51 billion.
📅 Daily Timeframe
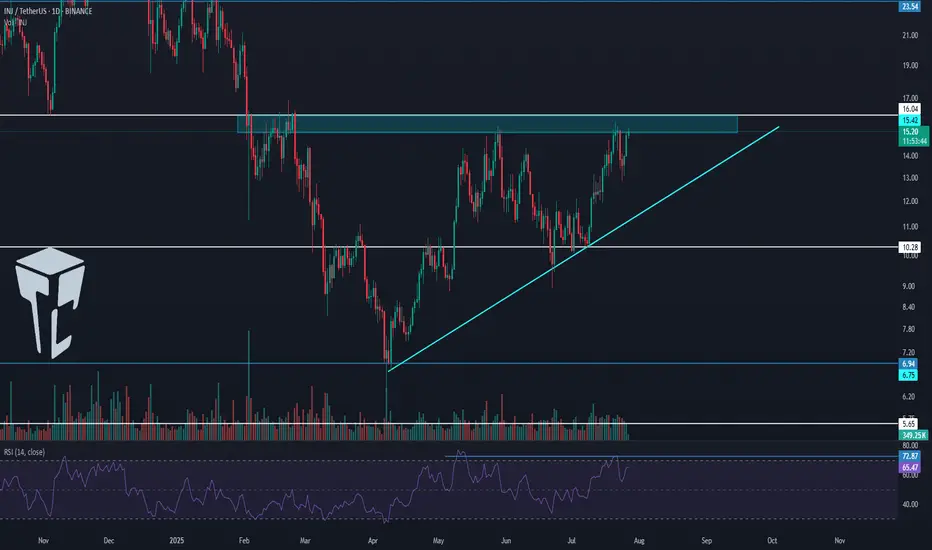
On the daily timeframe, after a drop to the 6.94 level, this coin has bounced back and is now moving upward along with a rising trendline.
✨ A strong support has formed at 10.28, and after price reacted to this level, a new bullish leg started and pushed the price up to 16.04.
🔔 There is a Maker Seller zone around 16.04 that has repeatedly prevented the continuation of the upward move, and currently price is struggling with it again.
📈 Breaking this zone will initiate a new phase of the trend. I plan to have a long position open if 16.04 is broken.
🛒 This trigger is also suitable for spot buying, and if Bitcoin pair and Bitcoin dominance confirm the move, we can consider buying in spot too. But personally, I prefer opening a futures position.
💥 Breaking the 72.87 zone on the RSI will be a solid confirmation for the entry of bullish momentum, and with this breakout, a new bullish leg can begin.
🔽 If a correction happens, I will wait for the trendline to break and will not open a short position for now.
Currently, the first trigger we have for a short is at 10.28.
📝 Final Thoughts
This analysis reflects our opinions and is not financial advice.
Share your thoughts in the comments, and don’t forget to share this analysis with your friends! ❤️
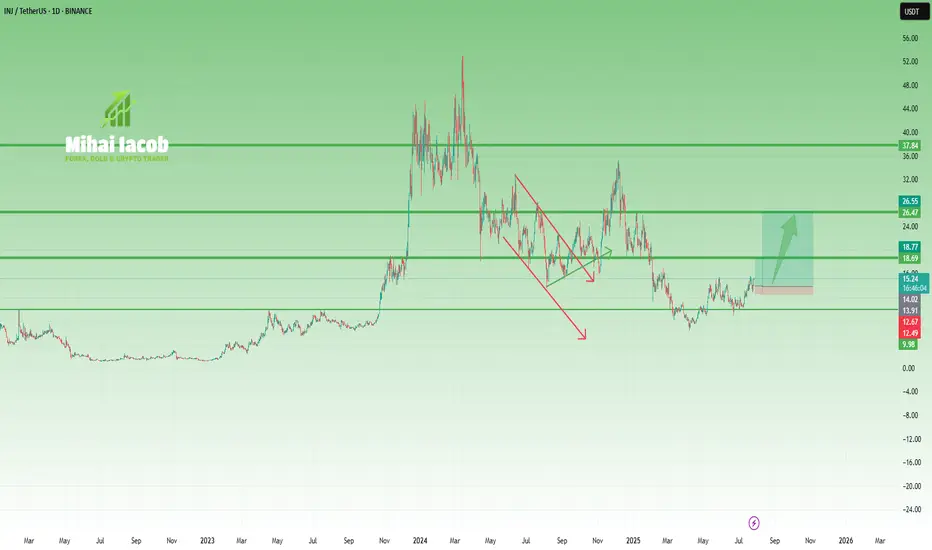
INJ – From Overhyped to Reasonable OpportunityA year and a half ago, INJ was in full hype mode, with fantasmagorical predictions of $200+, even though the coin had already done a 40x move.
(And not to brag—but at that moment, with INJ trading around $40, I said that $10 was far more likely than $200. It actually dropped to $6.5...)
Fast forward to today, and things are starting to look more constructive—at least, if you're not aiming for the moon:
🔹 After the local low at $6.5, price formed a small inverted Head & Shoulders
🔹 Then it confirmed new support at $10, a key psychological level and neckline zone
🔹 Now it's pressing into the $15.5 resistance
From my perspective, the setup is starting to favor the bulls.
If we get a clean breakout above $15.5, the next resistance is around $20, but I wouldn’t be surprised to see a push to $25–26, or even slightly above $30, if momentum builds.
📌 Not a hype call.
It’s a realistic technical setup, built on structure—not dreams.
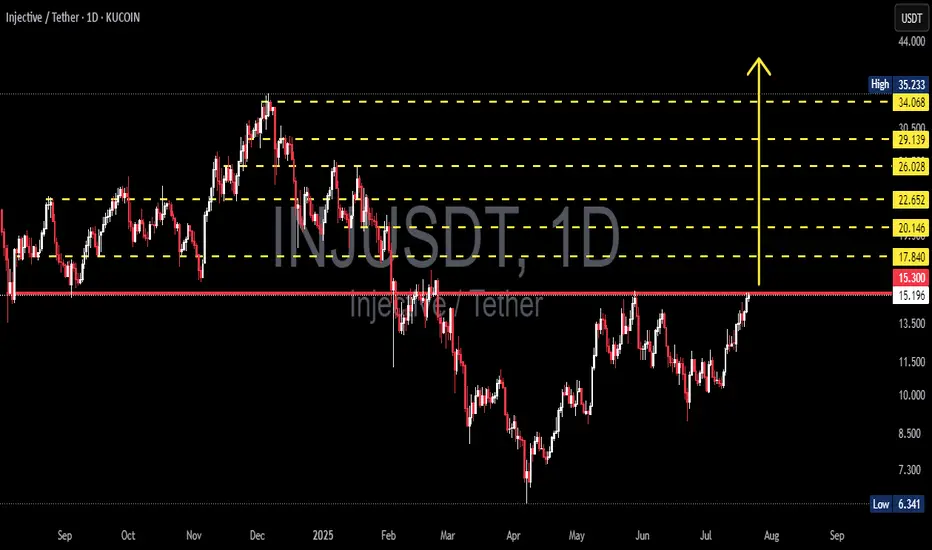
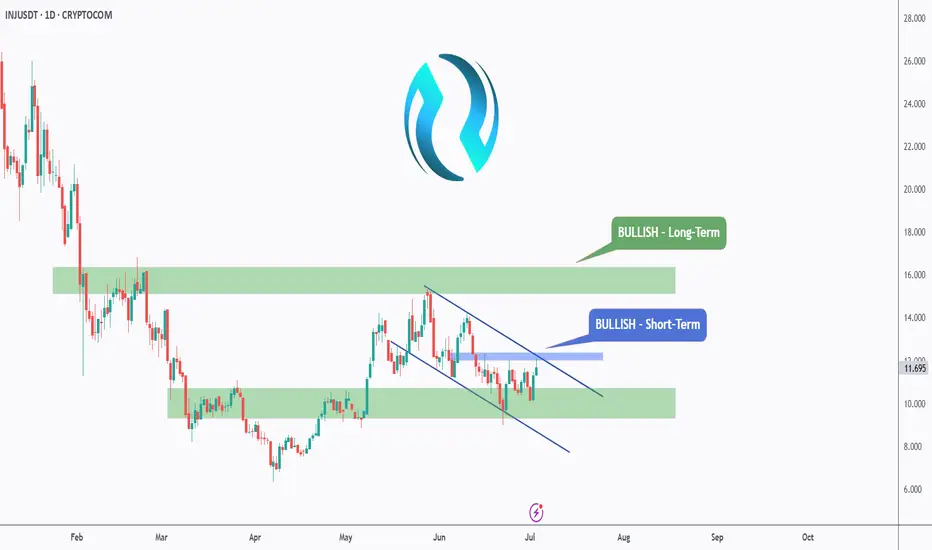
INJ/USDT at a Crucial Breakout Zone: Will the Path to $35 Unfold🧠 Full Technical Analysis (Daily Timeframe - KuCoin):
INJ/USDT (Injective Protocol) is currently at a critical decision point, testing a major resistance zone that has held strong since early 2025. After months of consolidation and a consistent structure of higher lows since May 2025, bullish pressure is now building momentum.
📊 Chart Pattern: Ascending Triangle Breakout in Progress
The price structure reveals a classic Ascending Triangle formation:
🔼 Rising support (higher lows) → signals accumulation.
⛔ Flat resistance at $15.30–$15.50 → key supply zone repeatedly tested.
This is a bullish continuation pattern, often leading to explosive upside once broken.
If the breakout is confirmed, INJ could rally through several historical resistance levels with strong potential for upside momentum.
📍 Key Resistance & Target Levels (Potential Take Profits):
Once price breaks above the key resistance, watch the following upside targets:
Level Significance
$17.84 Initial breakout confirmation level
$20.14 Psychological resistance & volume cluster
$22.65 Previous consolidation zone
$26.02 Intermediate high structure
$29.13 Strong resistance & prior distribution zone
$34.06 Final hurdle before reclaiming highs
$35.23 🔥 Major breakout target
🟢 Bullish Scenario:
✅ Daily close above $15.50 with strong volume = confirmed breakout.
🚀 Sequential target levels activated: $17.84 → $22.65 → $29.13 → $34.06.
💥 Potential for FOMO rally beyond $20, triggering long-term bullish trend.
🔴 Bearish Scenario (Rejection Case):
❌ Failure to break $15.30 leads to rejection.
⚠️ Downside targets: $13.20 → $12.00 → $10.60.
❌ Drop below $10.00 invalidates higher low structure and may trigger bearish reversal.
🧨 A sharp rejection may form a potential Double Top pattern, leading to downside pressure.
📈 Trading Strategy Recommendations:
🎯 Conservative Entry: Wait for breakout + retest confirmation at $15.50.
⚡ Aggressive Entry: Buy the breakout with tight stop-loss below $14.80.
📌 Consider laddered take-profits at each resistance level.
🔒 Use risk management — false breakouts are common in this zone.
---
🔍 Summary: Breakout Imminent or Final Rejection?
INJ is on the verge of a high-impact move. A confirmed breakout would likely trigger a trend reversal to the upside, while a failure could lead to another leg down. The next few candles will decide the medium-term direction. Traders should stay sharp, and act with a plan — this could be the start of something big.
⚠️ Always Trade with Discipline and Risk Management!
#INJUSDT #InjectiveProtocol #CryptoBreakout #AltcoinSetup #TechnicalAnalysis#BullishCrypto #PriceAction #CryptoSignals #BreakoutTrade #CryptoStrategy
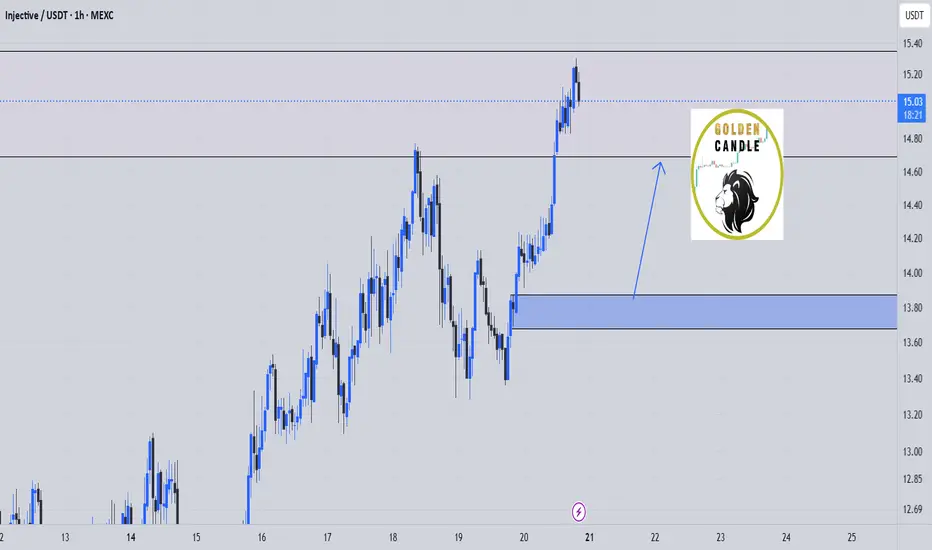
inj buy midterm"🌟 Welcome to Golden Candle! 🌟
We're a team of 📈 passionate traders 📉 who love sharing our 🔍 technical analysis insights 🔎 with the TradingView community. 🌎
Our goal is to provide 💡 valuable perspectives 💡 on market trends and patterns, but 🚫 please note that our analyses are not intended as buy or sell recommendations. 🚫
Instead, they reflect our own 💭 personal attitudes and thoughts. 💭
Follow along and 📚 learn 📚 from our analyses! 📊💡"
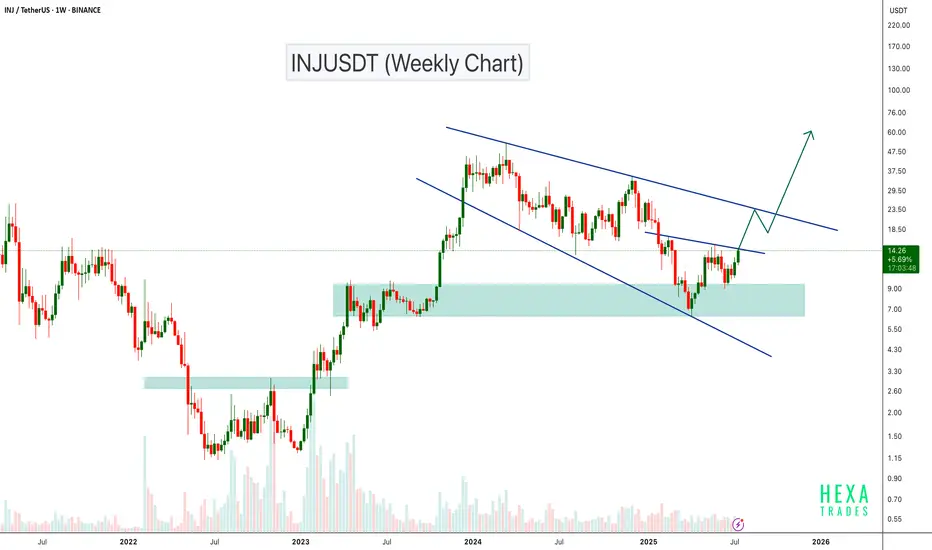
INJUSDT Approaching Key Wedge Resistance – Breakout Ahead?INJ is currently trading inside a broadening wedge pattern on the weekly timeframe. The price recently bounced strongly from the major demand zone around $8–$9, which has acted as a reliable support level in the past.
Now, INJ is approaching the upper resistance trendline of the broadening wedge. A confirmed breakout above this level could lead to a strong bullish move, potentially targeting the $50 level.
Cheers
Hexa
CRYPTOCAP:INJ BINANCE:INJUSDT
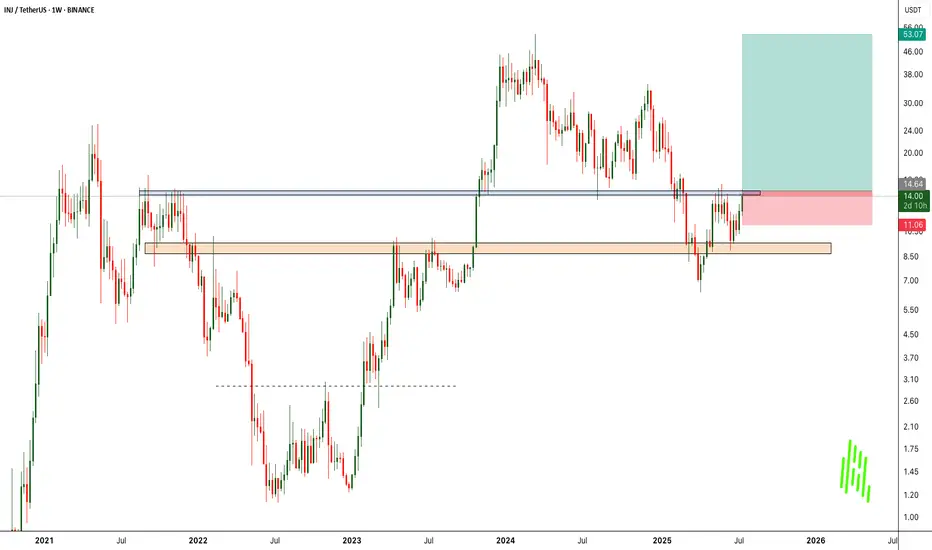
INJUSDT Bulls Are Back! All-Time High Could Be Next!
BINANCE:INJUSDT has shown a strong and clean bounce from a major support zone, indicating that buyers are stepping in aggressively at lower levels. This bounce reinforces the strength of the current uptrend and reflects growing bullish sentiment.
At the moment, the price is facing a significant resistance level. This area has previously acted as a barrier, but with increasing volume and momentum, we expect BINANCE:INJUSDT to break out from this resistance and continue its upward move.
If the breakout occurs, our target is the previous all-time high, as there is limited resistance above the current zone. This presents a high-reward opportunity for traders looking for breakout setups.
As always, managing risk is key. Use a well-placed stop loss below the support level to protect your capital. Breakouts can be explosive, but discipline and proper risk management make all the difference.
BINANCE:INJUSDT Currently trading at $14.4
Buy level : Above $14.5
Stop loss : Below $11
Target 1: $20
Target 2: $35
Target 3: $40
Target 4: $53
Max leverage 2x
Always keep stop loss
Follow Our Tradingview Account for More Technical Analysis Updates, | Like, Share and Comment Your thoughts
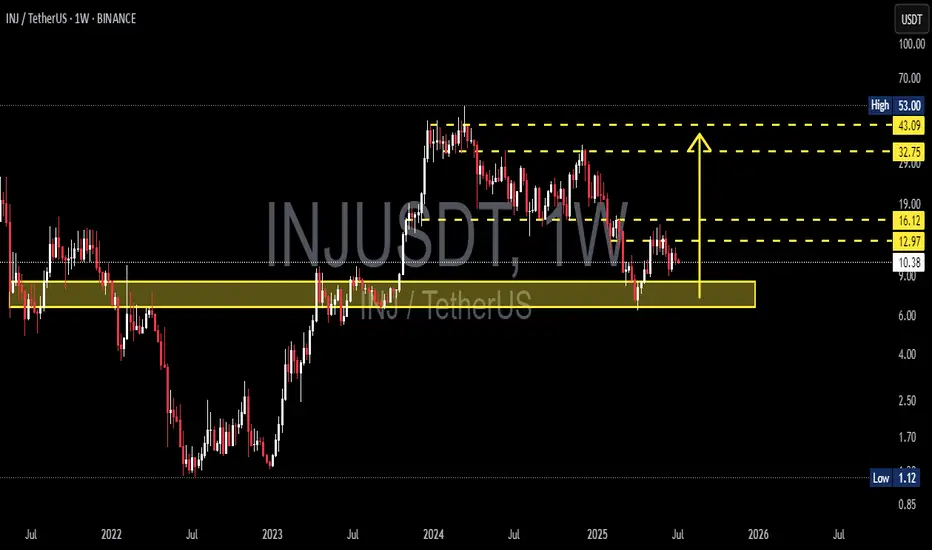
INJ/USDT Weekly Outlook – Holding the Golden Zone!
📊 Complete Technical Analysis:
INJ/USDT is currently sitting at a critical weekly demand zone between $7.50 – $9.00, an area that has consistently triggered strong bullish reversals since mid-2022. This yellow zone represents a historical accumulation range, where buyers have stepped in aggressively during past dips.
The structure is forming a potential Double Bottom or even a base accumulation pattern, which often precedes explosive upward movements.
🟢 Bullish Scenario (Optimistic Outlook):
If price continues to hold above this key support, a bullish reversal is highly probable.
🔼 Upside Targets:
1. First Target: $12.97 – initial resistance level
2. Mid Target: $16.12 – previously a strong distribution zone
3. Major Target: $32.75 to $43.09 – major resistance from the last peak phase
💡 Bullish Confirmation:
Weekly candle closes above $12.97 with volume
Bullish price action near the support zone
Formation of higher lows on the weekly chart
Once price breaks above $16.12, INJ could accelerate toward the $30–$40 range.
🔴 Bearish Scenario (Caution Required):
However, if price breaks down below the $9.00 support zone with strong volume and a full-bodied weekly candle close, downside risk increases.
🔽 Bearish Targets:
$7.50 – psychological support
$5.00 – deeper support zone
$1.12 – extreme scenario (previous macro bottom)
⚠️ Bearish Signs:
Strong rejection at $12.97
Weekly close below the yellow demand zone with significant sell volume
📉 Market Psychology & Pattern Insight:
The market is in a highly emotional phase, but accumulation signs are visible.
Retail traders may panic near $9.00, but smart money often buys quietly in these zones.
This is a "patience zone" — where big moves are quietly prepared before launching.
📎 Conclusion:
> INJ is currently testing a powerful historical support zone. A breakout above $12.97 could trigger a multi-leg rally toward $30–$43. However, a breakdown below $9.00 would invalidate the bullish setup and call for caution.
#INJUSDT #CryptoAnalysis #AltcoinBreakout #TechnicalAnalysis
#SupportAndResistance #BullishSetup #BearishScenario #DoubleBottom
#PriceAction #CryptoTrading
inj buy long setup, scalp intraday setupTake it tension free sl is very tigh, wick below the sl doesn't matter candle closed then setup is invalid. If tp hits without filling entry then setup is not valid
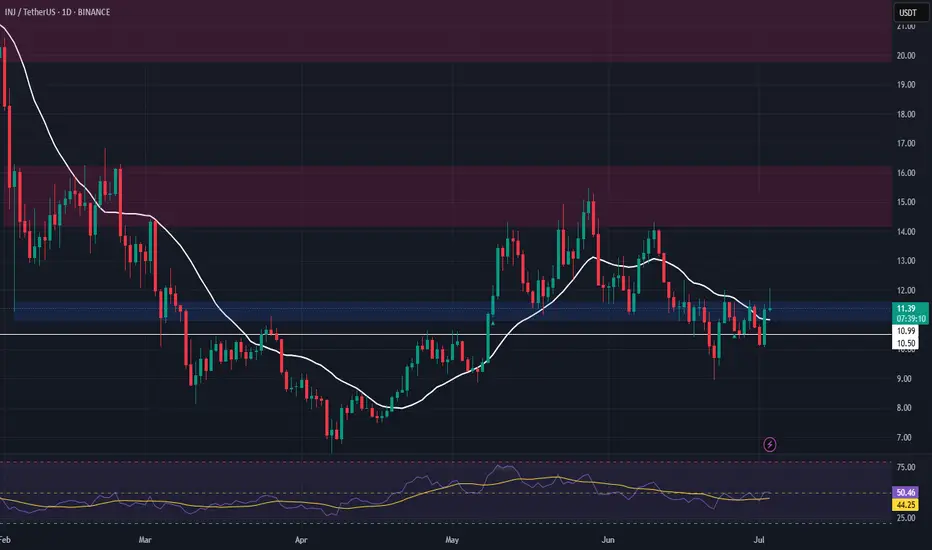
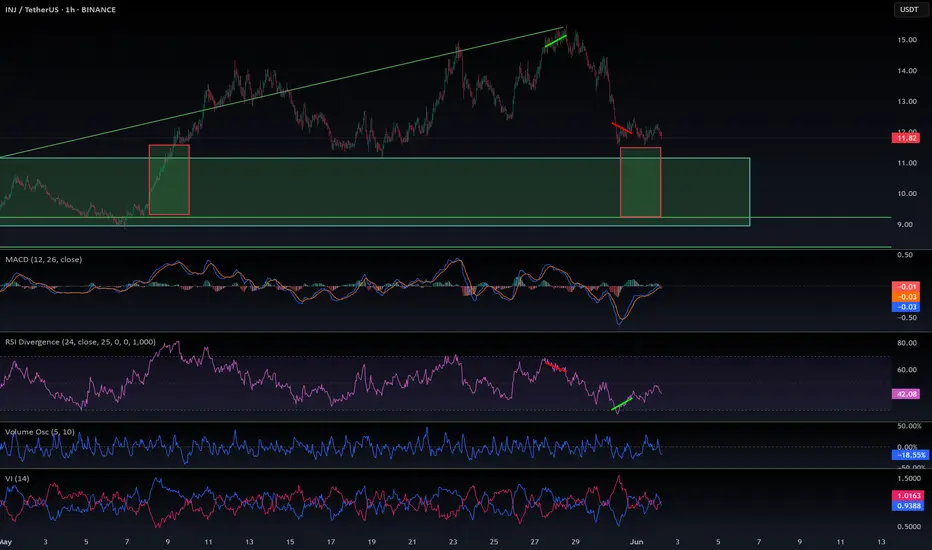
INJ Long Swing Setup – Structural Recovery with SMA ReclaimINJ has retraced to a key support zone and is showing early signs of recovery, reclaiming its 20-day SMA. With structural strength returning, the $11.00–$11.60 range offers a solid swing entry—contingent on BTC holding key levels.
📌 Trade Setup:
• Entry Zone: $11.00 – $11.60
• Take Profit Targets:
o 🥇 $14.00 – $16.00
o 🥈 $19.80 – $23.00
• Stop Loss: Daily close below $9.50 (Exit early if BTC breaks major support)
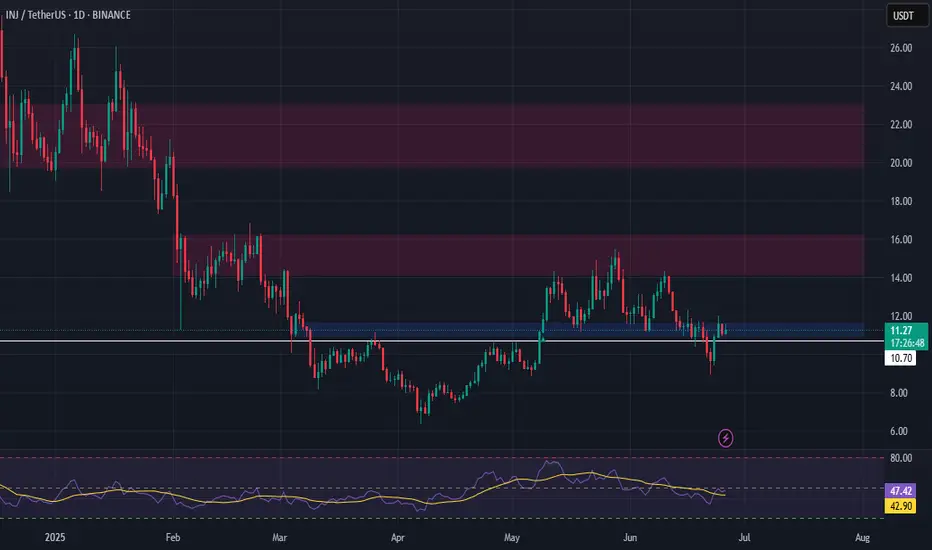
INJ - Back from the Dead?Hello TradingView Family / Fellow Traders. This is Richard, also known as theSignalyst.
INJ has been hovering within a wide range between our two green zones, spanning from $10 to $16.
For the bulls to take control in the medium term, a break above the last major high marked in blue is needed.
To confirm long-term bullish dominance, a breakout above the upper boundary of the green range is required.
📚 Always follow your trading plan regarding entry, risk management, and trade management.
Good luck!
All Strategies Are Good; If Managed Properly!
~Rich
#INJ/USDT#INJ
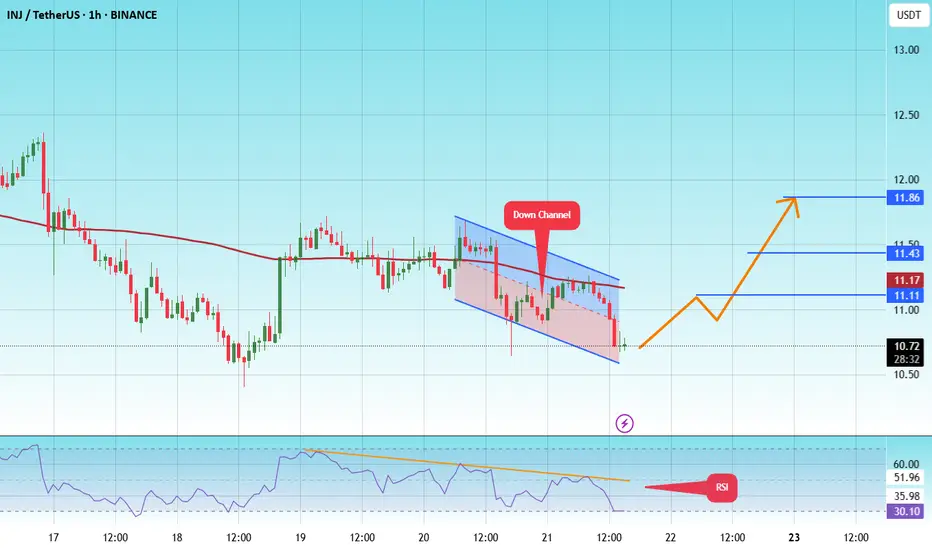
The price is moving within a descending channel on the 1-hour frame and is expected to break and continue upward.
We have a trend to stabilize above the 100 moving average once again.
We have a downtrend on the RSI indicator that supports the upward move with a breakout.
We have a support area at the lower limit of the channel at 0.04263, acting as strong support from which the price can rebound.
Entry price: 10.70
First target: 11.11
Second target: 11.43
Third target: 11.86
INJ Long Swing Setup – Breakout Retest Opportunity at Key LevelIf the crypto market pushes higher and INJ flips current resistance into support, we’ll be looking to enter on a retest of the $11.60 zone. This level could act as a launchpad for the next leg up.
📌 Trade Setup:
• Entry Zone: $11.60 – $11.60 (Breakout Retest)
• Take Profit Targets:
o 🥇 $14.20 – $16.25
o 🥈 $19.80 – $23.00
• Stop Loss: Daily close below $10.70
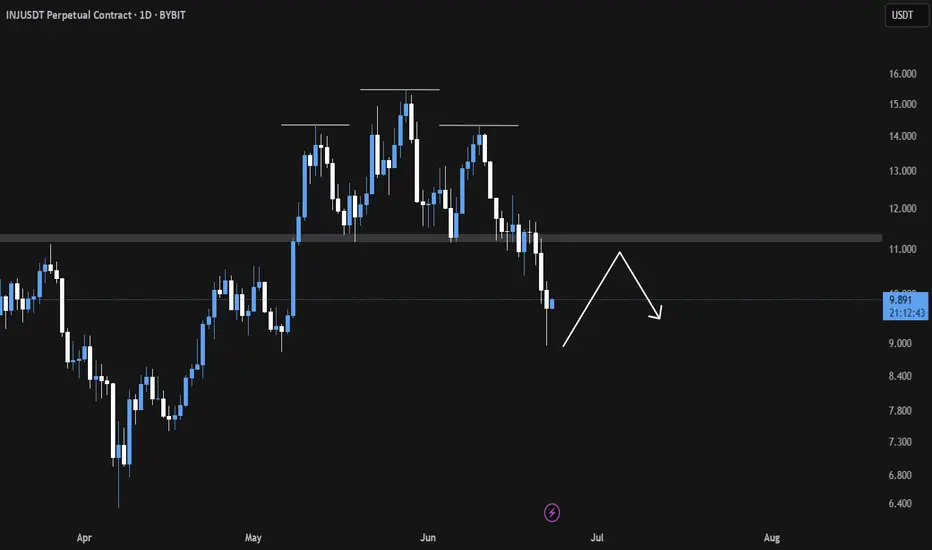
INJ Breakdown in Play Eyeing the Neckline for Precision ShortsINJ/USDT Analysis
〽️ The Head and Shoulders pattern has broken down successfully, confirming a bearish structure.
💠We anticipate a potential relief bounce towards the $11 region which aligns closely with the neckline retest zone. This area is likely to act as a liquidity trap, where institutional sellers may re-enter aggressively 👀.
🎯 Key downside targets remain at
1. $8.98
2. $8.03
3. $6.92
Strategic Plan 🎖️
Look to initiate short positions around the neckline retest near $11, as the risk-reward becomes increasingly favorable from that level.
Trade with discipline. Let the structure lead the execution. 🫡🧠
$INJ to re-enter my buy zone? $11.12 must hold!Altcoins are experiencing another pullback.
CRYPTOCAP:INJ had a solid pump recently, but it’s now facing a significant drop.
This could be a good buying opportunity — assuming we’re not entering a bear market.
Key level: $11.12 must hold.
If it breaks, the next major support is around $9.10.
While the macro trend remains bullish, this retracement is concerning.
Set your stop losses accordingly.
DYOR.
#INJ #Altcoins #CryptoTrading #MarketUpdate #CryptoAlert #BuyTheDip #DYOR
INJUSDTA breakout of the last lower low, a retest of resistance, and a rise above the breakout candle.
A 15% target at $15.
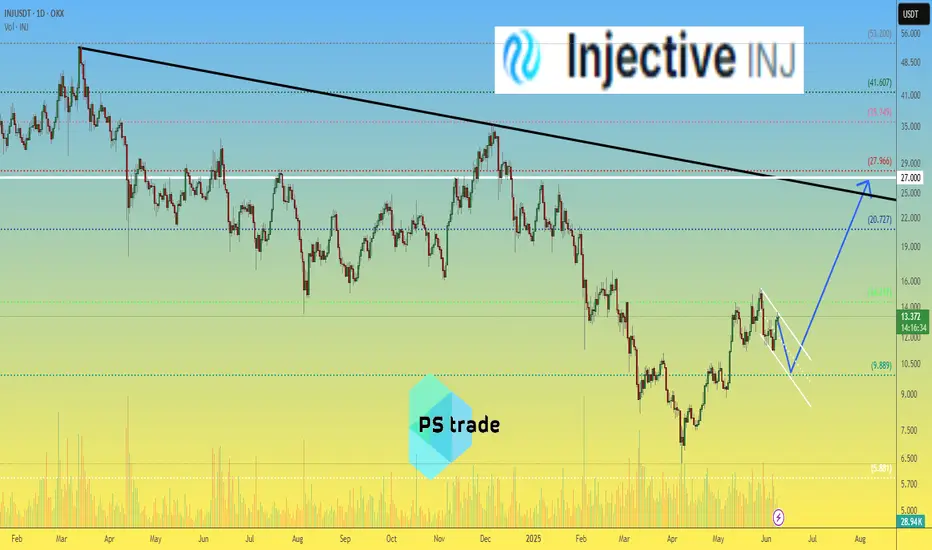
Injective INJ price analysis🔼 We saw an infographic showing that the #Injective ecosystem currently ranks second in terms of capital inflow and retention. (First place goes to #Ethereum CRYPTOCAP:ETH with a threefold lead.)
🕯 Now let's check this information on the OKX:INJUSDT price chart, and we can see that there is indeed “buyer power”. After two months of growth, the price of #INJUSD is now adjusting quite moderately.
🍿 So, if #Injective is “preparing something really interesting” for the summer, then the price of their #INJ token should not fall below $10.
From there, it will be possible to organize “modest” growth, at least up to $27.
_____________________
Did you like our analysis? Leave a comment, like, and follow to get more
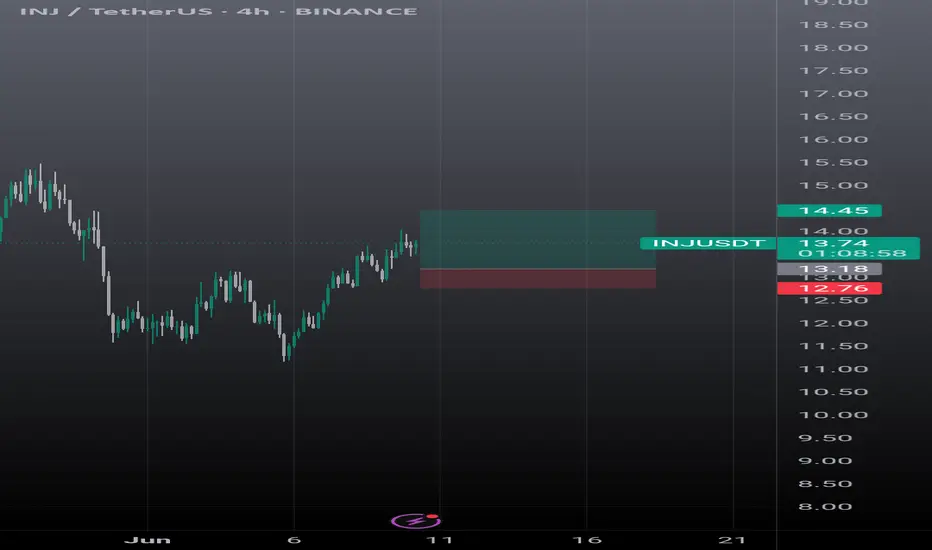
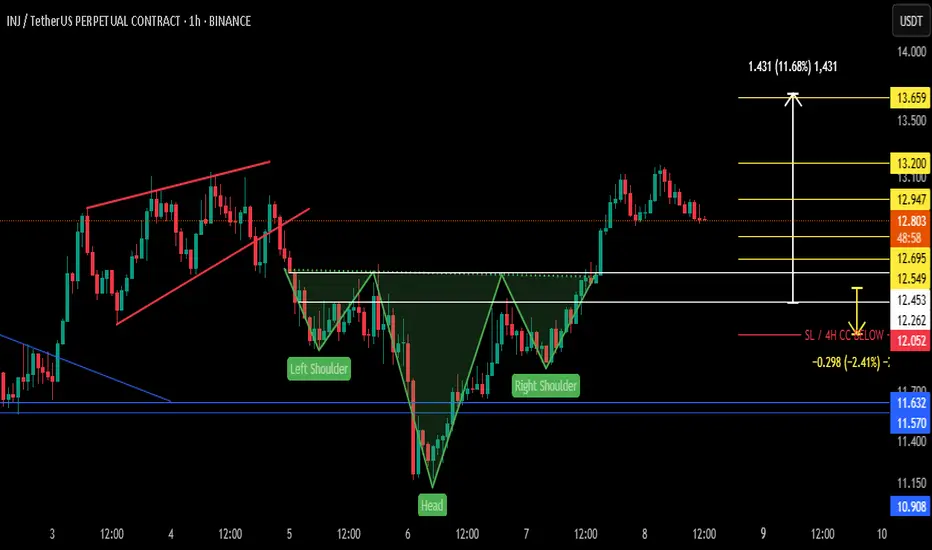
$INJ - Inverted head and shouldersCRYPTOCAP:INJ
BINANCE:INJUSDT.P
The price recently broke out from the inverted head and shoulders pattern; now, the price is going to retest the pattern's neckline.
If the price hits and bounces above the white line zone, or if the 4H candle hits and closes above the upper white line, it will be a good long opportunity.
TP: YELOW LINES
SL: 12.052 / 4H CC BELOW
NFA, DYOR
FOLLOW FOR MORE AND SHARE WITH YOUR COMMUNITY.
DON'T FORGET TO HIT THE BOOST BUTTON.
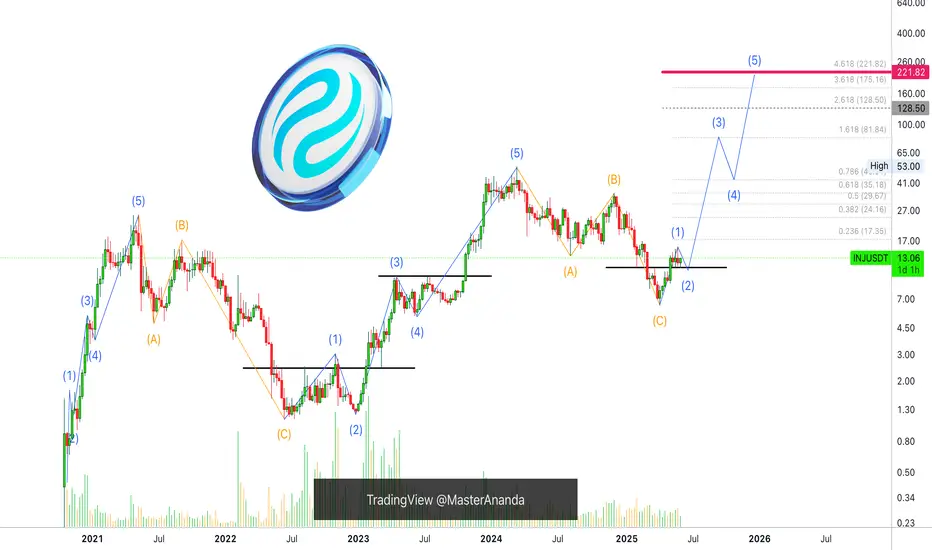
Injective & Elliott WavesAn impulse leads to a correction. A correction leads to an impulse.
The chart here starts with a bullish impulse. 1,2,3,4,5—blue-left. This impulse leads to a correction. ABC—orange.
The first ABC correction, the bear market, ends June 2022.
A correction leads to an impulse so a new bullish impulse starts right after and we have a new 5-up waves. 1,2,3,4,5—blue-center.
The bullish impulse ends March 2024 and this leads to a new ABC correction. Orange-right. The correction hits bottom 7-April 2025. The end of the correction signals the start of a new bullish impulse, 1,2,3,4,5 blue-right. The 2025 bull market.
This is Elliott Wave Theory simplified.
Namaste.