#INJ/ (INJ): Looking For Break of Structure | Bullish#INJ
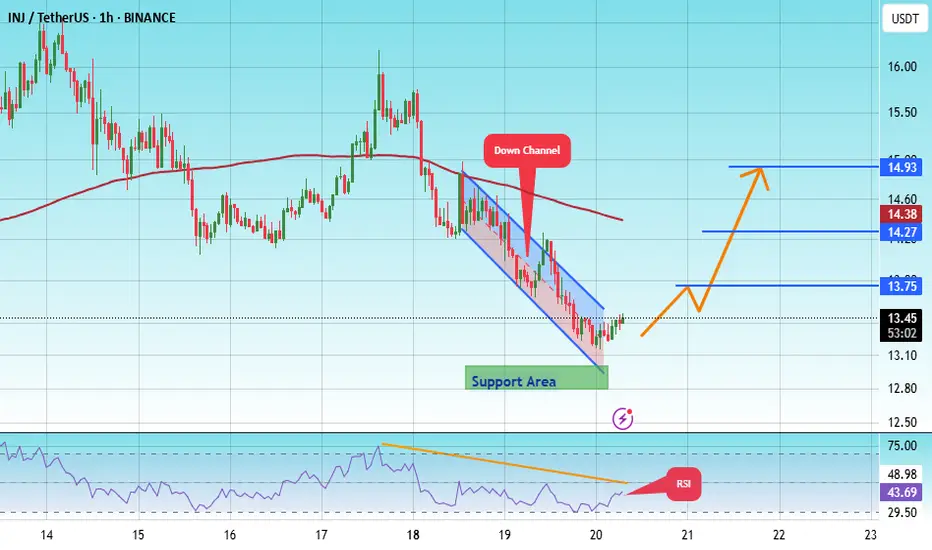
The price is moving within an ascending channel on the 1-hour frame, adhering well to it, and is on its way to break it strongly upwards and retest it.
We have support from the lower boundary of the ascending channel, at 13.00.
We have a downtrend on the RSI indicator that is about to break and retest, supporting the upside.
There is a major support area in green at 12.86, which represents a strong basis for the upside.
Don't forget a simple thing: ease and capital.
When you reach the first target, save some money and then change your stop-loss order to an entry order.
For inquiries, please leave a comment.
We have a trend to hold above the 100 Moving Average.
Entry price: 13.44
First target: 13.75
Second target: 14.27
Third target: 14.93
Don't forget a simple thing: ease and capital.
When you reach the first target, save some money and then change your stop-loss order to an entry order.
For inquiries, please leave a comment.
Thank you.
Injusdtbuy
INJ/USDT Setup Live | Bullish Plan to Hit Target @ 16.100🚀 INJECTIVE BREAKOUT RAID: Thief Layers the Grid for the Next Crypto Heist 💣🧠
💼 Asset: INJ/USDT — Injective vs Tether
🧭 Plan: Bullish Grid Strategy
🎯 Target: 16.100
🛑 Stop Loss: 12.500
🔫 Entry: Any Price — We Layer Like Pros
🦹♂️ Yo Market Robbers, Snipers & Grid Lords! 🦹♀️
Injective's about to pay big bags, and the Thief is already inside the system. 🔓
This ain’t no simple play — this is layered entry warfare, the grid strategy special. We ain’t chasing price, we’re setting traps, limit by limit, like silent assassins. 🧊🎯
📊 ENTRY STRATEGY
Thief sets layered limit orders like landmines:
💥 Entry: Any level — let the price come to YOU.
🧱 Grid-style entries with sniper precision. Patience is power.
🛑 STOP LOSS SETUP
Below enemy lines —
🔻 Hard SL @ 12.500 to avoid detection.
🎭 Disappear if the zone gets compromised.
🎯 TARGET ZONE
High-value vault spotted @ 16.100
Get in, loot, and vanish like a shadow in the blockchain. ⛓️💸
📈 WHY THIS RAID WORKS
Market favoring bulls — trend riding 🔥
Liquidity gaps above = potential explosion 💣
Sentiment flipping bullish — Thief smells blood 💉
Layering lets you enter without alerting the guards 🚨
🧠 Thief Wisdom
Don’t chase pumps. Let the market fill your bags passively.
Stay emotionless. Stay planned. Stay funded. 💼📈
💖 Boost the Thief Crew
If this mission blueprint matches your grind, smash the ❤️ Boost, drop a comment, and let’s rob the market together — one clean heist at a time. 🧤🕵️
More plays loading soon. Until then…
Rob Smart. Rob Quiet. Rob Rich. 💰🐱👤

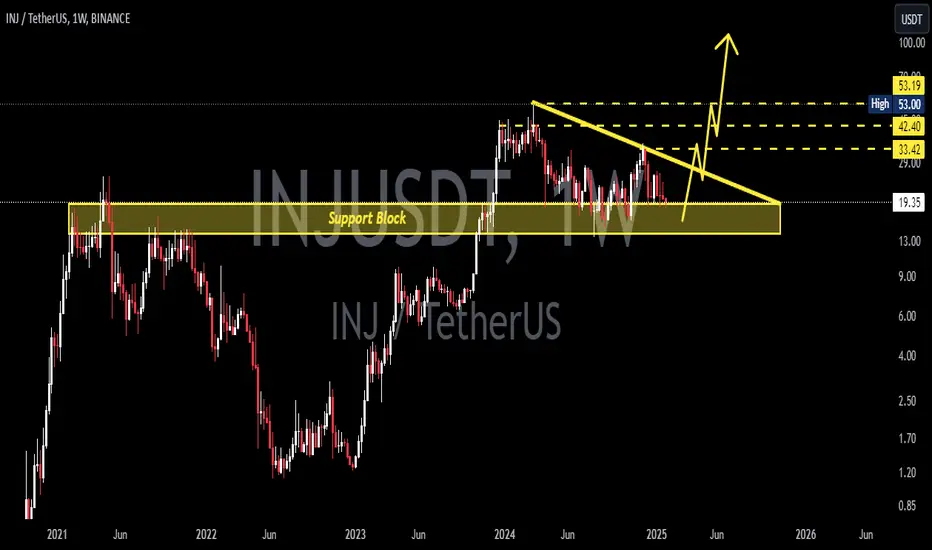
INJUSDT Bulls Are Back! All-Time High Could Be Next!
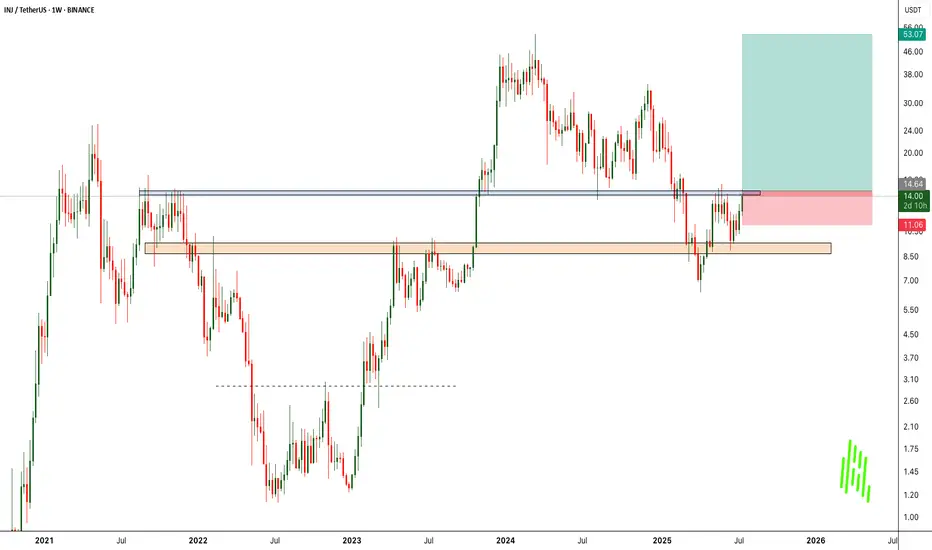
BINANCE:INJUSDT has shown a strong and clean bounce from a major support zone, indicating that buyers are stepping in aggressively at lower levels. This bounce reinforces the strength of the current uptrend and reflects growing bullish sentiment.
At the moment, the price is facing a significant resistance level. This area has previously acted as a barrier, but with increasing volume and momentum, we expect BINANCE:INJUSDT to break out from this resistance and continue its upward move.
If the breakout occurs, our target is the previous all-time high, as there is limited resistance above the current zone. This presents a high-reward opportunity for traders looking for breakout setups.
As always, managing risk is key. Use a well-placed stop loss below the support level to protect your capital. Breakouts can be explosive, but discipline and proper risk management make all the difference.
BINANCE:INJUSDT Currently trading at $14.4
Buy level : Above $14.5
Stop loss : Below $11
Target 1: $20
Target 2: $35
Target 3: $40
Target 4: $53
Max leverage 2x
Always keep stop loss
Follow Our Tradingview Account for More Technical Analysis Updates, | Like, Share and Comment Your thoughts
INJ/USDT Weekly Outlook – Holding the Golden Zone!
📊 Complete Technical Analysis:
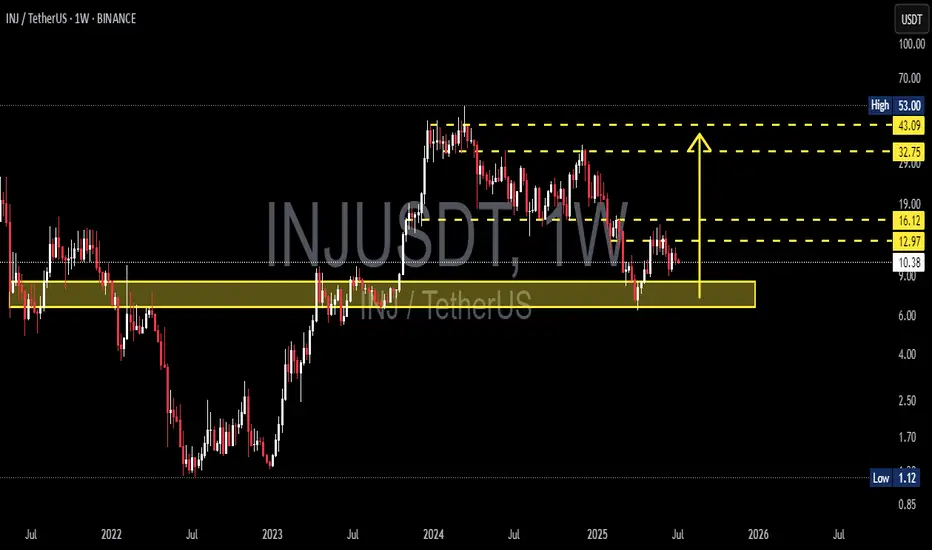
INJ/USDT is currently sitting at a critical weekly demand zone between $7.50 – $9.00, an area that has consistently triggered strong bullish reversals since mid-2022. This yellow zone represents a historical accumulation range, where buyers have stepped in aggressively during past dips.
The structure is forming a potential Double Bottom or even a base accumulation pattern, which often precedes explosive upward movements.
🟢 Bullish Scenario (Optimistic Outlook):
If price continues to hold above this key support, a bullish reversal is highly probable.
🔼 Upside Targets:
1. First Target: $12.97 – initial resistance level
2. Mid Target: $16.12 – previously a strong distribution zone
3. Major Target: $32.75 to $43.09 – major resistance from the last peak phase
💡 Bullish Confirmation:
Weekly candle closes above $12.97 with volume
Bullish price action near the support zone
Formation of higher lows on the weekly chart
Once price breaks above $16.12, INJ could accelerate toward the $30–$40 range.
🔴 Bearish Scenario (Caution Required):
However, if price breaks down below the $9.00 support zone with strong volume and a full-bodied weekly candle close, downside risk increases.
🔽 Bearish Targets:
$7.50 – psychological support
$5.00 – deeper support zone
$1.12 – extreme scenario (previous macro bottom)
⚠️ Bearish Signs:
Strong rejection at $12.97
Weekly close below the yellow demand zone with significant sell volume
📉 Market Psychology & Pattern Insight:
The market is in a highly emotional phase, but accumulation signs are visible.
Retail traders may panic near $9.00, but smart money often buys quietly in these zones.
This is a "patience zone" — where big moves are quietly prepared before launching.
📎 Conclusion:
> INJ is currently testing a powerful historical support zone. A breakout above $12.97 could trigger a multi-leg rally toward $30–$43. However, a breakdown below $9.00 would invalidate the bullish setup and call for caution.
#INJUSDT #CryptoAnalysis #AltcoinBreakout #TechnicalAnalysis
#SupportAndResistance #BullishSetup #BearishScenario #DoubleBottom
#PriceAction #CryptoTrading
INJUSDT 1WINJ ~ 1W Analysis
#INJ Test this support, buy gradually from here with a short -term target of at least 20%+.

INJUSDT 1WINJ ~ 1W Analysis
#INJ Form a bullish flag pattern. Buy gradually from here with a minimum target of 20%+.
INJUSDT 1WINJ ~ 1W Analysis
#INJ In this time frame 1W the main support that previously held the price, Buy from here if you still have a Conviction on this coin with a minimum target of 20%+
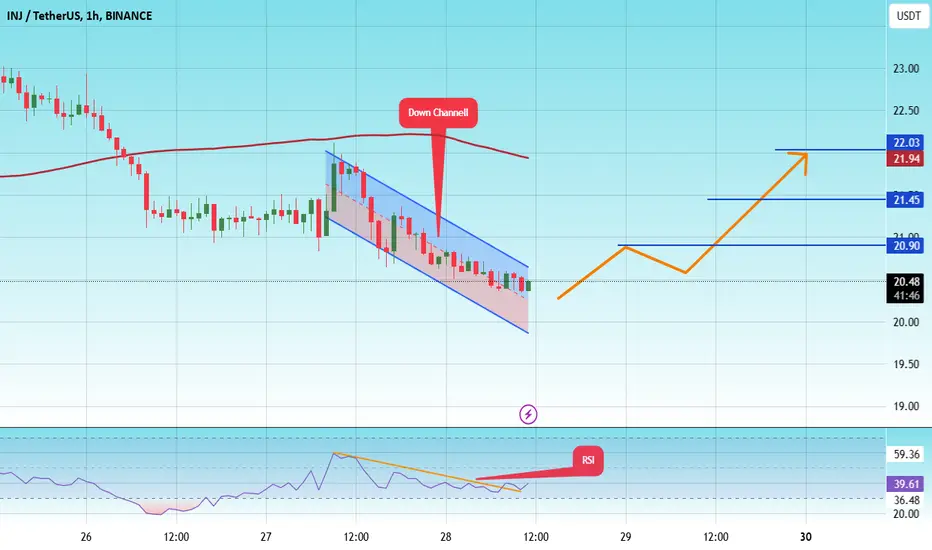
#INJ/USDT#INJ
The price is moving in a descending channel on the 1-hour frame and is expected to continue upwards
We have a trend to stabilize above the moving average 100 again
We have a descending trend on the RSI indicator that supports the rise by breaking it upwards
We have a support area at the lower limit of the channel at a price of 20.14
Entry price 20.40
First target 20.90
Second target 21.45
Third target 22.00
#INJ/USDT Ready to go up#INJ
The price is moving in a descending channel on the 1-hour frame and sticking to it well
We have a bounce from the lower limit of the descending channel, this support is at 23.40
We have a downtrend, the RSI indicator is about to break, which supports the rise
We have a trend to stabilize above the moving average 100
Entry price 24.50
First target 25.23
Second target 26.34
Third target 27.81

INJUSDTINJ ~ 1W
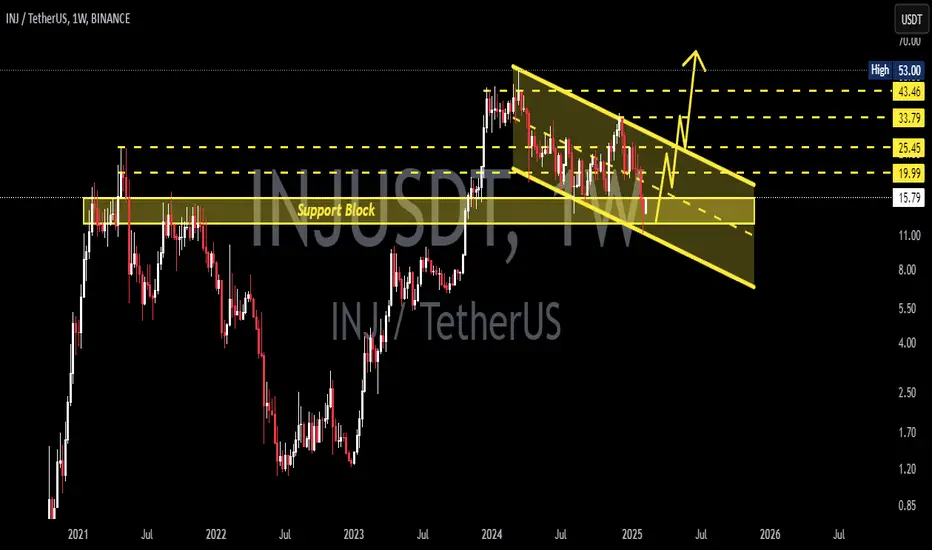
#INJ This support block is strong enough for now. Maybe our first purchase of this coin will be placed here. short term target of at least 20%++ from here.
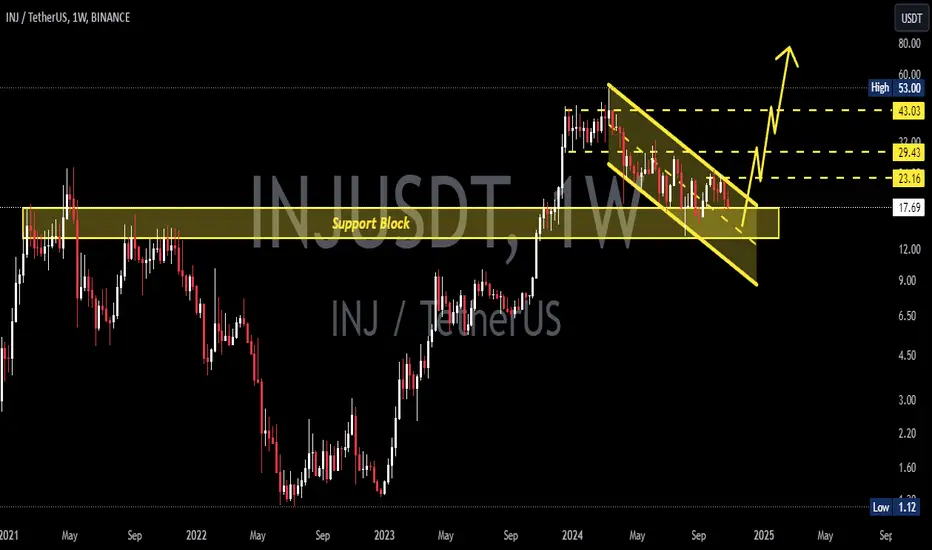
INJUSDT Strong Bounce and Trendline Breakout. 3-Digit Potential!INJUSDT has bounced off a significant support level and executed a powerful breakout from its trendline. With the 2021 ATH acting as major support, we anticipate a bullish momentum building toward the $30 mark. Given the current market dynamics, a move into the three-digit territory seems possible in the near future. Keep an eye on this one for potential upside!
INJUSDT Currently trading at $21.7
Buy level: Above $21
Stop loss: Below $17.5
TP1: $25
TP2: $30
TP3: $39
TP4: $53
Max Leverage 3x
Follow Our Tradingview Account for More Technical Analysis Updates, | Like, Share and Comment Your thoughts

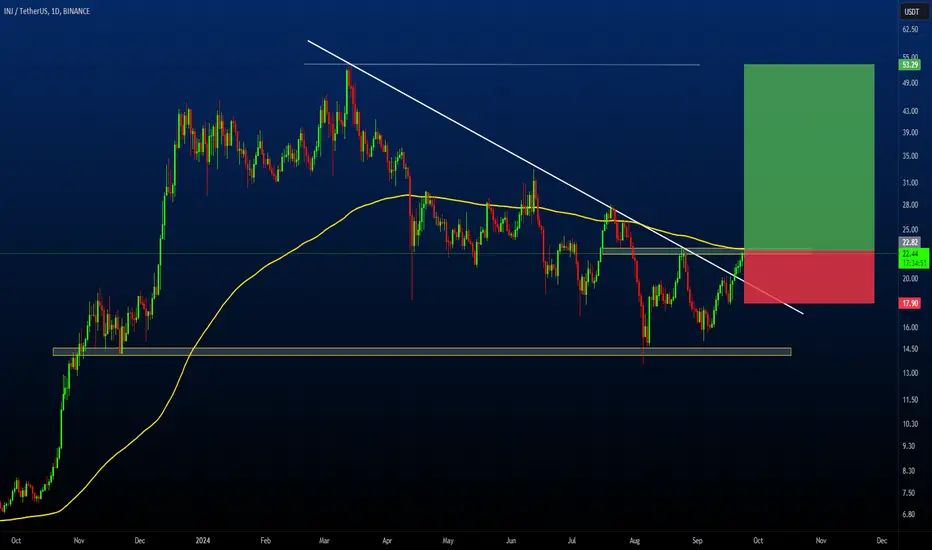
INJUSDT All-Time High Soon?INJ/USDT has successfully bounced off a major support level, setting the stage for an upward move. The price has broken through a key trendline and is now facing minor resistance around $23. A breakthrough of this resistance could lead to a significant price rally as INJ aims to reclaim its all-time high.
Trade safe and always remember to use a stop loss to manage your risk!
INJUSDT (4h Chart) Technical analysis
INJUSDT (4h Chart) Currently trading at $22.4
Buy level: Above $22.75
Stop loss: Below $18
TP1: $26
TP2: $31
TP3: $40
TP4: $53
Max Leverage 3x
Follow Our Tradingview Account for More Technical Analysis Updates, | Like, Share and Comment Your thoughts
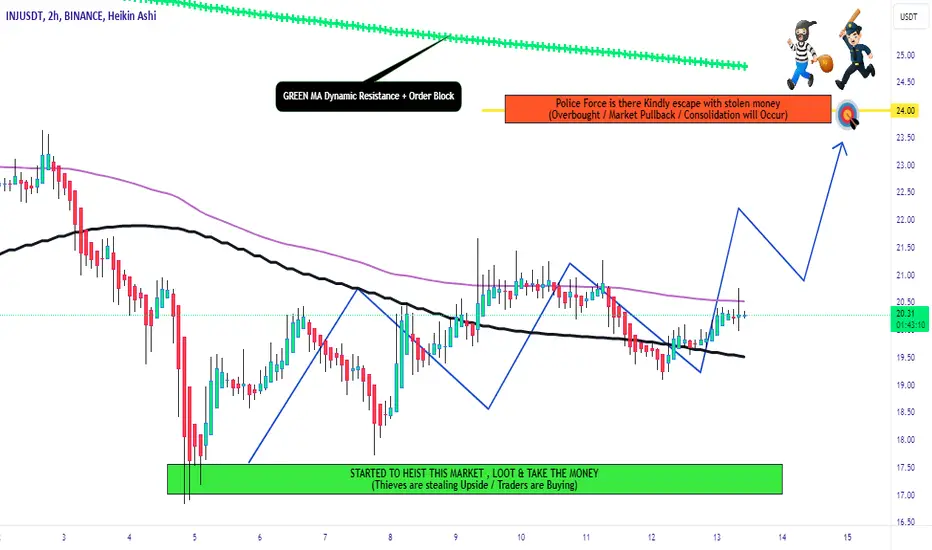
INJUSD market Bullish Direction money heist planMy Dear Robbers / Traders,
This is our master plan to Heist INJUSD Market based on Thief Trading style Technical Analysis.. kindly please follow the plan I have mentioned in the chart focus on Long entry. Our target is Red Zone that is High risk Dangerous level, market is overbought / Consolidation / Trend Reversal at the level Bearish Robbers / Traders gain the strength. Be safe and be careful and Be rich.
Note: If you've got a lot of money you can get out right away otherwise you can join with a swing trade robbers and continue the heist plan, Use Trailing SL to protect our money.
Stop Loss : Recent Swing Low using 2h timeframe
Warning : Fundamental Analysis comes against our robbery plan. our plan will be ruined smash the Stop Loss. Don't Enter the market at the news update.
Loot and escape on the target 🎯 Swing Traders Plz Book the partial sum of money and wait for next breakout of dynamic level / Order block, Once it is cleared we can continue our heist plan to next new target.
support our robbery plan we can easily make money & take money 💰💵 Join your hands with US. Loot Everything in this market everyday make money easily with Thief Trading Style.
#INJ/USDT#INJ
The price is moving in a bearish channel pattern on a 24-hour frame, and it adheres to it well and is expected to break it upward
The price rebounded well from the lower border of the channel at the green support level of 22.00
We have a tendency to stabilize above the Moving Average 100
We have oversold resistance on the RSI indicator to support the rise, with a downtrend about to break higher
Entry price is 23.70
The first target is 25.80
The second goal is 27.00
Third goal 29.30
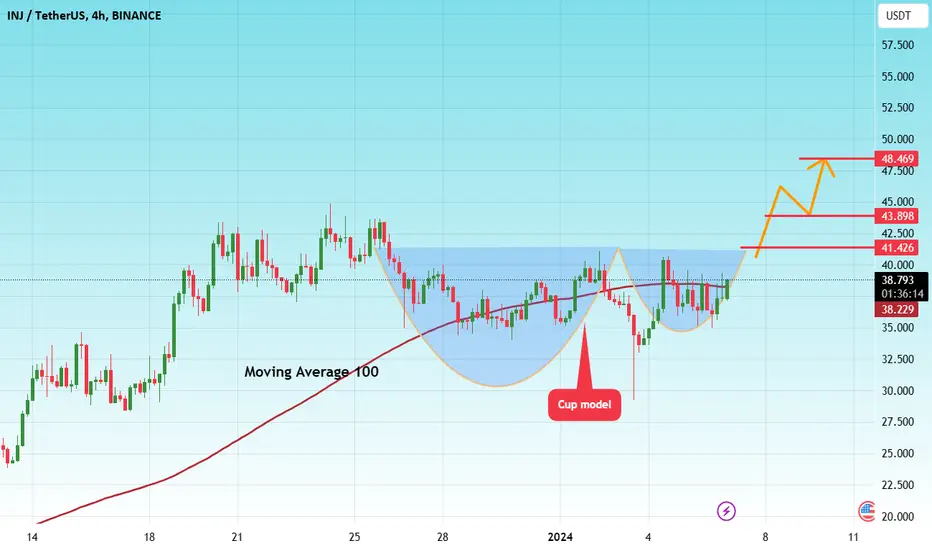
#INJUSDT LONG#INJ
The price has been moving in a cup pattern since mid-December
Now the model is completed well
It is expected that the price will continue to rise
with the support of Moving Average 100
Current price 38.77
The first goal is 41.42
The second goal is 43.90
Third goal 48.46
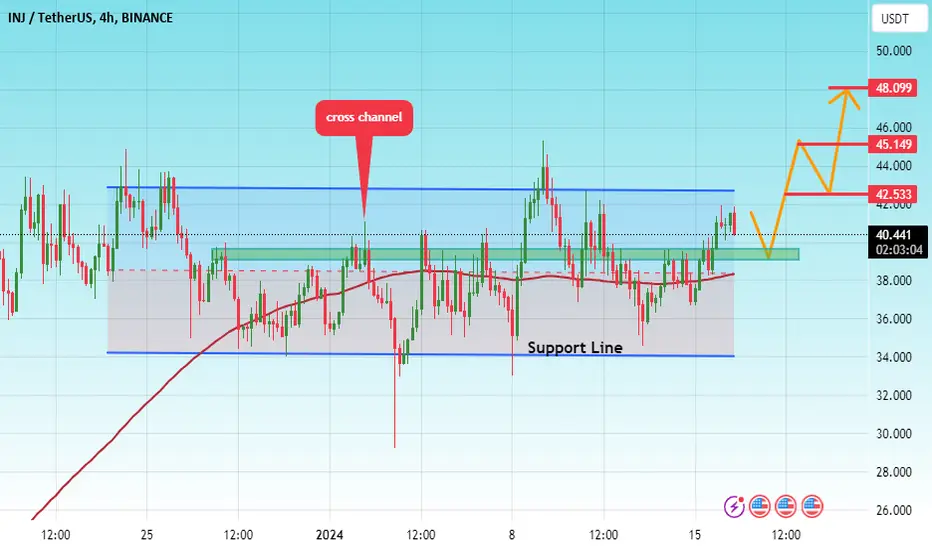
#INJ/USDT#INJ
On the 4-hour frame we have a cross channel that the price is trading and is very committed to
We have strong support that the price has committed to bouncing
from and is expected to touch at the 39.50 level
We have a higher stability moving average of 100
Entry price is 39.50
The first goal is 42.53
The second goal is 45.15
Third goal 48.10
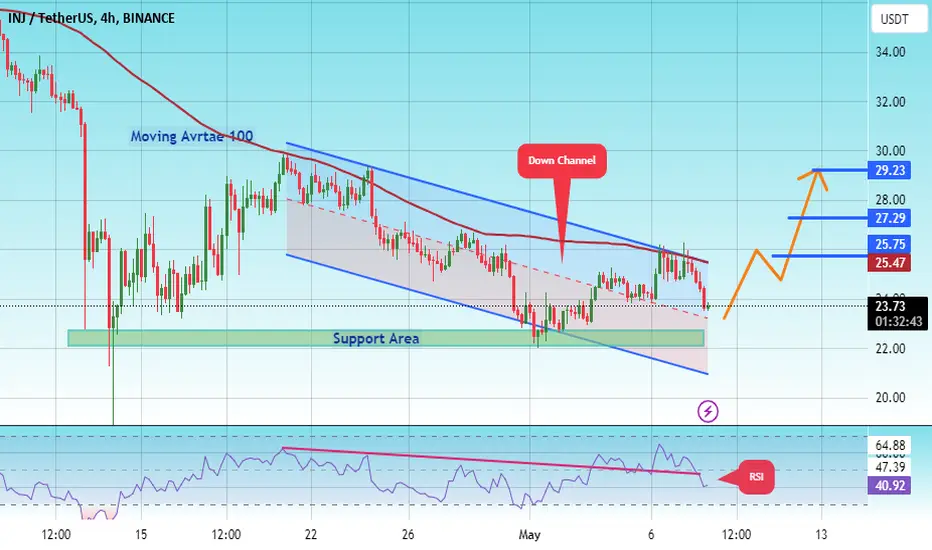
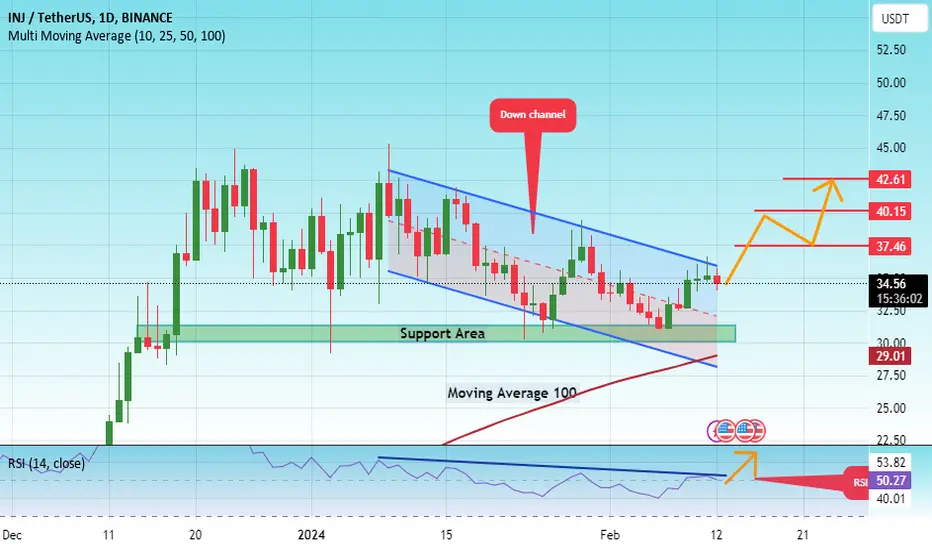
#INJ/USDT#INJ
The price is moving in a downward channel on a 1-day frame
We have higher stability above moving average of 100
We have a major support area at 31.00
We have a positive divergence on RSI
Entry area 34.59
First goal 37.46
The second goal is 40.15
Fourth goal 42.61
INJUSDT 1H TF Bullish (DOW Consecutive HHs and HLs)INJUSDT instrument shows continuation of DOW consecutive HHs and HLs. Price made a 1H Div and retraced to FIB 0.786% level. Trade plan consist of SL @ previous HL, Entry @ CMP and TP1 and TP2 @ 1:1 and 1:2. What do you think, will it work?

Support-turned-Resistance Structure with Bullish MACD DivergenceSupport-turned-Resistance Structure with Bullish MACD Divergence and Volume Profile Analysis
Summary:
This trade proposal focuses on identifying a support-turned-resistance structure around the 33.75 level in Injusdt. Previous resistance turned support, combined with a bullish MACD divergence, suggests a potential buying opportunity. Utilizing Volume Profile analysis, we aim to determine profit-taking levels near the upper boundary of the 70% volume area.
Technical Analysis:
Support-turned-Resistance Structure: The 33.75 level has previously acted as both resistance and support, demonstrating its significance in the price action of Injusdt. After being breached twice, it now serves as support, indicating a potential shift in market sentiment.
Bullish MACD Divergence: A bullish divergence has been observed in the MACD indicator, where the price forms lower lows while the MACD forms higher lows. This discrepancy suggests weakening bearish momentum and a potential reversal to the upside.
Interpretation:
The confluence of the support-turned-resistance structure at 33.75 and the bullish MACD divergence provides a compelling case for a bullish trade. By utilizing Volume Profile analysis, we aim to identify profit-taking levels near the upper boundary of the 70% volume area, where significant selling pressure may emerge.
Trade Plan:
Entry: Consider entering a long position once the price rebounds from the 33.75 support level, confirming its role as support. Alternatively, wait for a bullish candlestick pattern or a break above a key resistance level to confirm upward momentum.
Stop-Loss: Place a stop-loss order below the 33.75 support level to protect against potential downside risks. Adjust the stop-loss level based on the volatility of the asset and your risk tolerance.
Take-Profit Target: Utilize Volume Profile analysis to identify the upper boundary of the 70% volume area as a potential profit-taking level. This level may act as a significant resistance zone where selling pressure could increase, leading to a potential reversal or consolidation.
Risk Management:
Manage risk by sizing positions appropriately and adhering to proper risk-reward ratios. Monitor the trade closely and consider adjusting the stop-loss and take-profit levels as the trade progresses.
Disclaimer:
Trading carries inherent risks, and there is no guarantee of profits. Conduct thorough analysis and consider all factors before making trading decisions. Utilize stop-loss orders and risk management strategies to mitigate potential losses.

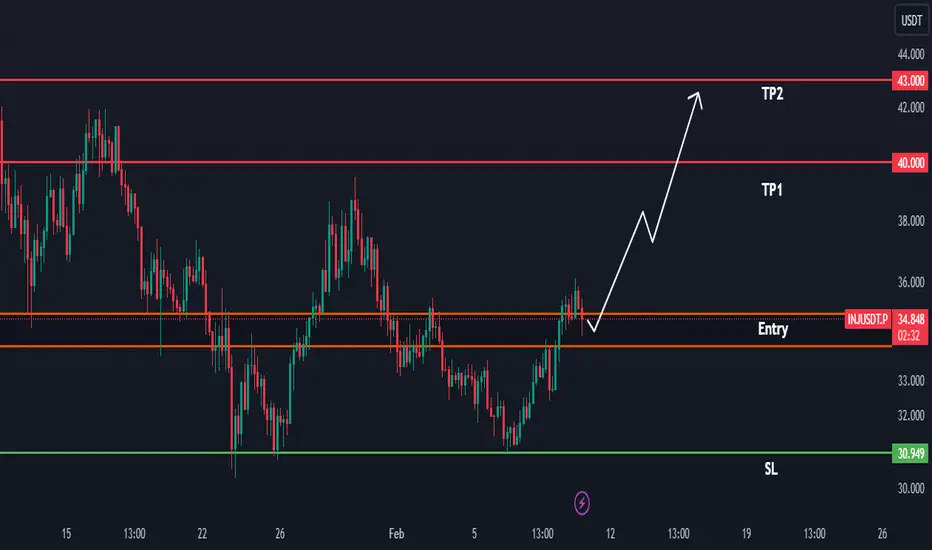
INJ/USDT Looking BullishTRADE ALERT!INJ
Ticker: INJ/USDT
Entry: 34$ - 35$
Take Profit: 40-43$
Stop Loss: 30.94$
Risk to reward: 1:2
Technical Thesis: INJ inside a symmetrical traingle about to breakout, if this happen we can open a long position. Keep an eye on it
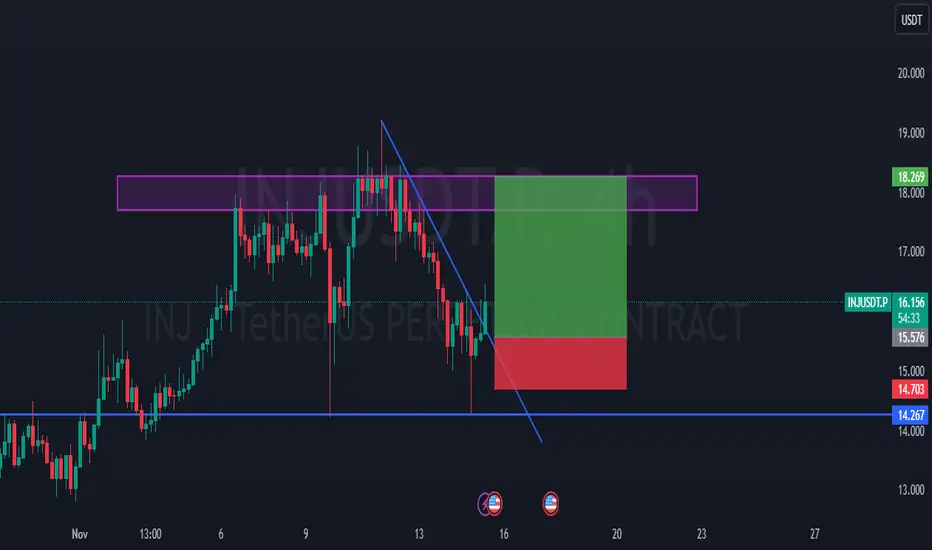
INJUSDTINJ / USDT ( Futures )
Long Between: 16.10$ TO 16.0$
Targets:
TP1 16.5$
TP2. 17.0$
TP3. 17.5$
TP4. 18.0$
SL: 14.7$
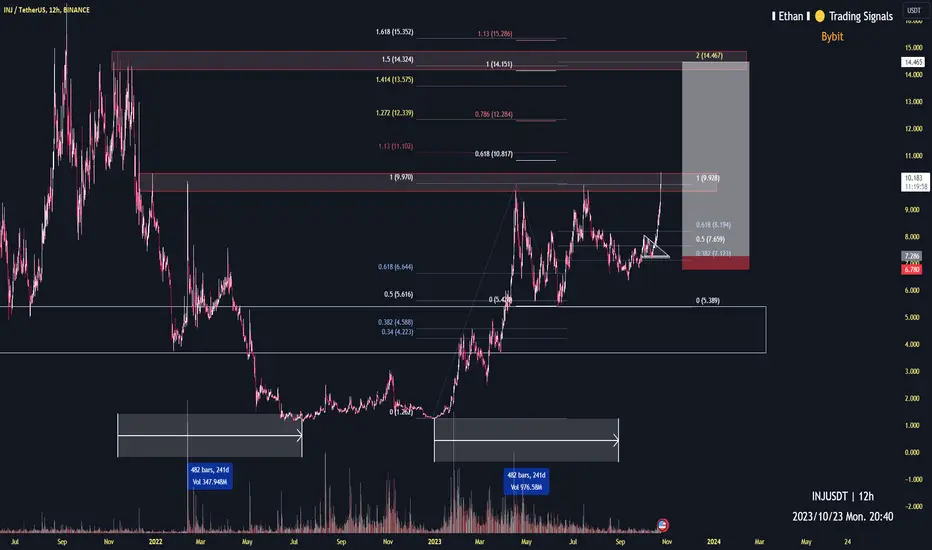
INJ totally on the way to predictive target 14.312h time frame
-
INJ is very strong since we share the signal at 7.5(ref.1), it has increased by 40%. Next, just wait it to reach our previous analysis, which target is 14.3. Also, considering the risk, we set protective SL at 9.5 to make sure the profit.
ref.1 Signals on Oct 5th
INJUSDT likely to head to daily resistance again around 7.93.The price has been rejected from daily resistance DR1 twice. Upon hitting the next support 4HS1, it has bounced. I think this support will provice the necessary bounce for a long trade and the price will aim for the daily resistance DR1 again. The price has already bounced so we should wait for it to pullback again to start building the position. The target of this long trade should be 7.93.
