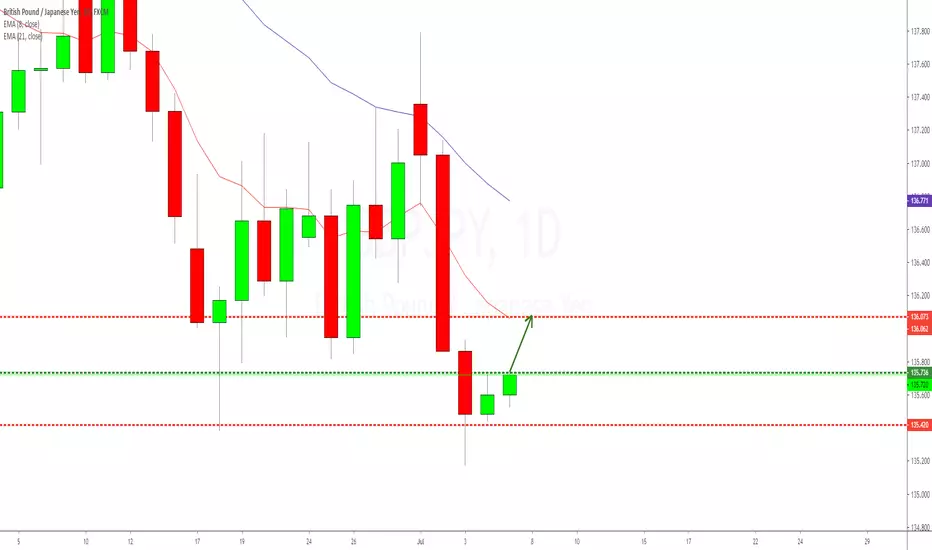
BITCOIN Breakout Imminent! Hello Traders,
Welcome to an update on BTC recent developments, Inside Bars Broke!
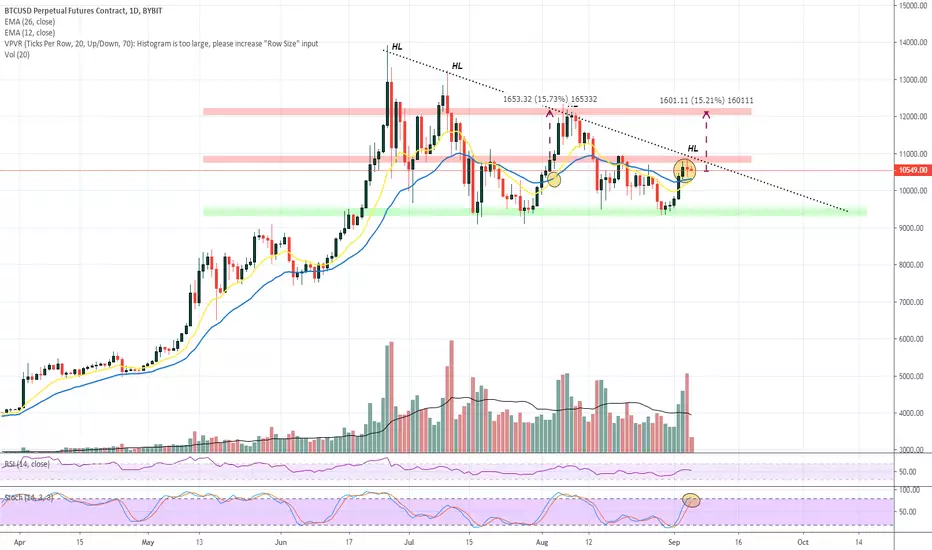
Points to consider,
- Testing support line, potential HL
- Price rejected from .618 Fibonacci zone
- Overall volume spike
- Bart pattern back into support line
- EMA’s acting as resistance to price
- Stochs in lower regions
- RSI is in neutral territory
- Bull impulses are getting smaller
Bitcoin has recently had a dump from a major technical zone, the .618 Fibonacci retracement and structural resistance being in confluence, was too strong for the bulls. Price retraced back to the trend line which is currently holding as valid support.
This trend line is a crucial support base for the bulls as we are coming closer into the formations apex, the HL and LH will have to cross in the near future. We can see a potential bearish divergence forming, but this will be more probable if the RSI retests its upper potential resistance zone (Orange Ellipse).
The Stochastics is in lower regions, telling us that upwards momentum is probable, this will be valid as it will allows the RSI to retest upper resistance, further putting emphasis on the bearish divergence.
The VPVR shows low volume of transactions after local support level, Bears are able to pick up momentum if price was to break support. We must also consider that the EMA’s are currently giving price resistance, an upper edge to the bears…
A Break from the support line will send BTC to test local support levels, (green zones), posting gains of a potential 12.6%. A break bullish can really change the structure of BTC, taking out the previous Lower Highs; will allow posting gains of 16.5%, remember to use stop losses when trading breakouts!
Overall a break either way can tell us which direction BTC is headed on the Macro timeframe, we will either test yearly lows or head up and above all-time highs with in the next couple months…
What are your thoughts? Will BTC break trend line and test lower support levels, or will BTC break through resistance and put in a higher high…
Please leave a like and comment,
And remember
Limit your size in any position so that fear does not become the prevailing instinct guiding your judgment - Joe Vidich
Inside Bar

BTCUSD INSIDE BARS!Hello Traders!
Another quick update on BTC
Points to consider
- Price bounced from support
- Daily inside bars forming
- Bulls broke EMA’s
- Potential HL if price retraces from here
- Volume climax candle on daily
Bitcoin bulls have pushed price up successfully from local support right into local resistance. Price is currently forming INSIDE bars which are yet to break bearish and or bullish. A break bullish from this area can totally negate this descending triangle formation and will allow bitcoin to put in a higher high…
A break bearish will confirm this next Higher Low and further prove the hypothesis of this being a descending triangle, a very bearish formation.
Bitcoin has two major resistance levels (red zones) that bulls need to break if we are headed to yearly highs, this has to be backed up by high bull volume otherwise we may witness a bull trap and ultimately head back to yearly lows…
What are your thoughts on Bitcoins immediate price action?
Please leave a like and comment
And remember,
Markets change their behavior faster than people can change their minds… That is why intraday trading is so difficult.’’ – Unknown
HK33HKD inside day, only want to take the breakdown short.I don't have much to add on this one, I would only like to take the breakdown short today.
The HK market already closed, so if it could close as a daily shooter, it would be an even better trade!
Let's see how it goes!

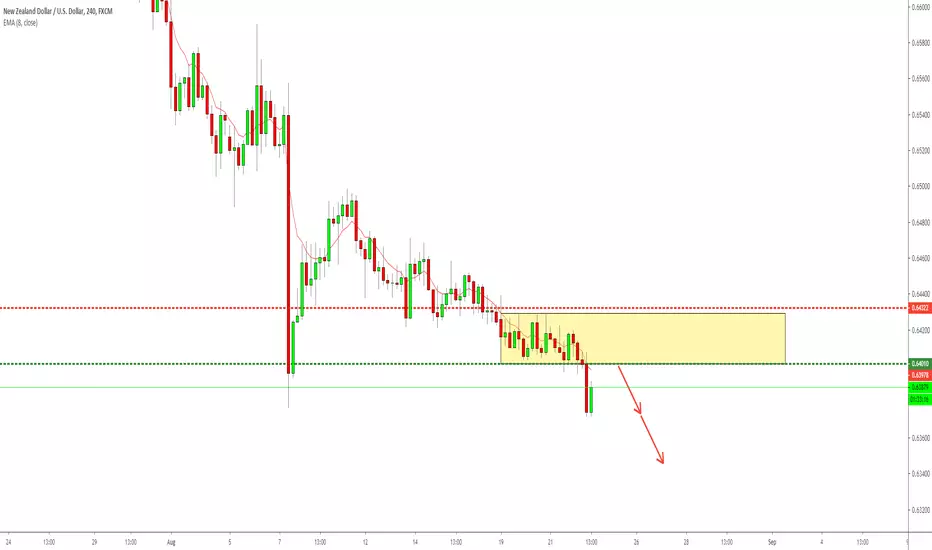
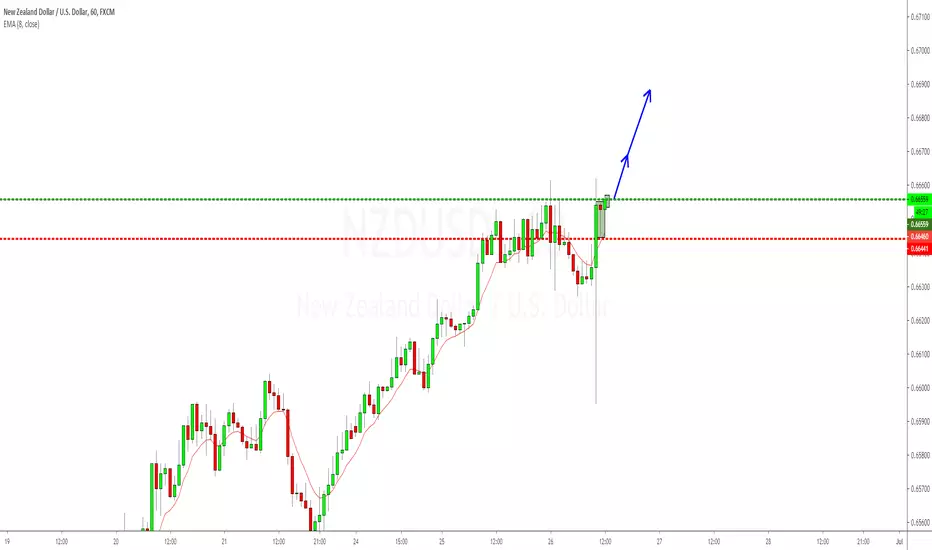
NZDUSD 4hr pullback short after inside week breakdownNZDUSD is basically the weakest pair this week with an inside week breakdown.
Here we got some pullback in London market, which might a good opportunity as the bearish mindset remain intact.
So I'll be quite interesting in this short yo!
Let's see how it goes!
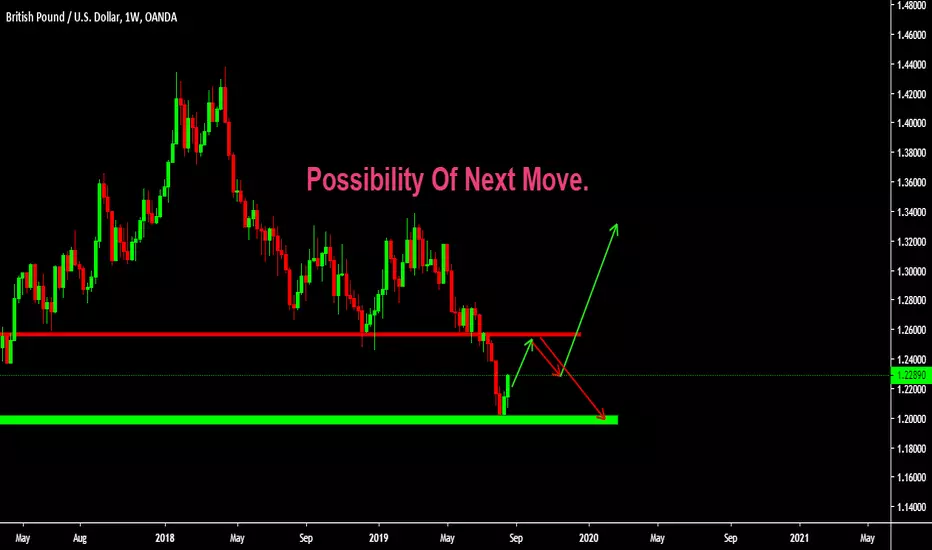
GBPUSD Weekly Possible Move.GBPUSD has taken Support on October 2016 Plus in Weekly time frame, we have Found Inside bar pattern which has Breaken upside of Mother Candle.
Note: This is only for Educational Purpose this is not Investment advice.
Please support the setup with your likes, comments and by following on Trading View.
Thanks
Adil Khan.
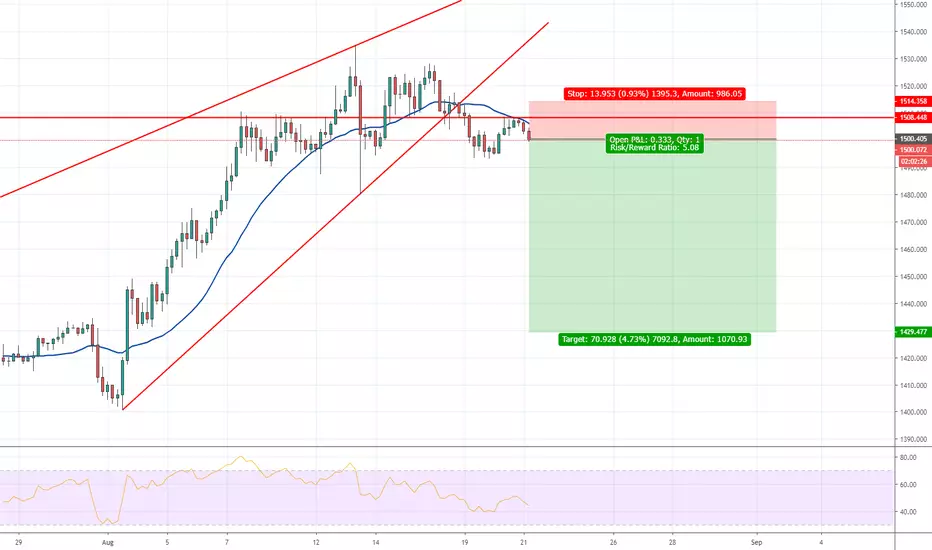
Gold breaking downRising wedge pattern breakout
Support (also fibo level) tested as resistance
Inside bar sell signal
Selling at market price with
# SL @ 1514.358 and
# TP @ 1429.477
Don't invest what you can't afford to lose. This is not investment advice. Subjective view/report of a financial product only.
You can learn price action trading at no cost. Join my mailing list to receive more information zc.vg
Join me in Forex Bootcamp for live updates using the link below.
DISCLAIMER
All information published within this website is purely for educational purposes and offers no guarantees. Profit Fx, Forex Bootcamp and any of its associates cannot be held responsible for any trades that you have executed in any way whatsoever. Please familiarize yourself with the relevant risks involved when trading forex, CFD’s and other products. Any trading is done solely at your own risk. Profit Fx, Forex Bootcamp and any of its associates are in no way employed by any broker or any other legal entity. All information published within this website does not constitute advice, but rather objective information about a financial product and analysis or report of a financial product.


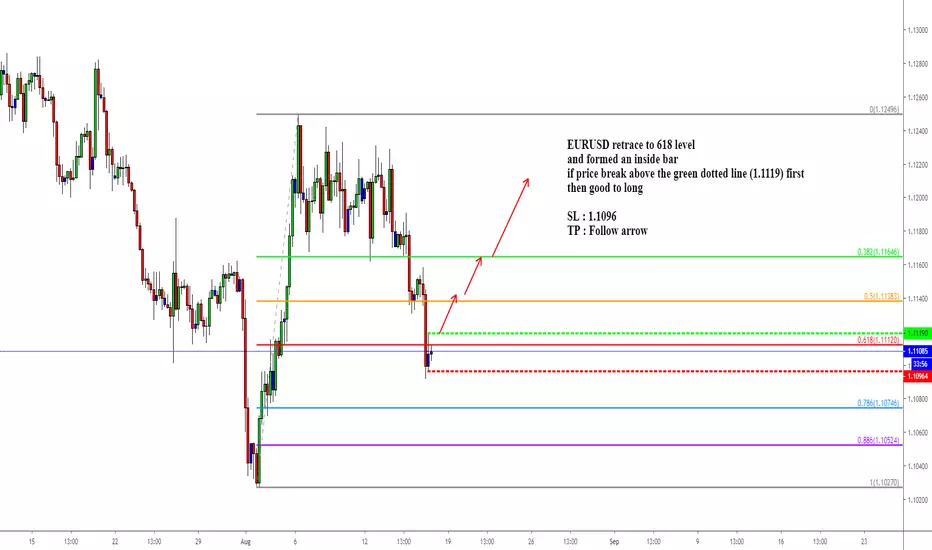
EURUSD retrace to 618 levelEURUSD retrace to 618 level
and formed an inside bar
if price break above the green dotted line (1.1119) first
then good to long
SL : 1.1096
TP : Follow arrow
GBPUSD inside day after new low, why not!A textbook-like inside bar trade and I like it so much!
GBPUSD is only a few pips away from its previous low in 2016, and there aren't many reasons to be optimistic.
Therefore, to take on the slumping train is still my main idea!
Here we got this inside day set-up to short if it's able to break to the downside today!
Let's see how it goes yo!

SPY inside bar trade Today’s candle formed an inside bar stick. Buy above the top line, sell below the bottom line.

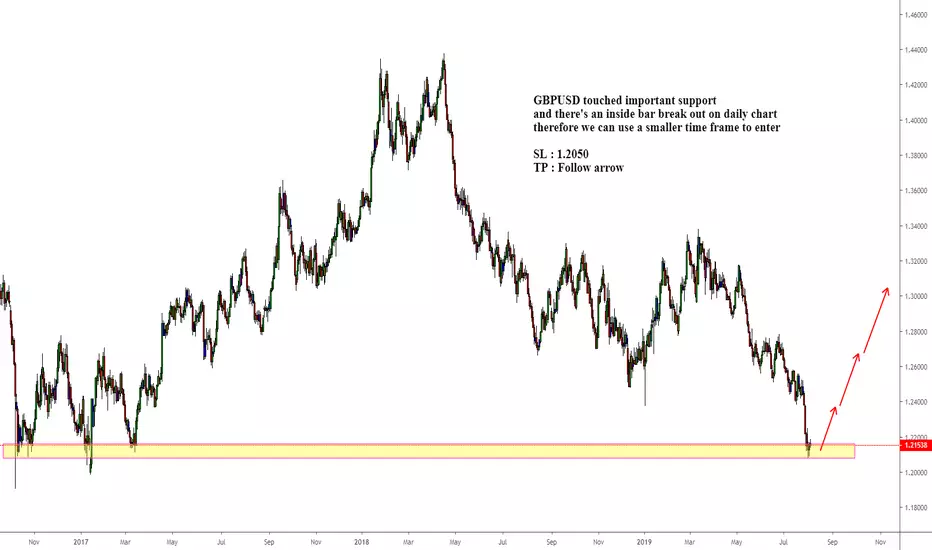
GBPUSD touched important supportGBPUSD touched important support
and there's an inside bar break out on daily chart
therefore we can use a smaller time frame to enter
SL : 1.2050
TP : Follow arrow
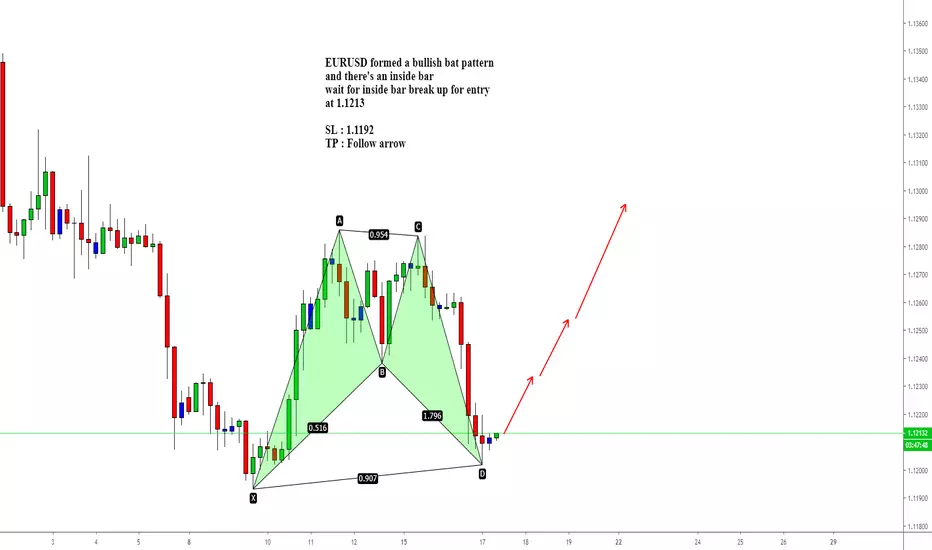
EURUSD formed a bullish bat pattern EURUSD formed a bullish bat pattern
and there's an inside bar
wait for inside bar break up for entry
at 1.1213
SL : 1.1192
TP : Follow arrow
GBPJPY inside day breakout with 8ema correction.Most of the pairs got inside days yesterday as the market didn't do much in 7/4.
Among them I'll be focusing on this GBPJPY as it got enough rooms for correction,
and also, there will be NFP number today so trading GBPJPY may be a better option before NFP releases.
It's rare to see a 30 pips inside day for the king of fluctuation, so it would be an attractive trade for me!
Let's see how it goes yo!
SPX500 inside day after all time high!!This is a trade that I always like a lot.
Of course I'm aware of the rising gold price and the coming earning season,
while the logic is: if it's still able to break the inside day to the upside despite all the risk events,
then it's still a very good long!
Let's see how it goes!!

NZDUSD inside hour after new high!NZDUSD had a interest rate announcement a few hours ago, and here we got this inside hr breakout after that.
It's also an inside hr after new high trade, pretty much a great combo!
Like this long a lot yo,
Let's see how it goes!
BTCUSD inside 4hr after 21ema correction long !It seems that I've posted several with-trend inside bar trades in a row lol,
and luckily enough, all of which were great trades!
6/26 NZDUSD
6/24 XAUUSD
6/14 BYND
All of these trade had one thing in common: Looks SCARY for those non-momentum traders
While, as long as it's uptrend and gave a proper set-up, my answer is simple as always:
Why not!
Only want to take the breakout long yo!
If it breaks to the downside before triggers the entry this trade will be cancelled.
Let's see how it goes!

XAUUSD inside 4hr long opportunity, it's never too high to long?There is still a week left in this crazy inside month breakout June!
Actually I'm quite aware of the weekly butterfly, but I need at least a daily reversal sign to confirm the bearish mindset.
That is, before the daily reversal sign, I'll be still willing to remain bullish and look for set-up to long.
Here we got this inside 4hr after ema correction, a good long in 4hr chart if it's able to break to the upside yo!
Let's see how it goes!

USDCHF inside week breakout and this pull back longUSDCHF is a very complicated pair with inside month breakdown but inside week breakout;
what's more, in terms of supply zone, this inside week breakout just hit the previous weekly supply zone.
so there are mixed perspective among traders recently!
In my view, I would like to respect the inside week breakout a little bit more as it's able to test the 1.0000 fig,
so I 'll be willing to take this pullback long @ 0.9980.
Let's see how it goes!

EURUSD: Break Below 618, Approaching Inside Bar Demand ZoneEURUSD fell as the 618 level failed to hold the price after ECB Draghi signals for more rate cut.
The price is approaching the demand zone created with an inside bar breakout that sent the price soaring and break above a 3-month falling channel.
What's more important now is how will the Fed react during FOMC as the Fed has already signalled for a probable rate cut earlier.
Look for buy opportunity as the price approaches 1.1160.

BYND inside day after 8ema correction? Of course!!I posted an idea about pure momentum fig breakout trade a few days ago in Chinese version of TradingView.
It was an crazy 150.00 fig breakout to go straight to 186.00 in one day!
And here we got an inside day, which will make me very exciting about!
willing to try again if it's able to break to the upside yo!
Let's see how it goes!

ATVI daily shooter long opportunity!ATVI daily shooter, I would love to take the breakout long yo!
Let's see how it goes!
