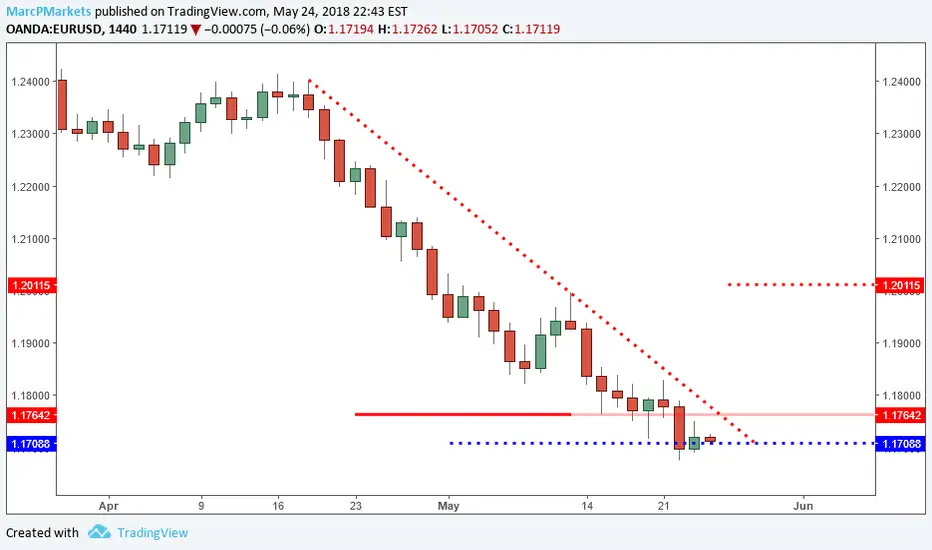
EURUSD: Reversal Signs On Major Support. 1.1800's Within Reason.EURUSD update: The swing trade long from 1.1745 is now in play. In this report I am going to explain the reasoning behind this long, and what adjustments to consider in the face of conflicting price action if it nears the bearish trend line. This trade was called on S.C. around 10:30 AM EST today.
The price action over recent weeks has been clearly bearish. For whatever fundamental reason that you want to point to, the US dollar has been surging. Often during times of prolonged momentum, it is very easy to lose sight of broader structure.
When you zoom out and look at the overall structure of this pair, you will notice that the 1.1708 area is the .382 of the entire bullish move since the December 2016 lows. This is important information because it means this level is a major support. One that offers a greater probability that price retraces higher, at least temporarily.
On this time frame, temporarily means a retest of the bearish trend line near the high 1.1700s or even a push toward the 1.2011 resistance which is the .382 level relative to the recent bearish structure.
Since momentum is still generally bearish, it makes more sense to place a target at a much more conservative level and that is why I chose 1.1823 instead of the high 1.1800s or even higher.
Keep in mind what makes this trade worth the risk is the potential. 1.2011 is around 300 pips from current prices. Capturing just 25% of that is very reasonable.
There are other factors that are in play that justified this trade signal. There is a minor failed low formation defined by 1.1690 and an inside bar on the 12 hour chart. The trigger was when the 12 hour high was taken out. There is also an inside bar on this time frame as well which will trigger at 1.1751 for those still interested.
Since momentum still favors the bearish side, price conflict may appear earlier than the target. The area to consider: the 1.1790s. If a bearish pin bar appears off of the 1.1790s, that would be a good time to exit for an earlier profit.
The 1.1683 stop is based on the 1.1690 low with a little extra room to help reduce the possibility of a fake out. At the moment, price is hesitating just above the 1.1700 area which is not the best sign. Keep in mind, if this market cannot get it together and mount a retrace over the next 12 to 15 hours, I will more than likely exit the position, even for a smaller loss. I do not want to be long for the upcoming holiday and these type of reversals should move favorably quickly, if it does not, it is a red flag.
Taking trades with higher probability and potential are one thing, but the key to remember is winners must be larger than losers. There are times when adjustments may call for taking less profit than the amount risked, and that is fine.
We can't control profits, but we can control risk. If you keep risk relatively small, and mitigate further when the market offers the chance by adjusting to new information and signals, that is how to average 2:1 or better reward/risk over time. It is possible to have a string of losses, but if you are following these best practices, your winners should be making up for them and then some.
Questions and comments welcome.
Inside Bar
Very bullish price action signals are formingWhile I am personally trading the SPY due to it's great stock and options liquidity there have been a number of great bullish signals being through in multiple index and futures markets. Today I focus on the NASDAQ 100 futures and point out a nice inside bar/2 bar reversal pattern that as already broken out to the upside as well as an inside bar/ false break pattern that is currently forming in the daily. I will be watching where the markets are going into the close but a pin bar does end up forming on the /YM futures I believe that could set us up for our next bullish move. As always with price action, price must break out of the pattern before it is confirmed. In the case of the inside bar/ false break pattern, if we do end the day with that pattern then a breakout of the inside bar pattern would still need to occur for this new signal to be trad-able. Those who jump in early to make a few extra bucks are doing so at the risk of a far less probably trade. When the patterns do break out the probably of success goes way up.
Please watch my video analysis here
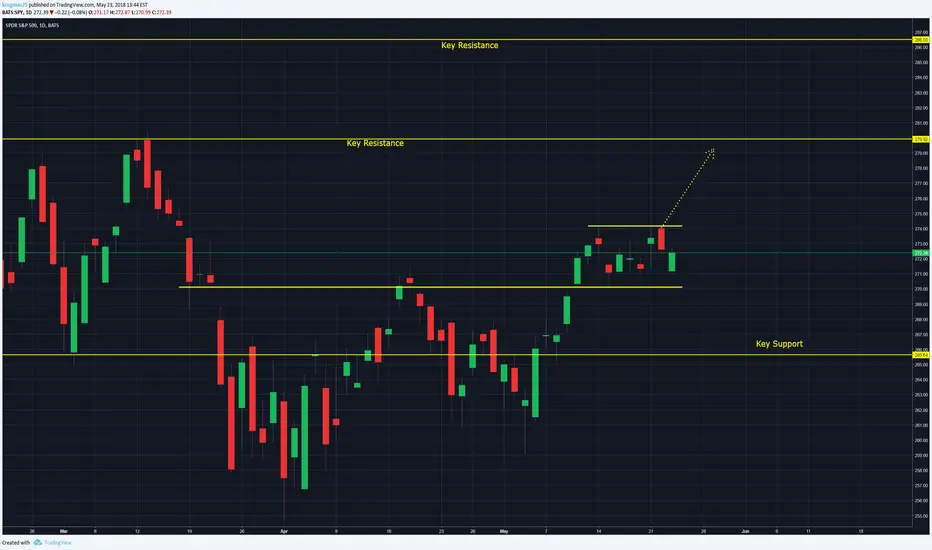


ES - Bullish bias still intact, waiting for upside breakoutLast week we saw an inside bar pattern form on the ES. There was a false break out of this inside pattern. Price pulled back in and continued to consolidate. Going into the Monday morning trading session it looks like we will have a gap up and may finally see that upside breakout to start the next leg up.

#NOC Inside barNOC inside bar...almost sure short trade tomorrow...
324/320 Levels
SL 330 ( just 2 points above....but 8 points opportunity)
Let it go below the last green candle and sell....

EURUSD - Analysis for the week ahead and potential tradesIn this video I show some good past setups on the EURUSD that would have been profitable as well as take a look at where the markets may be going over the next week or more. I focus primarily on the inside bar pattern and some potential ways to trade these setups.
Since early this year there have been a number of high quality price action setups including inside bars, engulfing bars, and pin bars. The majority were quality, trade-able setups that would have offered risk:rewards of 1:2 or better. Price is currently stuck in a strong bearish trend so we will be looking for small pullbacks into key resistance areas to get short with the trend. There is also a larger head-and-shoulder pattern that is currently forming. Prudent traders will want to watch closely to see if that pattern continues to form as well.

ES - Bullish price action in the hourly'sPrice continues to consolidate on the daily chart so I take a look at any price action in the hourly charts. I see a potentially bullish hammer setup on the hourly chart off of a key price level. If the candle closes as a hammer and breaks above we may see that next strong bullish move up.

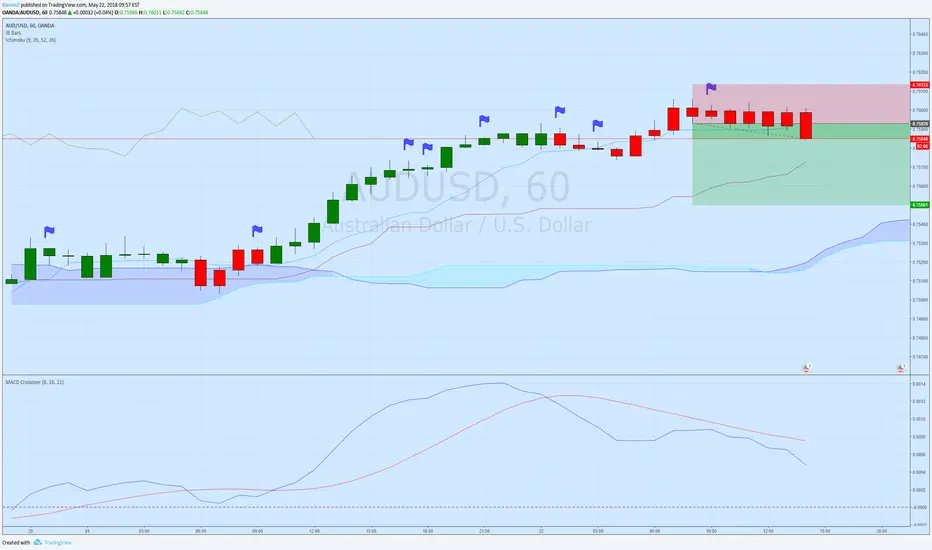
AUDUSD - Short term bearish signal confirmedWhile I have been and am still bullish on the weekly candle, there has been a fairly bearish signal in the 4 hours that has formed and also been confirmed. I was originally in the position from earlier this week and planned on holding until either the weekly pin bar broke to the upside or there was a significant enough bearish signal to cause me to close my position. I was still able to close for a profit since I had gotten at a lower price. Such a signal happened overnight. The setup was an inside bar/ pin bar fake-out. That is where you have an inside bar pattern followed by a breakout to the upside which quickly pulls back in and formed a pin bar. This is generally strong signals due to the fact that many market participants will get long on the breakout and when price pulls back in you have a squeeze setting up. In this particular case there were multiple inside bars which give the pattern even more strength.
If you are bullish and still want to get long there are a few options, you may simply want to wait until the price breaks above the weekly pin bar for the safest trade, but also the smaller risk-reward. If you are feeling more aggressive you could enter once price touches the important trend line at around 0.7475, or simply sit this one out.

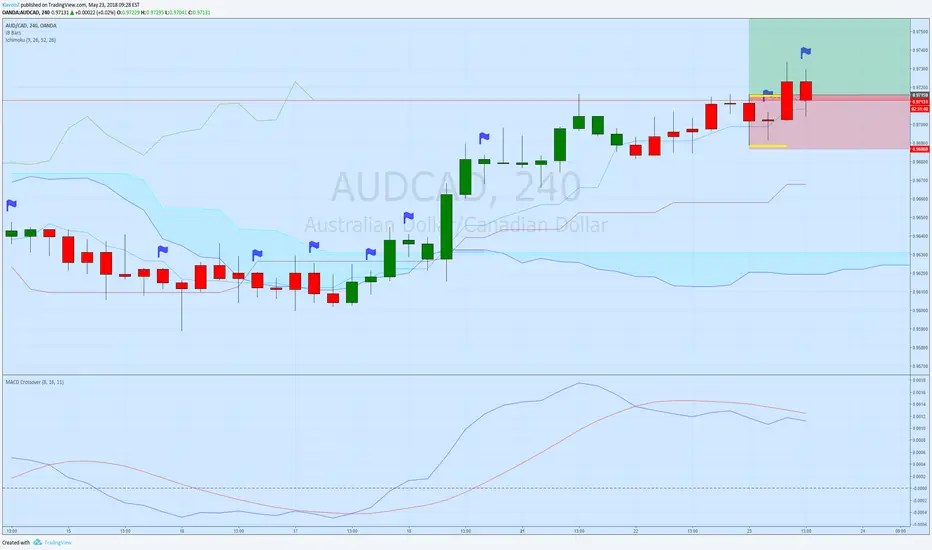
EUR/USD [16.05.18] SHORTCurrency pair EURUSD
1D screemshot
Time Frame: 4H
What i see is downtrend, correction worked out, it goes further down.
Factors: Inside bar + major resistance level 1.18722
Stop Loss 1.18776
Target 1.17572
Entry 1.18377

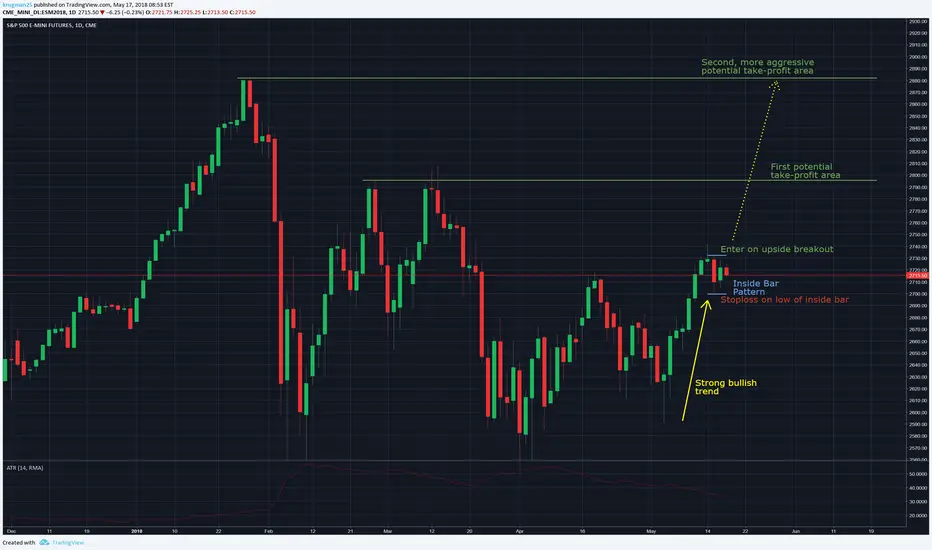
ES - Inside bar pattern breakout trade!An inside bar has formed on a number of charts including the /ES, /YM, XLF -0.42% and others. These are all following a strong trend which signals that the market is taking a short breather. Generally in periods of price consolidation after a long move we want to look for opportunities to get in the market on the next up move. In these cases we would be looking to enter the trade on an upside break of the inside bar pattern (2731). A stop loss can be placed at 2700 for an attractive risk/reward setup.
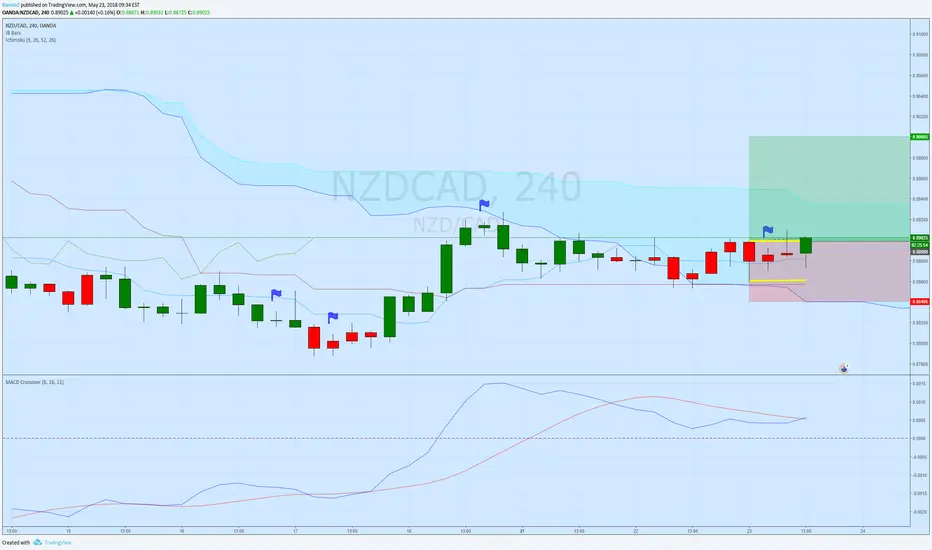
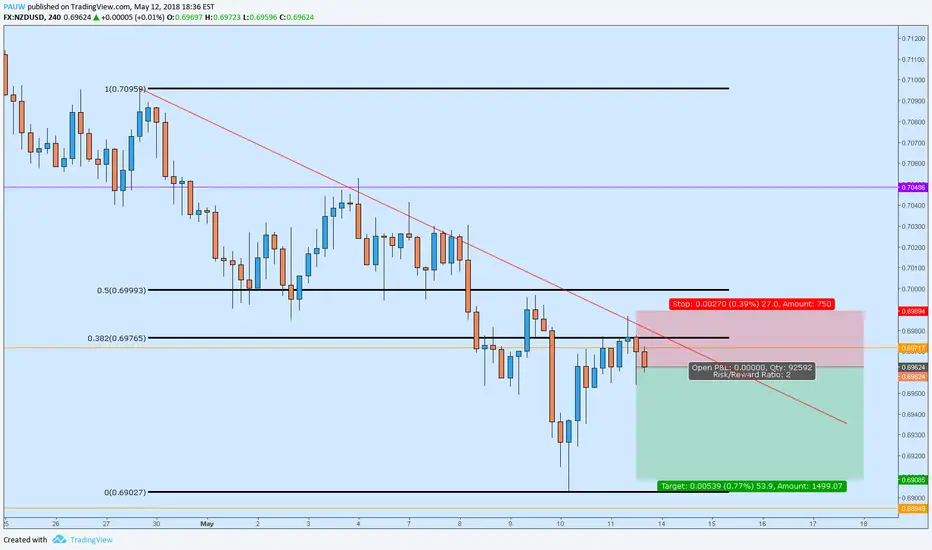
NZD/USD [13.05.18] SHORTCurrency pair NZDUSD
Daily screenshot
Daily downtrend with narrow channel. Last candle is pinbar
4H
Inside details we can see actual attitude price to trend, it follows.
Protection: Fibonacci level 0.382 ; resistance level 0.69717 ; inside bar in 4H TF, pinbar in 1D TF ; trend itself
Stop Loss 0.69894
Target 0.69085
Entry 0.69624
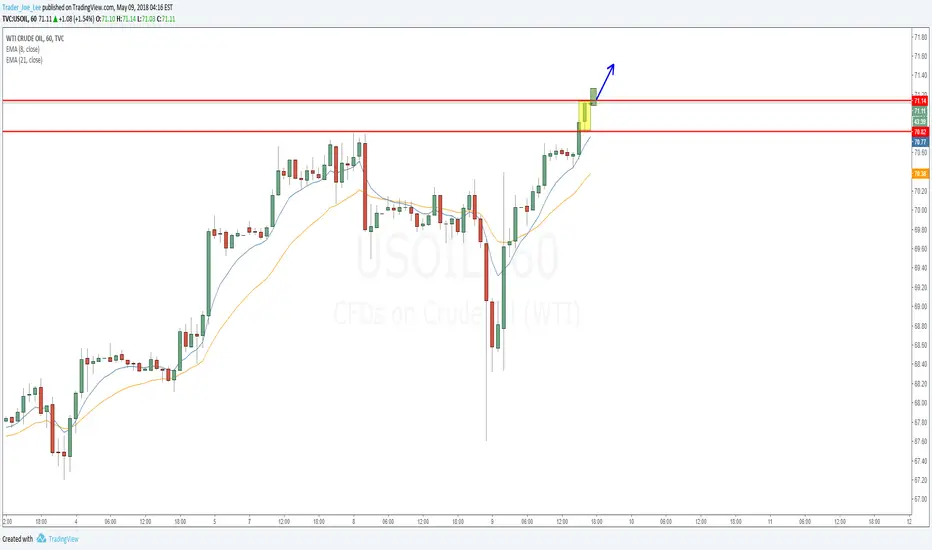
USOIL inside hr after new high, shall we?In terms of inside bar trade, the answer is a clearly YES if it's able to break to the upside!
Of course, it's simply a trade to chase the high, like all the other "long the inside bar after new high" trades~
It's quite interesting to see how the market reacts with this kind of trades.
DON'T try this kind of trade without proper knowledge about trade execution skills like 1st kick, risk-reward stop, and trailing.
If it breaks to the downside first, this trade doesn't exist anymore.
Let's see how it goes!
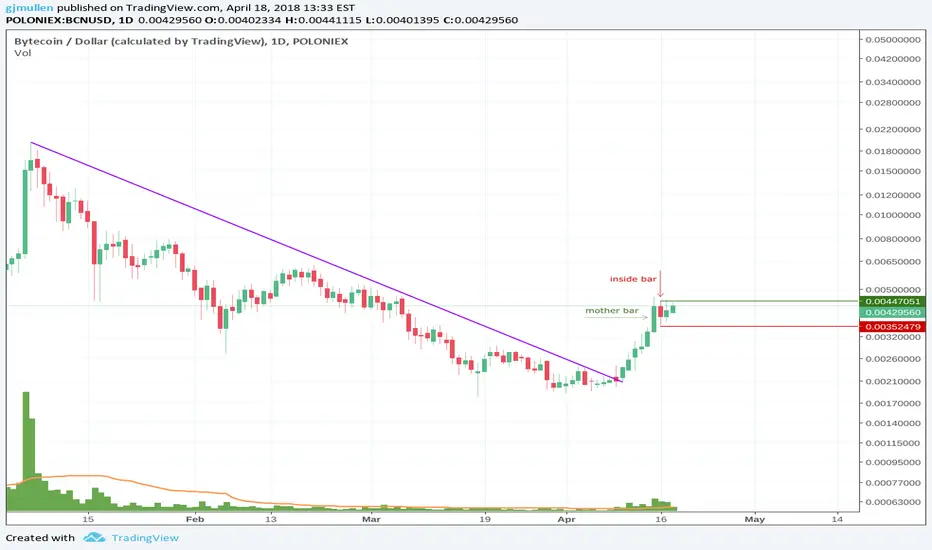
BCN INSIDE BAR TRADEbytecoin.
took a long position here.
not even sure what this coin does. any info appreciated.
was looking for byteball, but not on my exchanges.
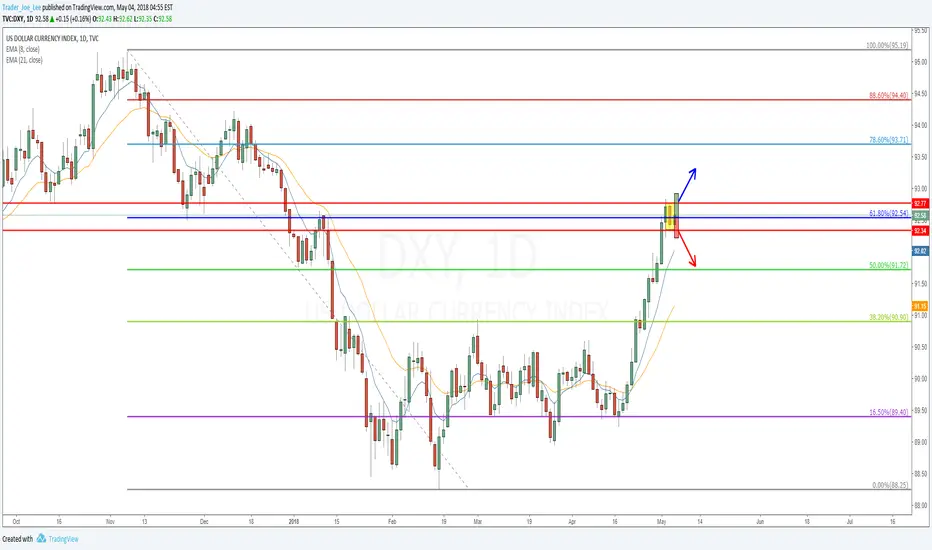
DXY inside day before NFP.DXY had an inside day before NFP, which is normal as the markets are waiting and consolidating.
An inside day breakout with the NFP momentum combination is quite a worth noticing spot for today's trading.
Back to the inside bar itself, it is actually a more bearish one as it's at 0.618 retracement and it kinda extended in terms of 8ema,
but we can regard the power of NFP more, just like the earnings of stocks, it can be taken as a whole new start of a session,
which means if it breaks to the upside, it also worth the long as it's so important!
Let's see how it goes!
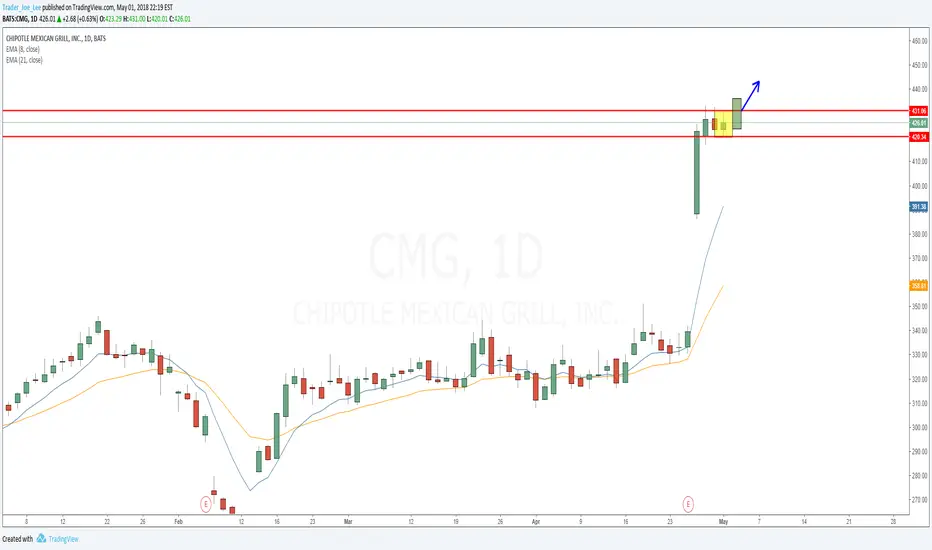
CMG Daily shooter after earningsInside bar after earnings is one of the inside bar trades that can break the 8ema rule as the earning day may be taken as a whole new start,
which implies strong potential momentum.
CMG had a 25% rally after the earning report to come back to the stage,
and it gave a daily shooter here, I like the long much more than the short though.
Of course, if it breaks to the downside, the room of correction also looks juicy to trade the gap filling,
but I'd rather skip the trade with regards to how it soars to the sky.
That is, if it breaks to the downside first, this trade doesn't exist anymore!
Let's see how it goes!
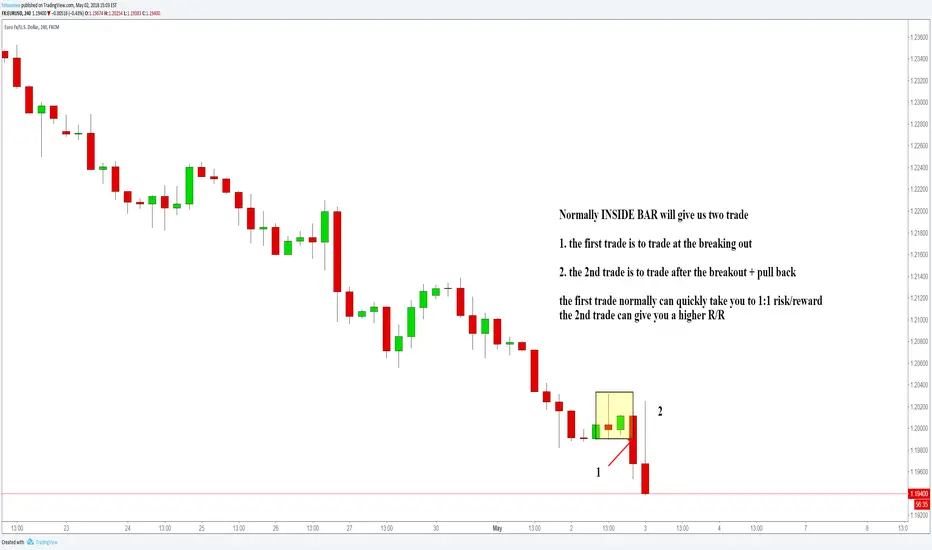
ADVANCED SKILLS OF INSIDE BARNormally INSIDE BAR will give us two trade
1. the first trade is to trade at the breaking out
2. the 2nd trade is to trade after the breakout + pull back
the first trade normally can quickly take you to 1:1 risk/reward
the 2nd trade can give you a higher R/R
if you don't know what is inside bar, you can google it and also check my video tutorial
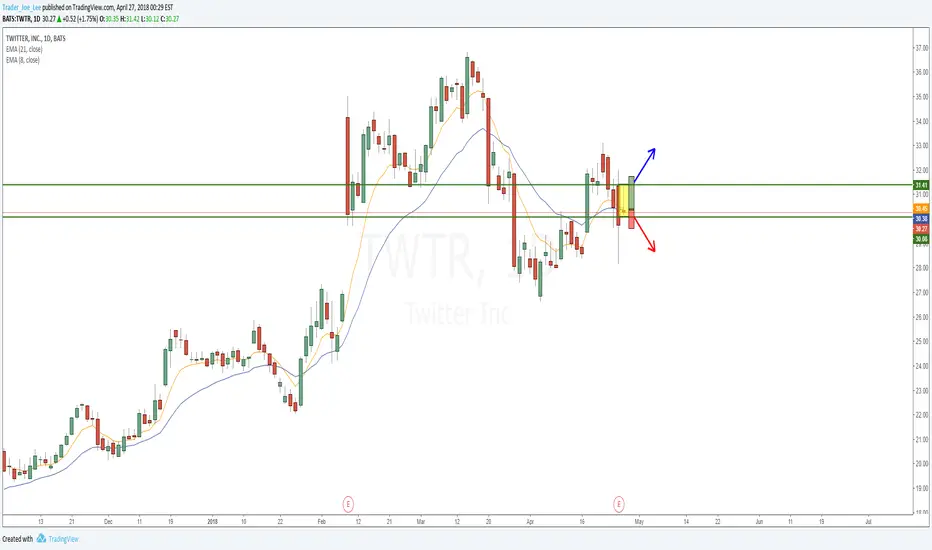
TWTR Inside day after earningsTWTR has an inside day after earnings.
It can be a solid trade itself , and it's also fine to look for the confirmation for both side.
If it breaks to the upside, it can be the confirmation entry for the recent bullish 2618 ;
if it breaks to the downside, it will be the tiny time frame's continuation.
so it's a inside day that worth trading no matter which direction it breaks.
Let's see how it goes!
SPX500 4HR 0.618 and demand zone combinationRecently the SPX500 is just a great trading vehicle by harmonic patterns, supply & demand, and inside bars.
It started with a huge daily XYAB, bounced of 2 entries of it , forming tiny XYAB and 2618, and numerous inside bars trading opportunities..
Yesterday it dropped from the 2660 supply zone
Here we got another chance to trade take the long with a 0.618 and demand zone combination,
so I'll be waiting for proper reversal sign near 2615 to long!
Let's see how it goes!
