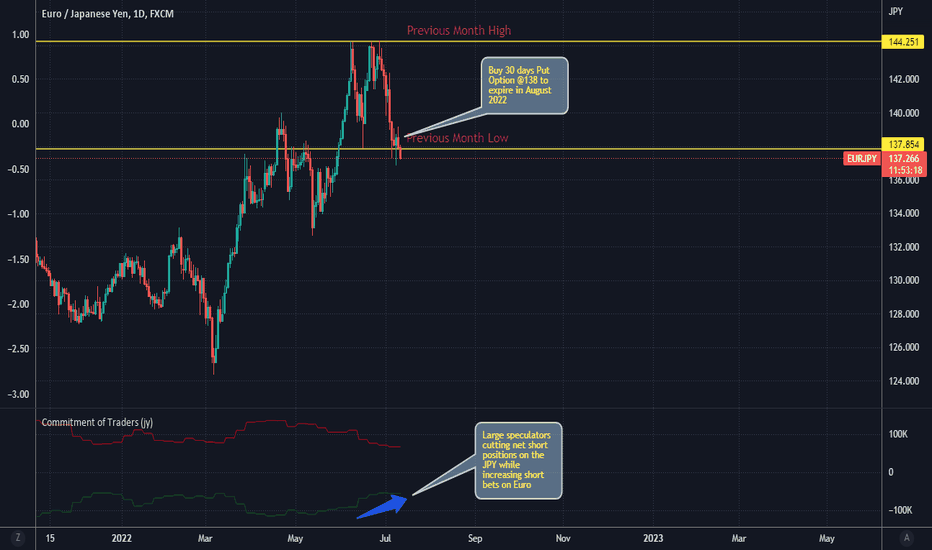
A GOOD TIME TO BUY PUT OPTIONS ON EURJPY!We forecast a gradual demand for the JPY on the premise of global economic uncertainties. This idea is supported by almost 50% decline in net short positions of large speculators on the JPY since May 2022 from negative 110k to 54k. However, speculative positions on the Euro recently flipped to the negative to dampen the optimism of a recovery on the Euro. BoJ has alluded to signs of recovery in Japan's economy. Worthy of note was BOJ Gov Kuroda's statement: "Must be vigilant to impact of financial, currency market moves and their impact on Japan's economy, prices".
The technical trigger of price below the previous month's low inspired our interest in buying 30 days PUT options @138.00
Institutional_trading
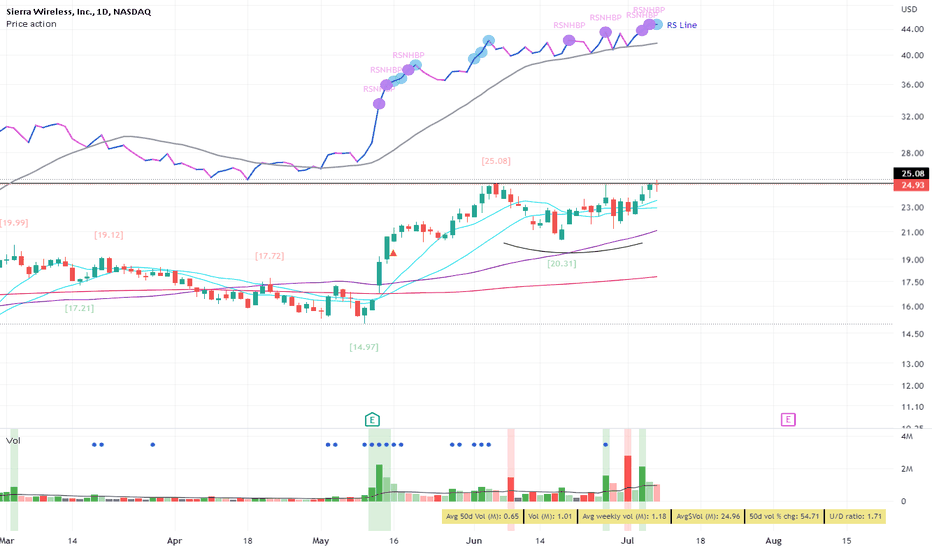
$SWIR potential break out of a cup base$SWIR looks good for an entry over $25.18 if price breaks out from this cup base and has demonstrated good relative strength. IBD has an A- acc/dist rating for this one, so definitely worth keeping an eye on for a bigger move up
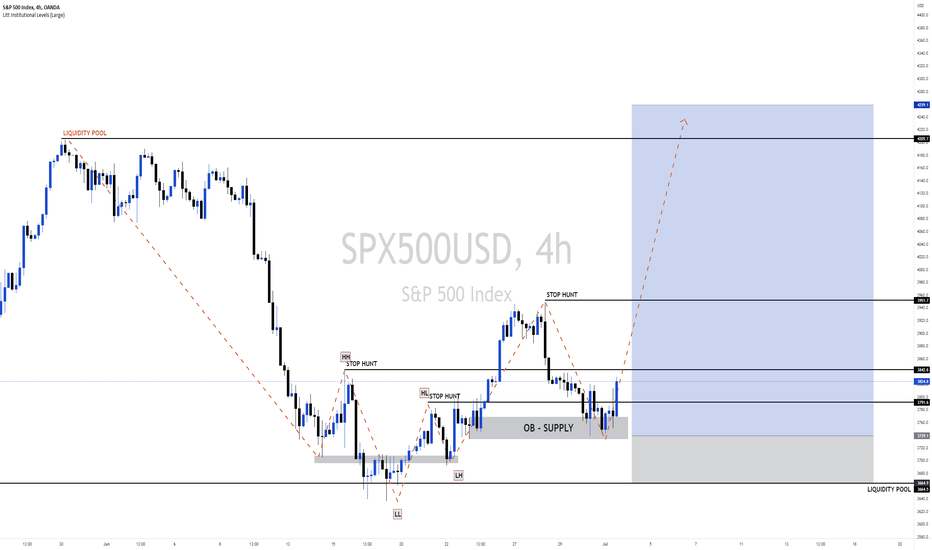
S&PUS500 BULLISH SENARIOS&PUS500 mother of all stock indices
Despite the monthly bearish down drop analysis us500 shows a critical bullish move on its intraday market motive as a short-term bullish move after liquidity pool taken out on weekly time frame and rebound of price on a daily’s trend after sells liquidity stops
Note: when price closes below YL we have to expect a down move of price to sell side liquidity area.
Potential long set up on $SWIRSWIR had a massive run recently and has had a healthy 20% correction to the 50 fib with an U/D ratio of just under 2, which is a good indication that institutions are accumulating this stock. Price is currently under the 78.6 fib and volume is drying up whilst price holds relatively steady; a trade targeting $25 and a stop at yesterday's low (also the open and near the 50 fib) gives 11% profits and a nice R/R
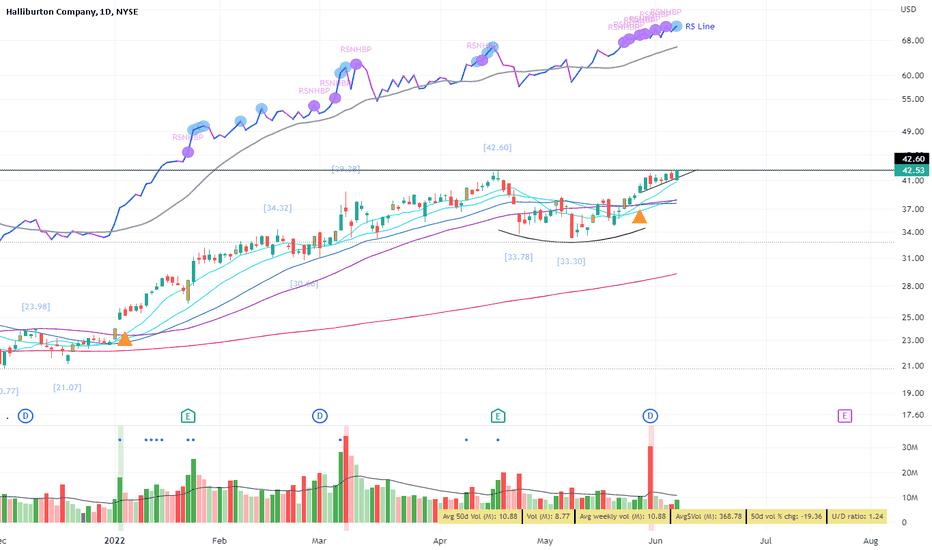
HAL about to break out from a stage 2 baseHAL is showing incredible strength, with a cluster of RS before new highs and even after a day of significant selling, price still held the short term uptrend that also forms the handle in this cup and handle pattern. Over $42.60 and this stock sees new ATHs with just over a month to go before earnings; HAL has done well on the last 4 earnings and in this current market this looks likely to happen again. Volume has been contracting during this accumulation phase, but this stock looks ready for a strong next leg up
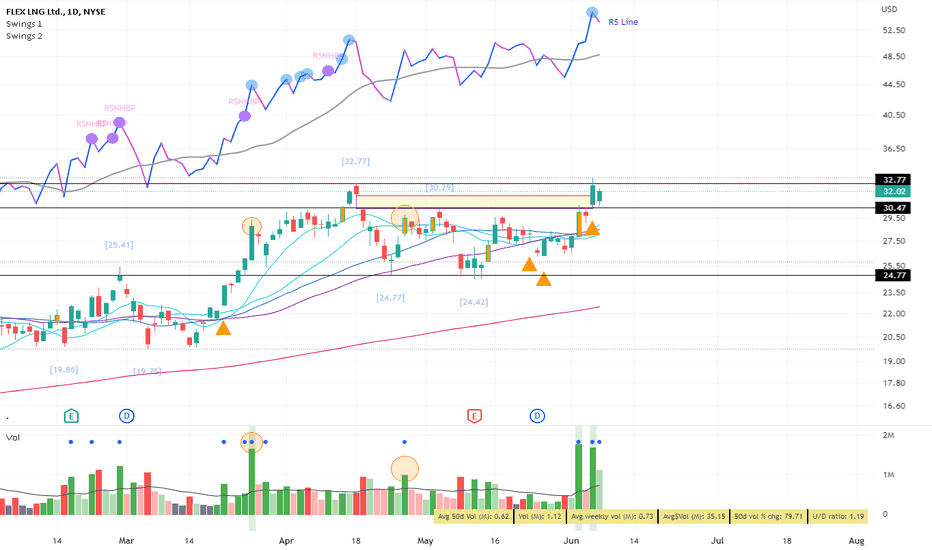
FLEX potential breakout from a stage 2 baseFLEX has shown good relative strength recently and looks like it's been under accumulation since April (see the yellow dots). Price filled the gap 2 days ago on good volume and yesterday saw a bullish looking inside day with a pocket pivot. If price can hold over $30.47 we could see a decent move to new ATHs
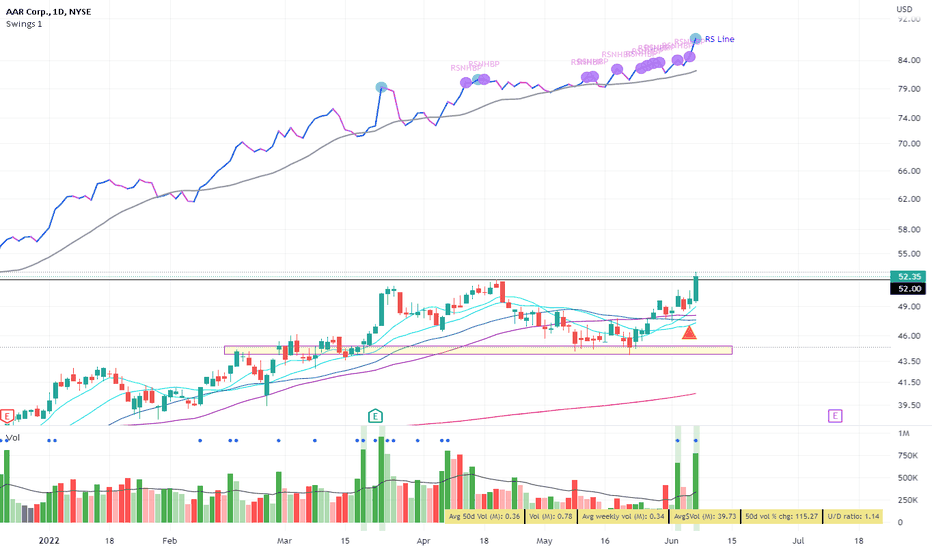
AIR breaking out with volume.AIR has been under accumulation recently, forming a nice base with signs of institutional accumulation (pocket pivots, volume and price tightening) and yesterday broke the $52 pivot with big volume to reach ATHs. RS is strong and the cluster of RS before new highs prior to yesterday's breakout is a good sign that this could be a good time to enter for a decent move (no overhead resistance and a strong sector)
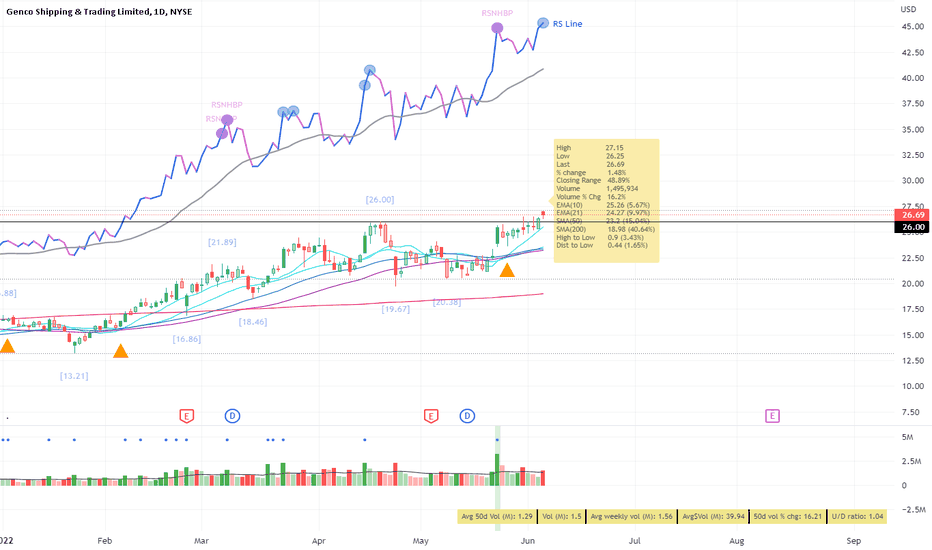
GNK breakout to ATHsGNK has seen a recent increase in volume and clear signs of accumulation in the last few months, in particular drifting price after pocket pivot signals in the volume indicator. This resulted in GNK breaking out to ATHs over the $26 pivot level yesterday. Relative strength is good and price is holding up well despite bearish market conditions. Look for price to hold over $26 with volume, which will confirm this previous resistance is now acting as support
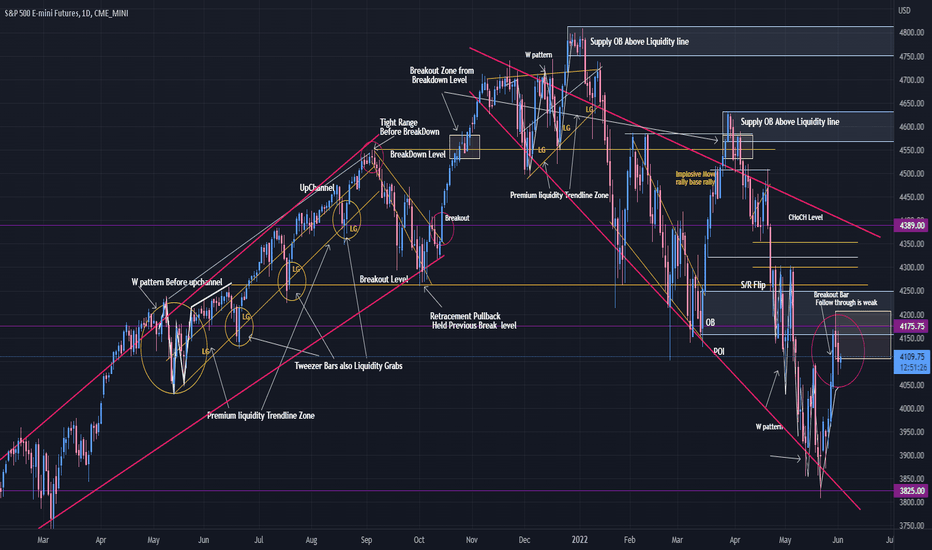
Es Liquidity Story From the Daily PerspectiveWe Find Internal Liquidity Patterns inside larger Ranges from the Monthly and Weekly Demand and Supply Zones, We know a few key things that PA likes to Move Range to Range, Liquidity attracts Price Action, and Patterns are Factual in every timeframe you will find the same patterns, Candlesticks, and Characteristics. Find the Story, Create your Levels, and Trade your Plan.. Those are my thoughts on Market Structure, Trade Happy!
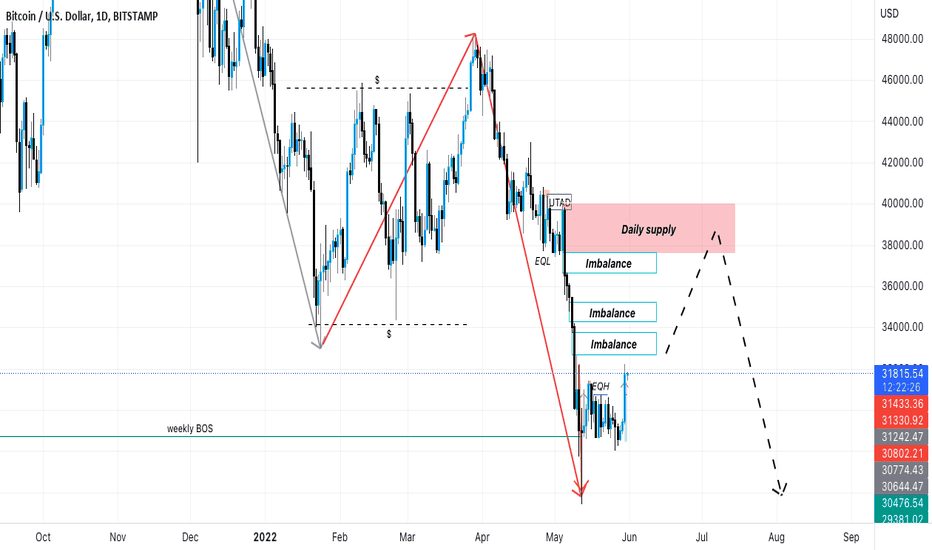
Retracement to daily supply s you can see on my supply & demand analysis, I'm fully bearish (unfortunately) on btc , specially right now with recession, inflation , international conflicts and high unemployment rates. This bullish movement is only a retracement to an daily supply zone for then dropping again below the 28k.
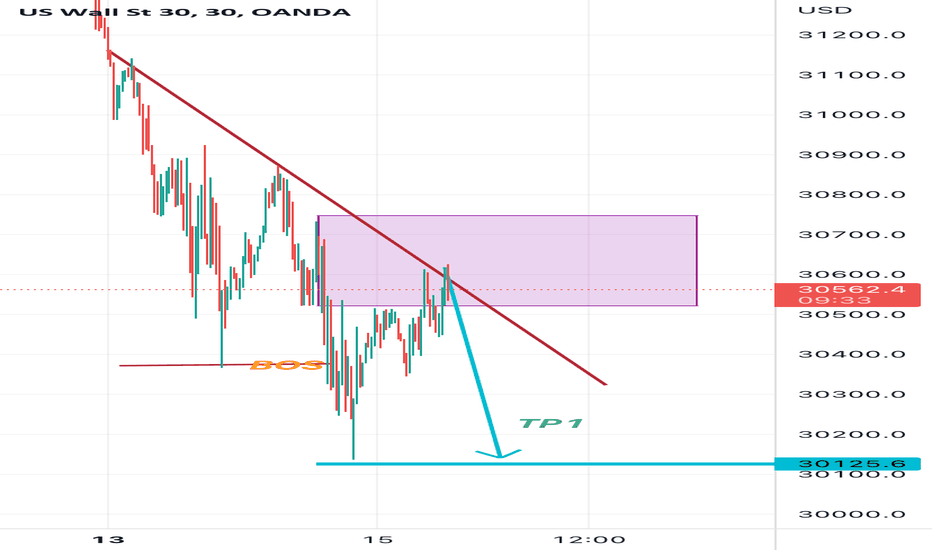
NASDAQ NAS100 SHORT / SELLS NAS100 left huge imbalance in our Point of Interest. Currently in a buy as 15M broke structure to confirm our countertrend. Will be buying up to our POI are and wait for 5M/15M break of structure. Alerts at the beginning of blue box, will be patient and wait for price to enter our area before placing a sell.
Will update once we are in our area!
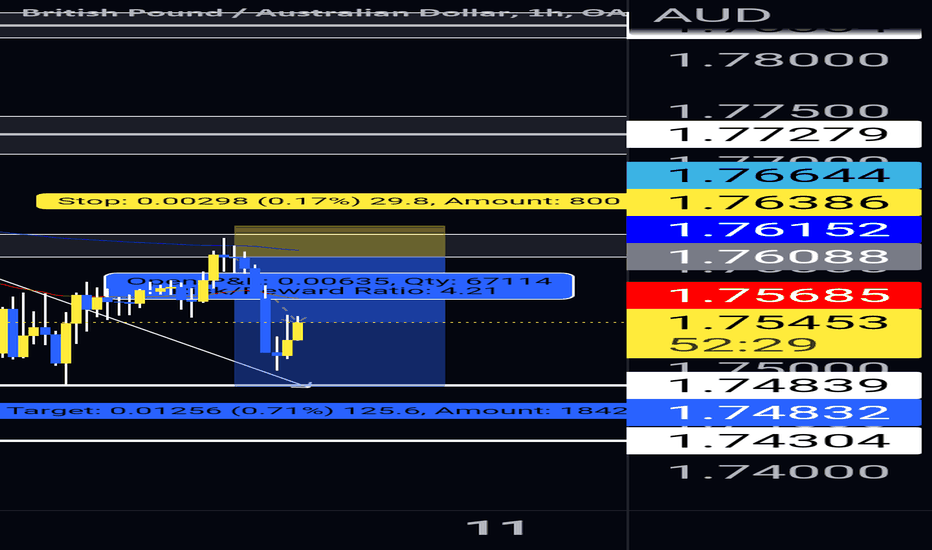
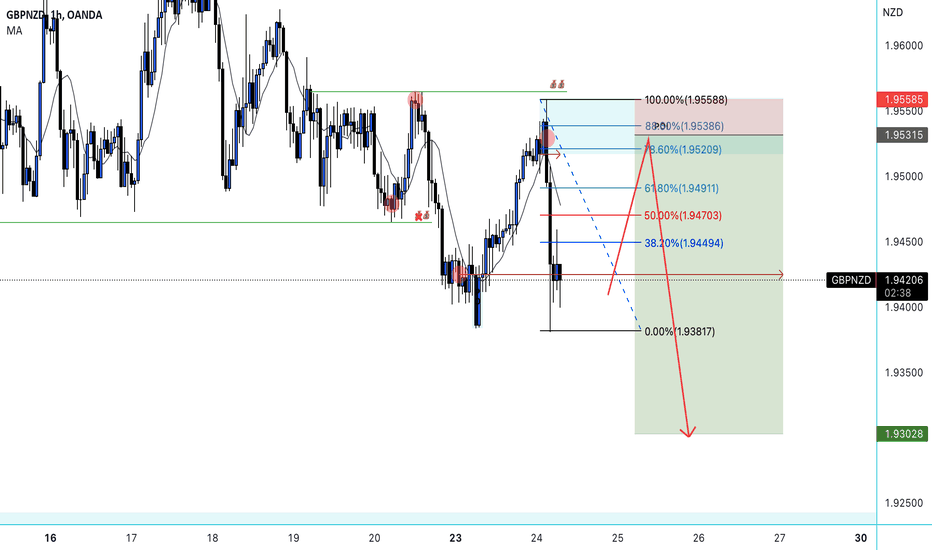
GBPNZD SELL/SHORT TRADE IDEAGBPNZD still currently downtrending, 4H still continues to make lower lows and lower highs.
Although 1H did break to the upside, we failed to create a new high and broke to the downside.
New range was created, fibonacci retracement snipe zone aligns with institutional candle for a mitigation trade.
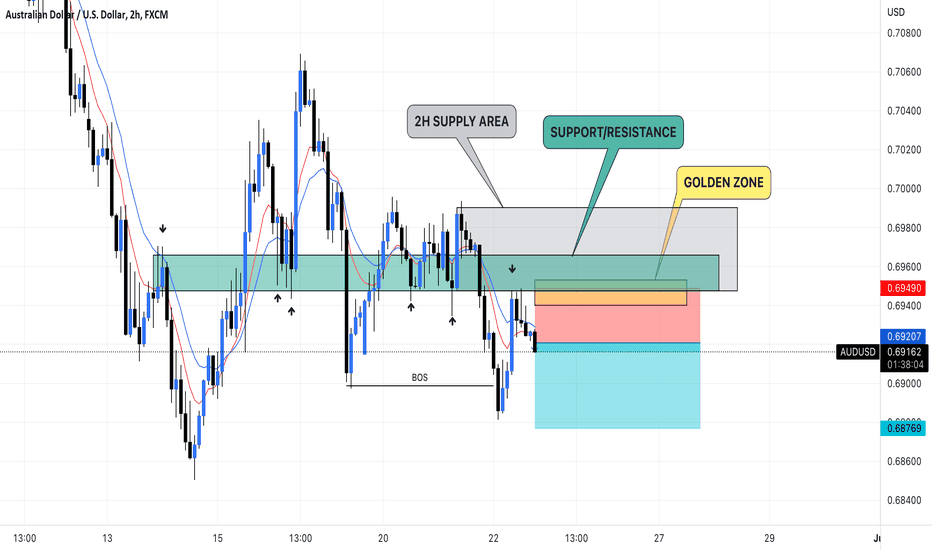
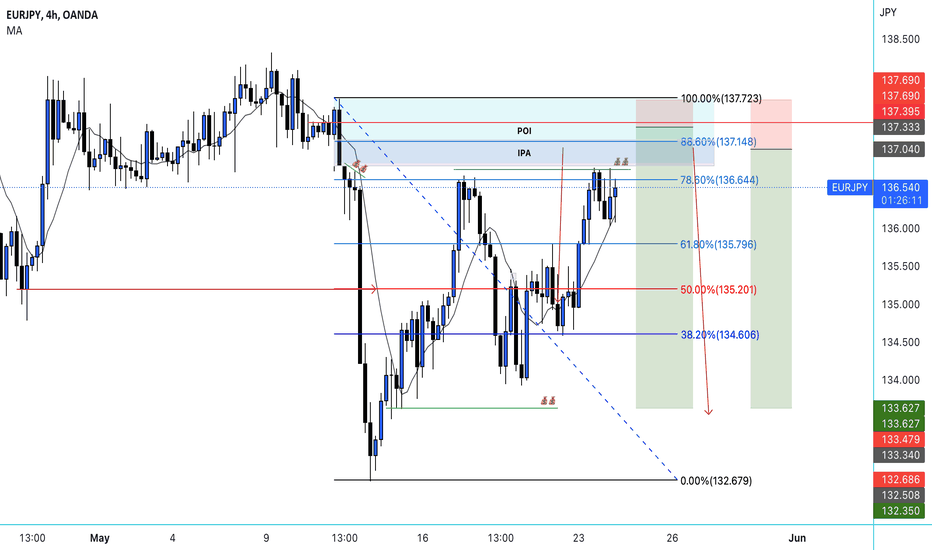
EURJPY SELL/SHORT TRADE IDEAEURJPY has been downtrending. Still within 4H range, liquidity left behind to get swept.
Entry is based on 4H institutional move, mitigation out of last buy position that manipulated price, fibonacci snipe zone 78.5-88.6% and liquidity also known as retail traders "double tops".
Two positions in case the higher snipe isn't activated. Risk : Reward is worth the trade!
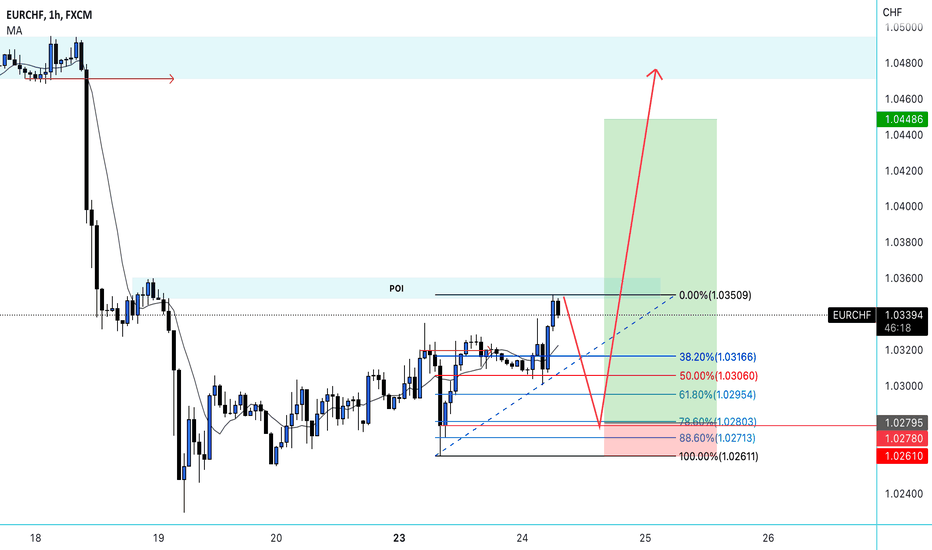
EURCHF BUY TRADE IDEAEURCHF
Daily structure we have been bullish. Current market structure shows us currently around a possible Higher low.
4H downtrending but have finally show bullish momentum by closing above previous high. Looking to enter trade at a higher low by looking at lower timeframes for entry.
1H we have closed above previous high and created a new trading range. Fibonacci is placed from low to new high and anticipating a retracement in the snipe zone 78.6% - 88.6%.
Entry is at the last bearish candle on 5m timeframe within the snipe zone.
If price continues to go above high before hitting entry, will update trade for next possible entry!
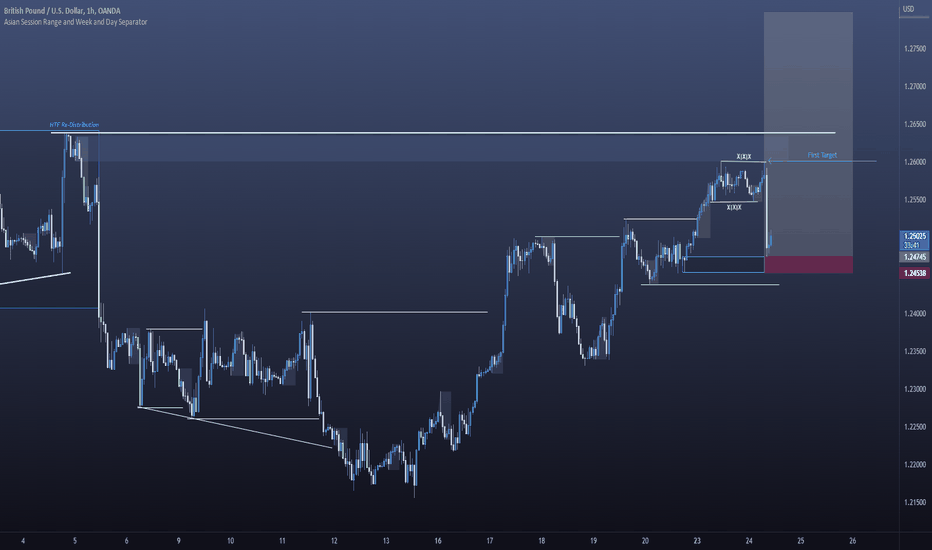
USDCAD BUY TO SELL TRADE WITH TRENDUSDCAD has been on a downtrend on higher timeframes.
Current market structure appears to be finally moving to the upside. 1 Hour has stopped making a new low and has broke structure to the upside. Lower timeframes are in a countertrend moving towards our buy position.
If price breaks below current low, trades cancelled and we wait for next opportunity.
Higher timeframes bearish
Lower timeframes bullish
Buy to Sell, trade with the trend.
