Great Short Trades on the DOW as price dumped on FOMCThe DOW was sold lower as traders looked to lock in some profit.
By planning ahead and assessing recent price action, you were able to steer clear of the early rally and focus on Sell Setups to take advantage of the selloff.
In the video review, I talk through the previous sessions price action and why I was looking for selling opportunities. I then discuss the Price Action on the trading charts and the momentum plays that led to the Sell Entry setups!!
ANY QUESTIONS, JUST LEAVE IN THE COMMENTS !!
** If you like the content then take a look at the profile to get more ideas and learning material **
** Any Comments and likes are greatly appreciated **
Intraday

BANK NIFTY INTRADAY LEVELS FOR 23 MAY 2024BUY ABOVE - 47990
SL - 47860
TARGETS - 48110,48250,48460
SELL BELOW - 47760
SL - 47860
TARGETS - 47580,47400,47200
NO TRADE ZONE - 47760 to 47990
Previous Day High - 48110
Previous Day Low - 47400
Based on price action major support & resistance's are here, the red lines acts as resistances, the green lines acts as supports. If the price breaks the support/resistance, it will move to the next support/resistance line. White lines indicates previous day high & low, high acts as a resistance & low acts as a support for next day.
Trendlines are also significant to price action. If the price is above/below the trendlines, can expect an UP/DOWN with aggressive move.
Please NOTE: this levels are for intraday trading only.
Disclaimer - All information on this page is for educational purposes only,
we are not SEBI Registered, Please consult a SEBI registered financial advisor for your financial matters before investing And taking any decision. We are not responsible for any profit/loss you made.
Request your support and engagement by liking and commenting & follow to provide encouragement
HAPPY TRADING 👍

NIFTY INTRADAY LEVELS FOR 23/05/2024BUY ABOVE - 22640
SL - 22590
TARGETS - 22710,22780,22830
SELL BELOW - 22550
SL - 22590
TARGETS - 22500,22440,22350
NO TRADE ZONE - 22550 to 22640
Previous Day High - 22640
Previous Day Low - 22500
Based on price action major support & resistance's are here, the red lines acts as resistances, the green lines acts as supports. If the price breaks the support/resistance, it will move to the next support/resistance line. White lines indicates previous day high & low, high acts as a resistance & low acts as a support for next day.
Trendlines are also significant to price action. If the price is above/below the trendlines, can expect an UP/DOWN with aggressive move.
Please NOTE: this levels are for intraday trading only.
Disclaimer - All information on this page is for educational purposes only,
we are not SEBI Registered, Please consult a SEBI registered financial advisor for your financial matters before investing And taking any decision. We are not responsible for any profit/loss you made.
Request your support and engagement by liking and commenting & follow to provide encouragement
HAPPY TRADING 👍

Day Trading Nifty- Sold Nifty Below 22565 22nd May ’24 Below mentioned points are discussed in my post analysis video(Fast forward to 0:22 for Hindi Audio)
-No Trades in the morning
-Nifty had sell volumes in the morning!
-Sold Nifty Below 22565;Sl hit
-How will i trade when market opens tom

Winning Trades thanks to a clear Price Action readIn the video I talk through my trades on the DOW and reasoning for the executions.
I aim to take some trades early in the session if they setup and we had a few good setups in a generally range bound market.
I like to initially plan out the key levels using higher timeframe charts and then trade using the 5 min and 1min charts. By using a fast and slow MACD, I can define the short term momentum moves and then trade around them using the price action setups.
ANY QUESTIONS, JUST LEAVE IN THE COMMENTS !!
** If you like the content then take a look at the profile to get more ideas and learning material **
** Any Comments and likes are greatly appreciated **

BANK NIFTY INTRADAY LEVELS FOR 22/05/2024BUY ABOVE - 48250
SL - 48110
TARGETS - 48460,48660,48800
SELL BELOW - 47990
SL - 48110
TARGETS - 47860,47730,47570
NO TRADE ZONE - 47990 to 48100
Previous Day High - 48250
Previous Day Low - 47990
Based on price action major support & resistance's are here, the red lines acts as resistances, the green lines acts as supports. If the price breaks the support/resistance, it will move to the next support/resistance line. White lines indicates previous day high & low, high acts as a resistance & low acts as a support for next day.
Trendlines are also significant to price action. If the price is above/below the trendlines, can expect an UP/DOWN with aggressive move.
Please NOTE: this levels are for intraday trading only.
Disclaimer - All information on this page is for educational purposes only,
we are not SEBI Registered, Please consult a SEBI registered financial advisor for your financial matters before investing And taking any decision. We are not responsible for any profit/loss you made.
Request your support and engagement by liking and commenting & follow to provide encouragement
HAPPY TRADING 👍

NIFTY INTRADAY LEVELS FOR 22/05/2024BUY ABOVE - 22550
SL - 22500
TARGETS - 22590,22640,22710
SELL BELOW - 22500
SL - 22550
TARGETS - 22440,22350,22300
NO TRADE ZONE - 22500 to 22550
Previous Day High - 22590
Previous Day Low - 22440
Based on price action major support & resistance's are here, the red lines acts as resistances, the green lines acts as supports. If the price breaks the support/resistance, it will move to the next support/resistance line. White lines indicates previous day high & low, high acts as a resistance & low acts as a support for next day.
Trendlines are also significant to price action. If the price is above/below the trendlines, can expect an UP/DOWN with aggressive move.
Please NOTE: this levels are for intraday trading only.
Disclaimer - All information on this page is for educational purposes only,
we are not SEBI Registered, Please consult a SEBI registered financial advisor for your financial matters before investing And taking any decision. We are not responsible for any profit/loss you made.
Request your support and engagement by liking and commenting & follow to provide encouragement
HAPPY TRADING 👍

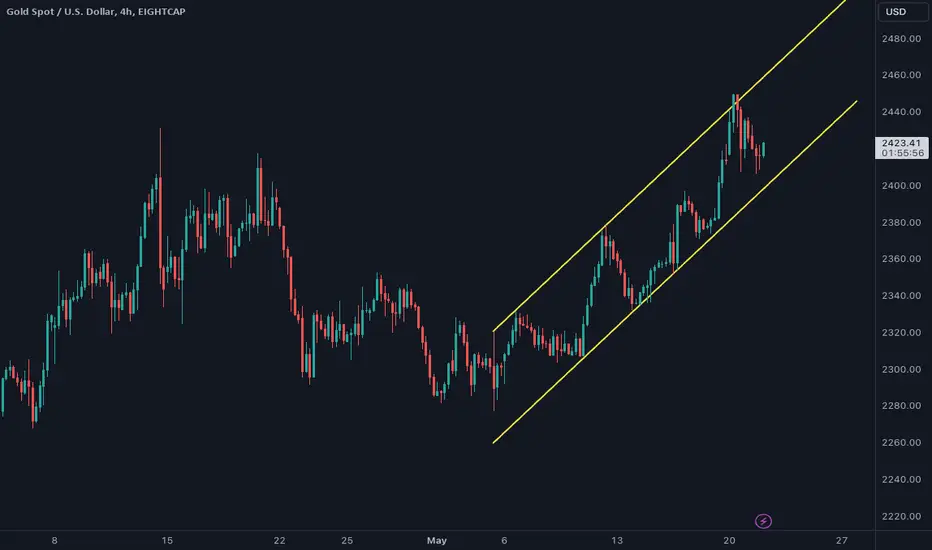
simple parallel channelprice is up again and made new all time high
investors bought the dip at $2300 psychological level
this new rally is testing upper and lower yellow line
price has made yellow parallel channel
Day Trading Nifty-Bought nifty for 22700 break 21st May ’24Below mentioned points are discussed in my post analysis video(Fast forward to 0:39 for Hindi Audio)
-No Trades in the morning
-No Volumes in nifty
-Bought nifty for 22700 break;
-How will i trade when market opens tom

Trapped traders provides a great Short opportunity on DOW The plan for the session was to trade short off resistance on the DOW after an initial opening drive higher. The short side was the play and paid out nicely for patient sellers.
In the video I talk through the key Price Action for the move and prime trade areas on the DOW Index.
ANY QUESTIONS, JUST LEAVE IN THE COMMENTS !!
** If you like the content then take a look at the profile to get more ideas and learning material **
** Any Comments and likes are greatly appreciated **

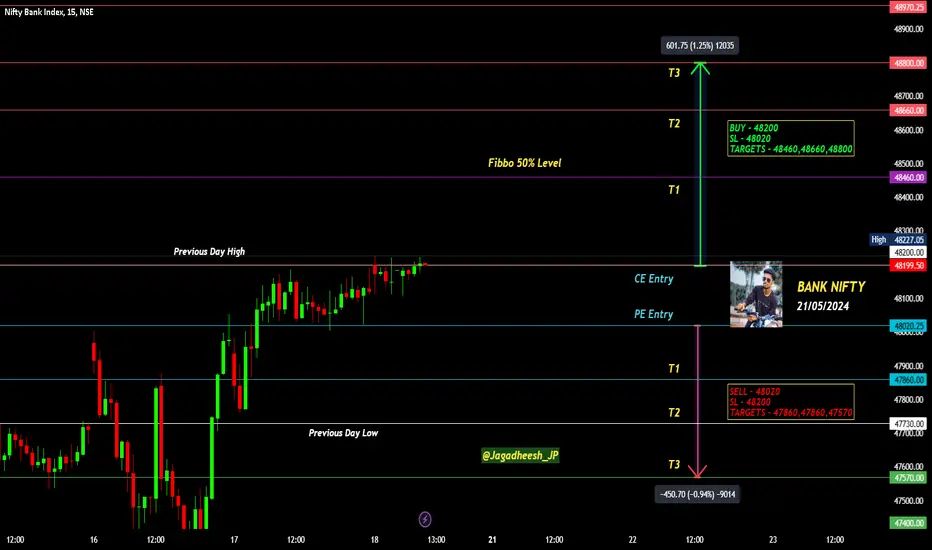
BANK NIFTY INTRADAY LEVELS FOR 21 MAY 2024BUY ABOVE - 48200
SL - 48020
TARGETS - 48460,48660,48800
SELL BELOW - 48020
SL - 48200
TARGETS - 47860,47860,47570
NO TRADE ZONE - 48020 to 48200
Previous Day High - 48200
Previous Day Low - 47730
Based on price action major support & resistance's are here, the red lines acts as resistances, the green lines acts as supports. If the price breaks the support/resistance, it will move to the next support/resistance line. White lines indicates previous day high & low, high acts as a resistance & low acts as a support for next day.
Trendlines are also significant to price action. If the price is above/below the trendlines, can expect an UP/DOWN with aggressive move.
Please NOTE: this levels are for intraday trading only.
Disclaimer - All information on this page is for educational purposes only,
we are not SEBI Registered, Please consult a SEBI registered financial advisor for your financial matters before investing And taking any decision. We are not responsible for any profit/loss you made.
Request your support and engagement by liking and commenting & follow to provide encouragement
HAPPY TRADING 👍
NIFTY INTRADAY LEVELS FOR 21 MAY 2024BUY ABOVE - 22500
SL - 22430
TARGETS - 22550,22600,22640
SELL BELOW - 22430
SL - 22500
TARGETS - 22350,22300,22230
NO TRADE ZONE - 22430 to 22500
Previous Day High - 22500
Previous Day Low - 22350
Based on price action major support & resistance's are here, the red lines acts as resistances, the green lines acts as supports. If the price breaks the support/resistance, it will move to the next support/resistance line. White lines indicates previous day high & low, high acts as a resistance & low acts as a support for next day.
Trendlines are also significant to price action. If the price is above/below the trendlines, can expect an UP/DOWN with aggressive move.
Please NOTE: this levels are for intraday trading only.
Disclaimer - All information on this page is for educational purposes only,
we are not SEBI Registered, Please consult a SEBI registered financial advisor for your financial matters before investing And taking any decision. We are not responsible for any profit/loss you made.
Request your support and engagement by liking and commenting & follow to provide encouragement
HAPPY TRADING 👍

Review and plan for 21st May 2024 Nifty future and banknifty future analysis and intraday plan in kannada.
This video is for information/education purpose only. you are 100% responsible for any actions you take by reading/viewing this post.
please consult your financial advisor before taking any action.
----Vinaykumar hiremath, CMT

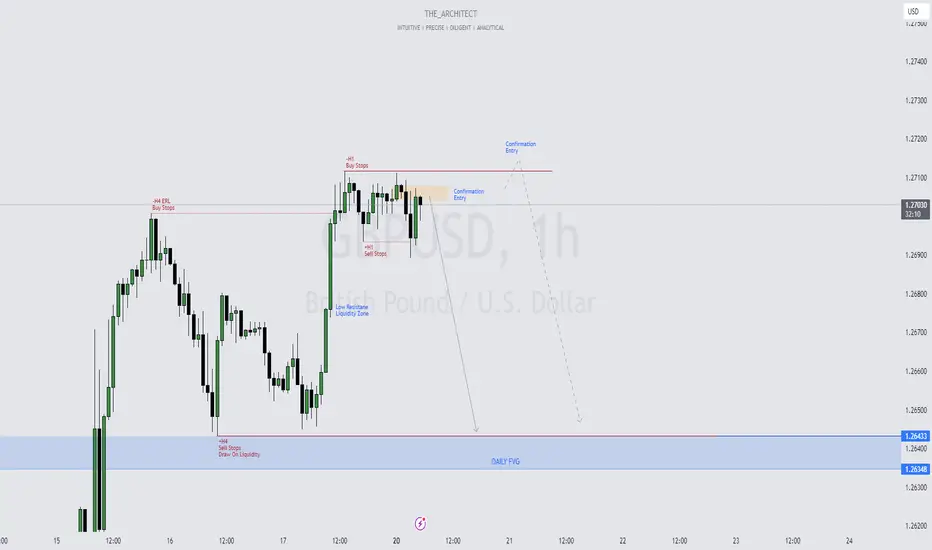
GBPUSD Trading Insights: Capitalizing on Bearish Opportunities!Dear Traders,
On Friday, the GBPUSD experienced significant volatility, leading to a notable upward movement. This action resulted in the formation of a Low Resistance Liquidity Zone, indicating minimal resistance for price movement through this area. Additionally, the price left relatively equal lows, suggesting the presence of H4 Sell Stops. We anticipate the price to target this area, which aligns with the Daily Fair Value Gap (FVG), drawing liquidity in that direction.
Currently, we are considering two scenarios for potential confirmation entries towards our objectives:
H1 Bearish Order Block : We are at an H1 bearish order block, and a price sell-off from this point is possible if we receive the appropriate confirmation signals.
H1 Buy Stops : Alternatively, the price may trigger the H1 Buy Stops. In this scenario, we expect smart money to take positions against these buy stops, creating selling opportunities. Confirmation entries will be considered if this occurs.
Please stay tuned for our upcoming weekly video outlook on GBPUSD, where we will provide further insights and detailed analysis.
Best regards,
Kind Regards,
The_Architect
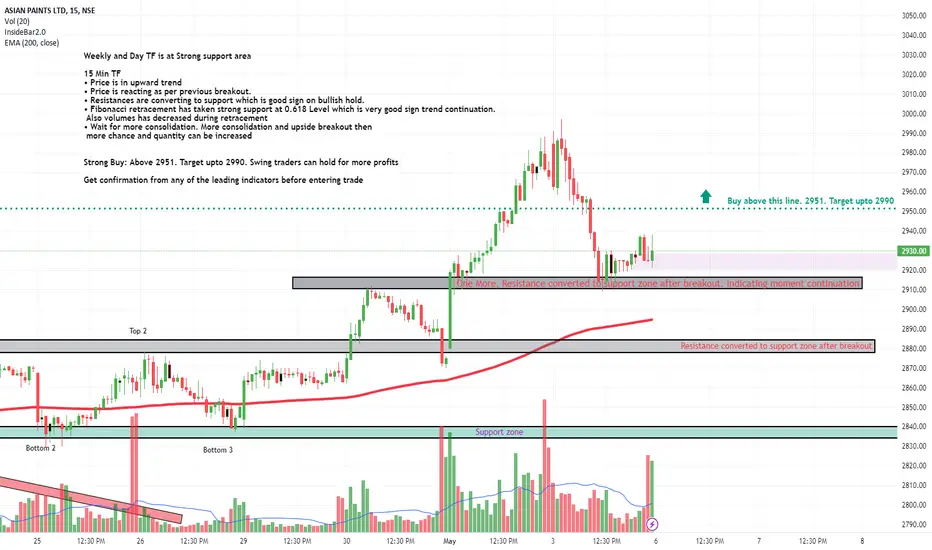
Asian Paints Intraday and Swing for 06.05.2024-Bullish
As per the reference analysis on 29th April for intraday, we got good trades(Attached link for the previous analysis). In continuation to this, we got very good structure formation towards bullish movement.
Weekly and Day TF is at Strong support area
15 Min TF
• Price is in upward trend
• Price is reacting as per previous breakout.
• Resistances are converting to support which is good sign on bullish hold.
• Wait for more consolidation. More consolidation and upside breakout then more chance and quantity can be increased
• Fibonacci retracement has taken strong support at 0.618 Level which is very good sign trend continuation. Also volumes has decreased during retracement
Strong Buy: Above 2951. Target upto 2990. Swing traders can hold for more profits
Get confirmation from any of the leading indicators before entering trade
Kindy comment below in case of any clarification required on this particular idea.
Please follow for more ideas
Day Trading Nifty- No short/long triggered 17th May ’24 Below mentioned points are discussed in my post analysis video(Fast forward to 0:16 for Hindi Audio)
-No Trades in the morning
-No Volumes in nifty before 10
-No short or long triggered
-How will i trade when market opens tom

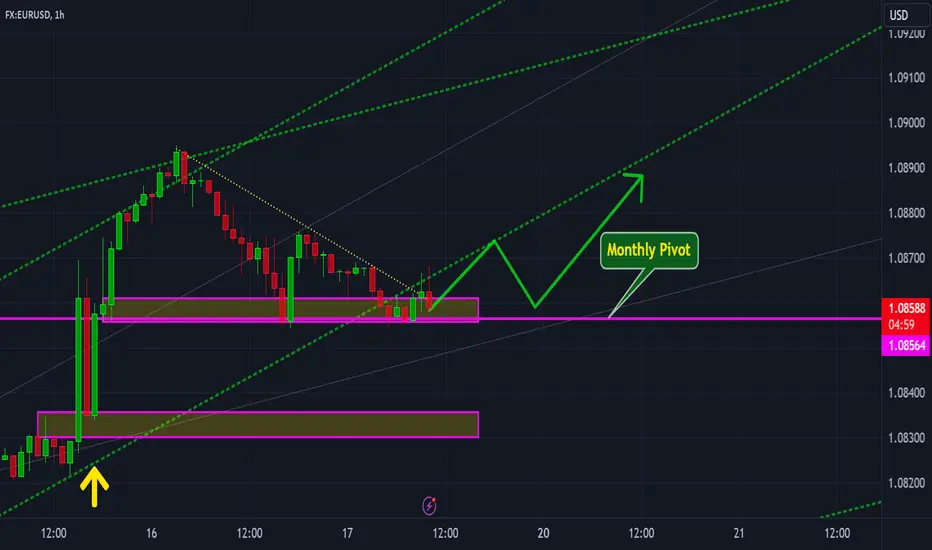
EURUSD: Short-term guideThis is my suggested path for EURUSD for short-term trading
It might be expired or invalidated
first a bullish move to 1.0874. Then we'll wait for a retrace again to yesterday's pivot, a little over the monthly pivot which is around 1.0859 and a final upward move is waiting for us there to tp of 1.0887
Remember that the numbers are not necessarily precise they might be invalidated and some noises could annoy traders. I generally don't recommend short-term trading but by taking marginal risks it's rational
BANK NIFTY INTRADAY LEVELS FOR 17 MAY 2024BUY ABOVE - 48050
SL - 47860
TARGETS - 48220,48460,48660
SELL BELOW - 47860
SL - 48050
TARGETS - 47730,47570,47400
NO TRADE ZONE - 47860 to 48050
Previous Day High - 48050
Previous Day Low - 47400
Based on price action major support & resistance's are here, the red lines acts as resistances, the green lines acts as supports. If the price breaks the support/resistance, it will move to the next support/resistance line. White lines indicates previous day high & low, high acts as a resistance & low acts as a support for next day.
Trendlines are also significant to price action. If the price is above/below the trendlines, can expect an UP/DOWN with aggressive move.
Please NOTE: this levels are for intraday trading only.
Disclaimer - All information on this page is for educational purposes only,
we are not SEBI Registered, Please consult a SEBI registered financial advisor for your financial matters before investing And taking any decision. We are not responsible for any profit/loss you made.
Request your support and engagement by liking and commenting & follow to provide encouragement
HAPPY TRADING 👍

NIFTY INTRADAY LEVELS FOR 17 MAY 2024BUY ABOVE - 22420
SL - 22350
TARGETS - 22470,22510,22550
SELL BELOW - 22350
SL - 22300
TARGETS - 22300,22230,22160
NO TRADE ZONE - 22350 to 22420
Previous Day High - 22420
Previous Day Low - 22060
Based on price action major support & resistance's are here, the red lines acts as resistances, the green lines acts as supports. If the price breaks the support/resistance, it will move to the next support/resistance line. White lines indicates previous day high & low, high acts as a resistance & low acts as a support for next day.
Trendlines are also significant to price action. If the price is above/below the trendlines, can expect an UP/DOWN with aggressive move.
Please NOTE: this levels are for intraday trading only.
Disclaimer - All information on this page is for educational purposes only,
we are not SEBI Registered, Please consult a SEBI registered financial advisor for your financial matters before investing And taking any decision. We are not responsible for any profit/loss you made.
Request your support and engagement by liking and commenting & follow to provide encouragement
HAPPY TRADING 👍

Review and plan for 17th May 2024Nifty future and banknifty future analysis and intraday plan in kannada.
This video is for information/education purpose only. you are 100% responsible for any actions you take by reading/viewing this post.
please consult your financial advisor before taking any action.
----Vinaykumar hiremath, CMT

Day Trading Nifty- Post 12 move took my profits 16th May ’24Below mentioned points are discussed in my post analysis video(Fast forward to 0:56 for Hindi Audio)
-No Trades in the morning
-Good buy Volumes in nifty
-Post 12 move took my profits
-How will i trade when market opens tom

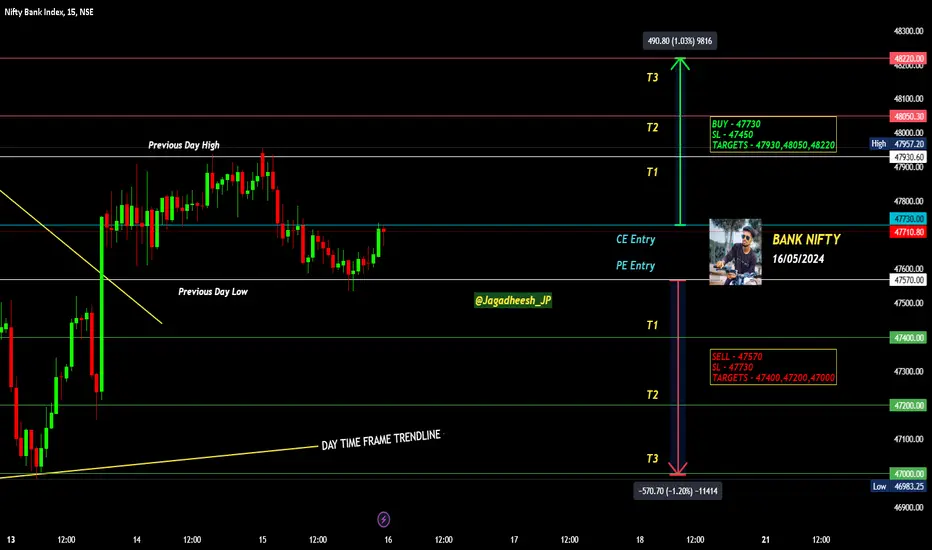
BANK NIFTY INTRADAY LEVELS 16 MAY 2024BUY ABOVE - 47730
SL - 47450
TARGETS - 47930,48050,48220
SELL BELOW - 47570
SL - 47730
TARGETS - 47400,47200,47000
NO TRADE ZONE - 47570 to 47730
Previous Day High - 47930
Previous Day Low - 47570
Based on price action major support & resistance's are here, the red lines acts as resistances, the green lines acts as supports. If the price breaks the support/resistance, it will move to the next support/resistance line. White lines indicates previous day high & low, high acts as a resistance & low acts as a support for next day.
Trendlines are also significant to price action. If the price is above/below the trendlines, can expect an UP/DOWN with aggressive move.
Please NOTE: this levels are for intraday trading only.
Disclaimer - All information on this page is for educational purposes only,
we are not SEBI Registered, Please consult a SEBI registered financial advisor for your financial matters before investing And taking any decision. We are not responsible for any profit/loss you made.
Request your support and engagement by liking and commenting & follow to provide encouragement
HAPPY TRADING 👍
NIFTY INTRADAY LEVELS FOR 16 MAY 2024BUY ABOVE - 22230
SL - 22190
TARGETS - 22270,22300,22350
SELL BELOW - 22190
SL - 22230
TARGETS - 22160,22120,22070
NO TRADE ZONE - 22190 to 22230
Previous Day High - 22300
Previous Day Low - 22160
Based on price action major support & resistance's are here, the red lines acts as resistances, the green lines acts as supports. If the price breaks the support/resistance, it will move to the next support/resistance line. White lines indicates previous day high & low, high acts as a resistance & low acts as a support for next day.
Trendlines are also significant to price action. If the price is above/below the trendlines, can expect an UP/DOWN with aggressive move.
Please NOTE: this levels are for intraday trading only.
Disclaimer - All information on this page is for educational purposes only,
we are not SEBI Registered, Please consult a SEBI registered financial advisor for your financial matters before investing And taking any decision. We are not responsible for any profit/loss you made.
Request your support and engagement by liking and commenting & follow to provide encouragement
HAPPY TRADING 👍
