Intradaytrade
XAU/USD Intraday Plan | Support & Resistance to WatchGold staged a minor recovery overnight after bouncing from the 3,267 Support Zone, and is now trading around 3,305. Price remains below both the 50MA and 200MA, which continue to slope downward—confirming short-term bearish structure.
This current move is still corrective unless bulls manage to reclaim the 3,309–3,334 resistance zone. A clean break and hold above 3,334 would be the first sign of strength, opening up potential retests of 3,348 and 3,362.
Until then, any rallies into the 3,309–3,334 zone should be viewed with caution. If the bounce loses steam, watch for a retest of 3,289 - 3,267. A break below that would expose the 3,241 and 3,208 levels, with the HTF Support Zone (3,241–3,208) acting as a broader downside cushion.
📌 Key Levels to Watch
Resistance:
‣ 3,309
‣ 3,334
‣ 3,348
‣ 3,362
Support:
‣ 3,289
‣ 3,267
‣ 3,241
‣ 3,208
🔍 Fundamental Focus – Thursday, July 31
Big day for data.
🟥 Core PCE, Employment Cost Index, and Unemployment Claims — all critical for Fed outlook and could move gold sharply.
⚠️ Volatility expected around 2:30pm. Stay nimble and manage risk carefully.

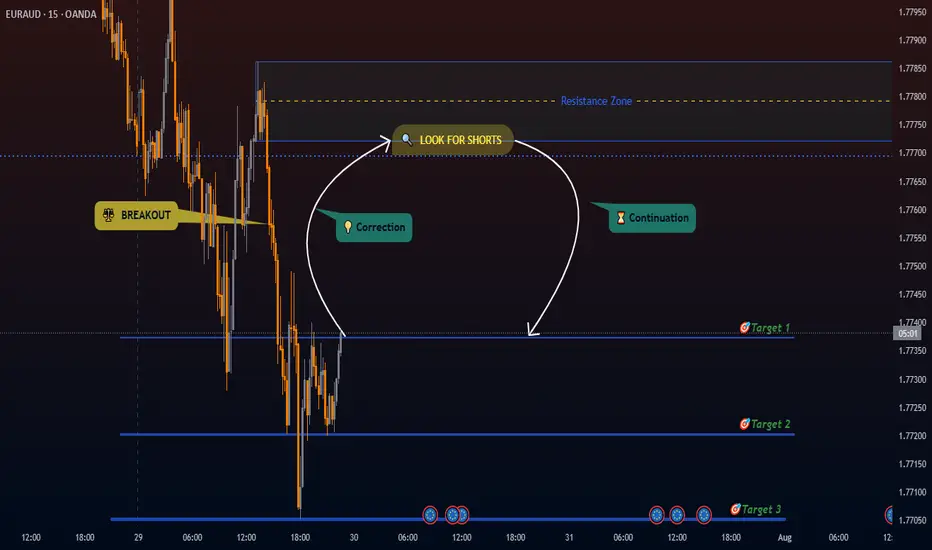
EURAUD Potential Bearish Setup Distribution pattern with breakdown below key support suggests downside momentum.
Break above our Resistance zone will invalidate our trade setup; good idea to watch out if that happens.
- Breakdown Level: 1.77694 -1.77722
- Entry Strategy: Sell orders at BOS
- Stop Loss: Above Resistance zone
- Target Zones:
- Primary Target: Target 1 (R:R 1:2)
- Secondary Target: Target 2 (R:R 1:3)
- Extension Target: Target 3 (R:R 1:4)
Bearish/Bullish Confirmations:
🔻 Rejection candlestick patterns
🔻 Bearish Reversal patterns
🔻 Impulsive moves in line with setups directional bias
Position Management:
- Exit: Partial profits at targets
- Stop adjustment: Trail stops when target are hit
LIKE or COMMENT if this idea sparks your interest, or share your thoughts below!
FOLLOW to keep up with fresh ideas.
Tidypips: "Keep It Clean, Trade Mean!"
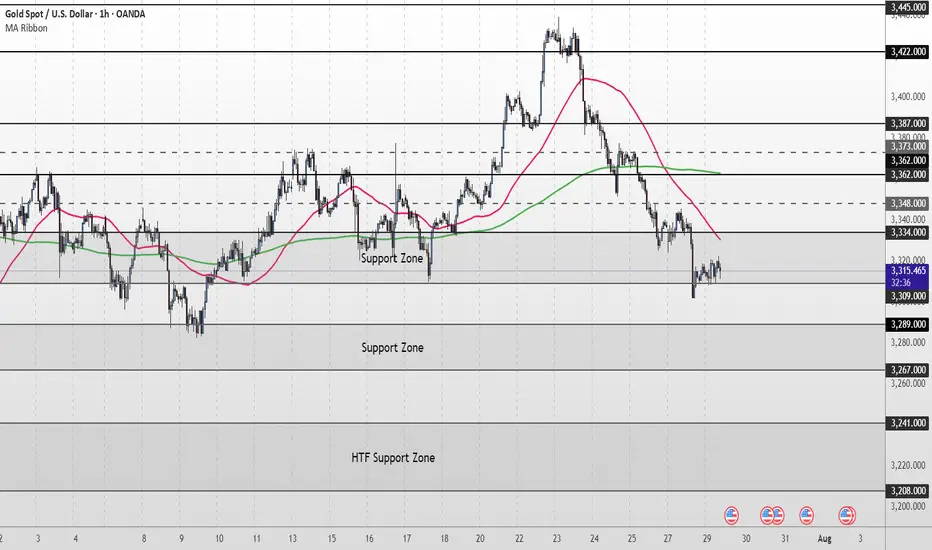
XAU/USD Intraday Plan | Support & Resistance to WatchGold remains under pressure, currently trading around 3,312. Price is holding just above the 3,309–3,289 Support Zone, but remains below both the 50MA and 200MA, which continue to slope downward—indicating short-term bearish pressure.
As long as price remains below the 3,334–3,348 resistance zone, the bearish momentum is intact. A clean break above this area would be the first sign of recovery, opening the path toward 3,362 and 3,373, where the next round of supply may emerge.
If price fails to reclaim 3,334 and breaks below 3,309, the 3,289–3,267 Support Zone becomes the next key downside target. Failure to hold that level would expose the HTF Support Zone (3,241–3,208).
📌 Key Levels to Watch
Resistance:
‣ 3,334
‣ 3,348
‣ 3,362
‣ 3,373
Support:
‣ 3,309
‣ 3,289
‣ 3,267
‣ 3,241
🔍 Fundamental Focus – Tuesday, July 29
Heads up — today’s focus is on 4:00pm, when we get JOLTS Job Openings 🟥 and CB Consumer Confidence 🟡
⚠️ Stay light and nimble — bigger moves may come tomorrow with red-folder data stacking up.
USDJPY Possible BEARISH setup🚀 USDJPY UPDATE: Bearish Setup
Summary:
Analysing price action from yesterday, breakout from the Daily timeframe accumulation zone has materialized with strong conviction.
TRADE SETUP Metrics:
- Entry: ✅
- Stop loss - Above Resistance Zone
- Target 1: (R:R 1:2)🎯
- Target 2: (R:R 1:3)🎯
- Target 3: (R:R 1:4)🎯
Technical Anticipations:
- Price action to show a Bearish follow-through
- Resistance zone to hold
Position Management:
- partial profits secured at Target 1
- Stop loss adjusted to breakeven upon reaching Targets
- Full Exit at Target 3
LIKE or COMMENT if this idea sparks your interest, or share your thoughts below!
FOLLOW to keep up with fresh ideas.
Tidypips: "Keep It Clean, Trade Mean!"

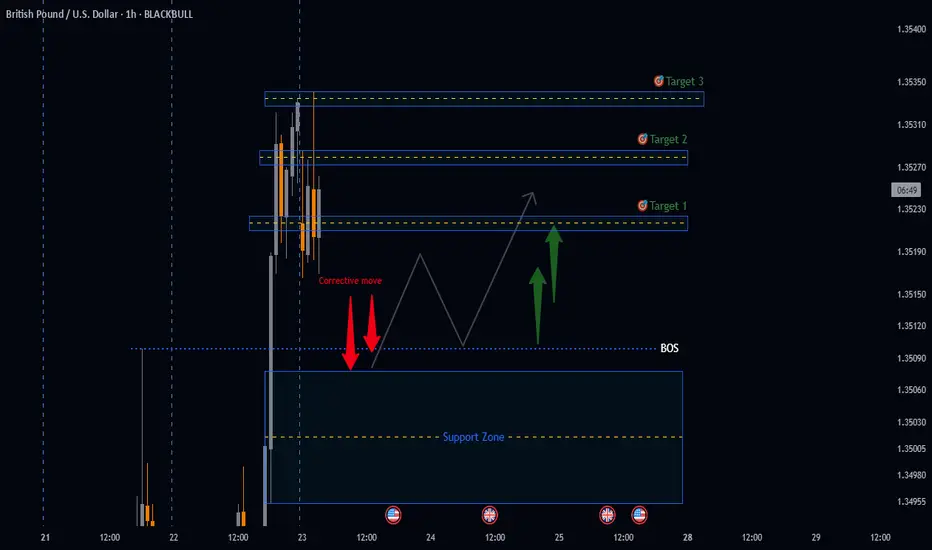
GBPUSD potential BULLISH Setup🚀 GBPUSD UPDATE: BULLISH Setup
Summary:
Analysing price action from yesterday, breakout from the Daily timeframe accumulation zone has materialized with strong conviction.
TRADE SETUP Metrics:
- Entry: ✅
- Stop loss - Below Support Zone
- Target 1: (R:R 1:2)🎯
- Target 2: (R:R 1:3)🎯
- Target 3: (R:R 1:4)🎯
Technical Anticipations:
- Price action to show a Bullish follow-through
- Support zone to hold
Position Management:
- partial profits secured at Target 1
- Stop loss adjusted to breakeven upon reaching Targets
- Final Target 3
LIKE or COMMENT if this idea sparks your interest, or share your thoughts below!
FOLLOW to keep up with fresh ideas.
Tidypips: "Keep It Clean, Trade Mean!"
XAUUSDDear traders,
In my previous analysis, I mentioned that gold could extend its short-term decline after being rejected from the range boundary. However, that bearish structure was quickly invalidated following a sharp upside move, signaling a potential trend reversal. If this momentum continues, I anticipate that price may soon reach the levels of 3,355 and 3,365.
Feel free to leave a comment if you have any thoughts to add. Good luck!

Banknifty chart analysis for tommorrowdosto
banknifty ka chart apko share kar raha hu jo apko kal ke liye help karega trading main.
aaj banknifty aur nifty dono ne hee ek breakout diaya.
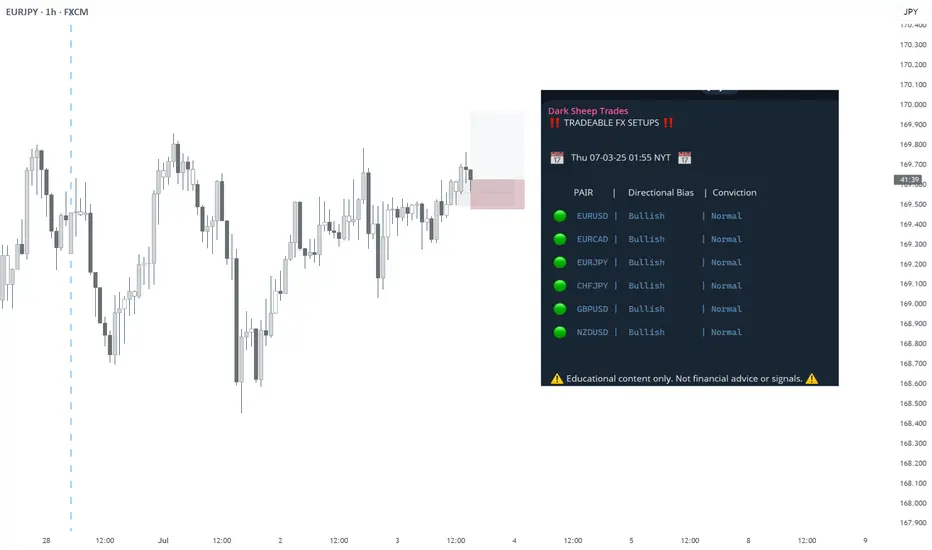
07/02/2025 | EURJPY | BULLISH - QUICK SCALPALL TIMEFRAME:
Bullish
Invalidation: 169.482
Target: 170.045
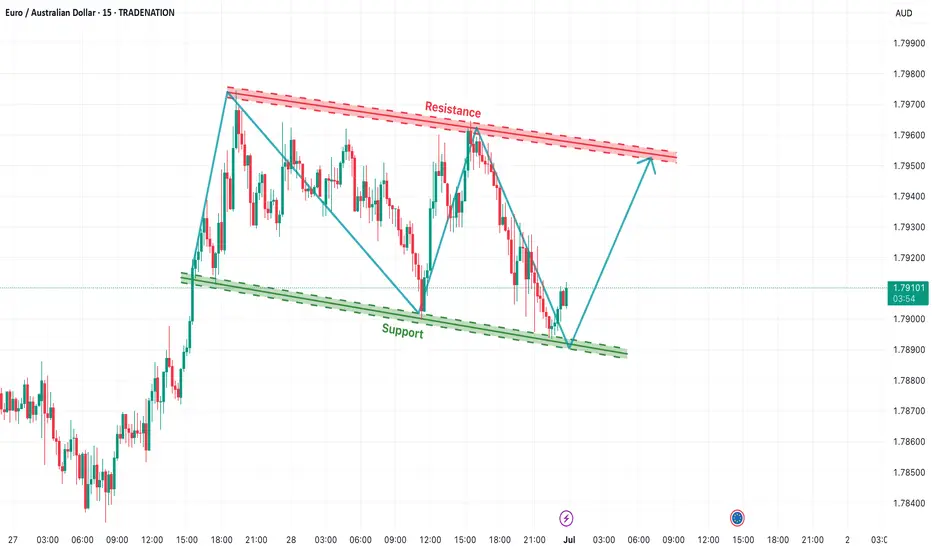
EUR/AUD Falling Channel Reversal SetupThe EUR/AUD pair is currently trading inside a well-respected falling channel structure on the 15-minute timeframe. Price action has been bouncing between a descending resistance trendline and a sloping support zone, confirming the integrity of the pattern. The pair recently rebounded from the lower boundary of the channel, indicating potential short-term bullish momentum ahead.
This setup highlights a typical channel reversal bounce, offering a high-probability trading opportunity if the pair maintains upward pressure.
📈 Bullish Scenario – Intraday Channel Rebound
The price has touched the support line near 1.7885 and is now climbing higher.
Based on previous cycles, price tends to move from support to resistance within this channel.
A bounce from this level may lead to a move toward the upper channel resistance zone around 1.7960–1.7970.
The blue arrows illustrate the expected zig-zag movement within the channel.
📉 Bearish Scenario – If Support Fails
If the price breaks below 1.7880, it would indicate a channel breakdown, invalidating the bullish setup.
Such a move could lead to fresh downside targets near 1.7850 or lower, continuing the micro downtrend.
🎯 Intraday Trade Plan
Buy Setup (Reversal Play):
Entry: 1.7895–1.7905 (after candle confirmation on support)
SL: Below 1.7875
TP: 1.7950–1.7970 (channel top)
Sell Setup (on rejection or breakdown):
Entry: Near 1.7960 resistance or breakdown below 1.7880
SL: Above 1.7980
TP: 1.7850 and below
🧭 Technical Outlook Summary
Pattern: Falling Channel
Bias: Short-term bullish (reversal from support)
Key Zones: 1.7885 support | 1.7960 resistance
Watch for breakout beyond channel for directional confirmation
=================================================================
Disclosure: I am part of Trade Nation's Influencer program and receive a monthly fee for using their TradingView charts in my analysis.
=================================================================
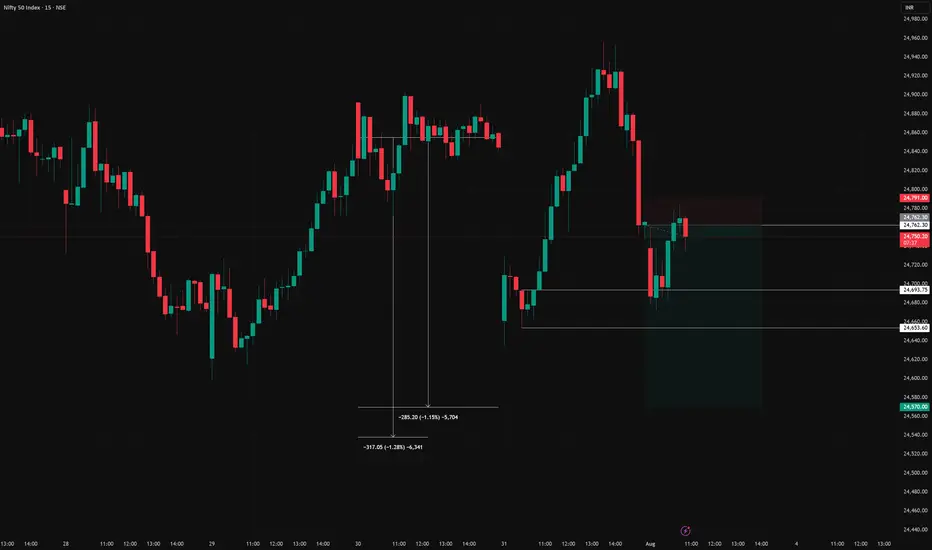
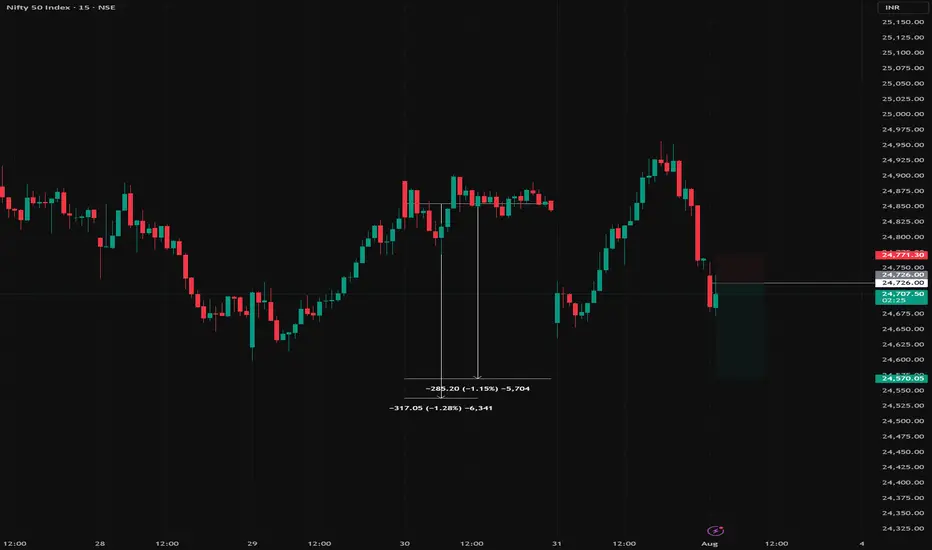
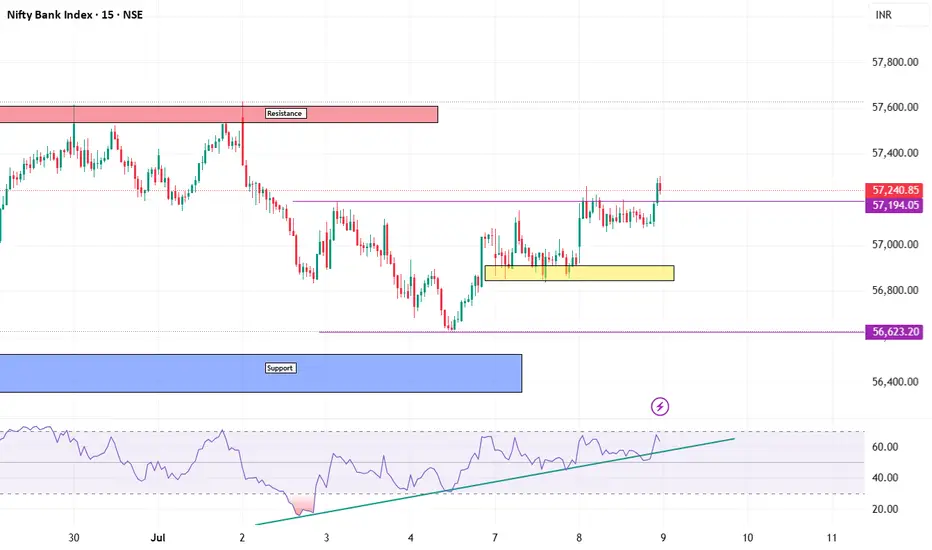
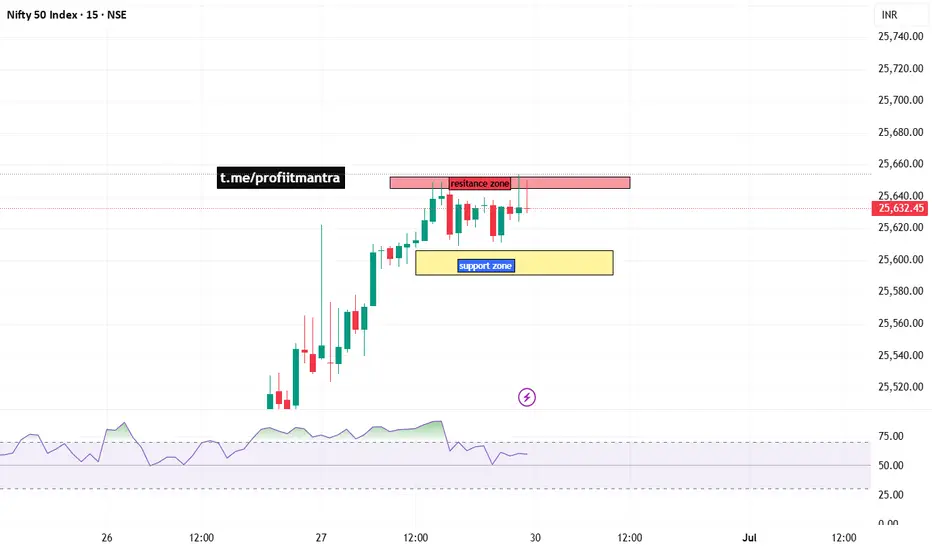
NIFTY 50 INDEX CHART ANALYSIS FOR INTRADAYNIFTY 50 INDEX CHART ANALYSIS FOR INTRADAY.
here we are seeing of nifty 50 index chart, and one is resistance and one box is support that is yellow color and if price will come to support and then we will try to find of buy opportunity. if support zone breaks then we will plan for sell of nifty and if break of resistance, then we will see big rally.
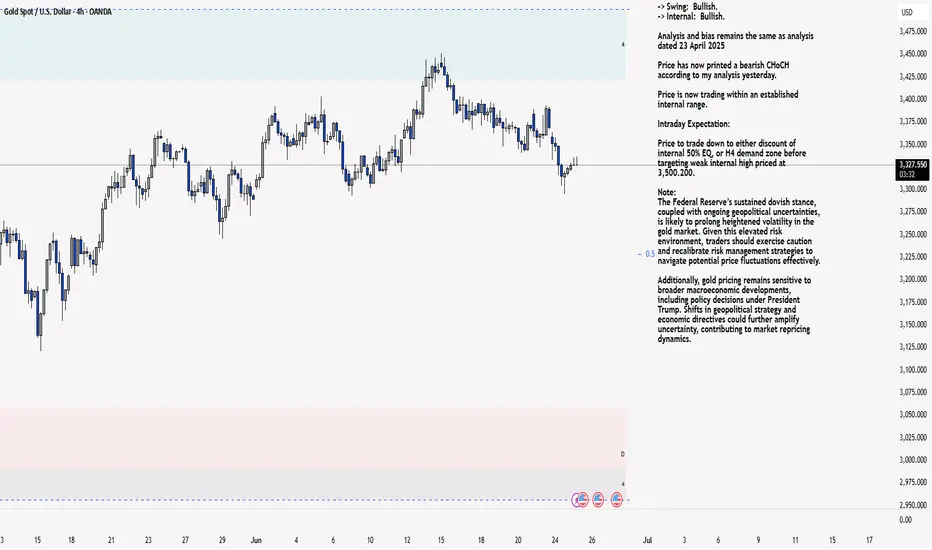
XAU/USD 25 June 2025 Intraday AnalysisH4 Analysis:
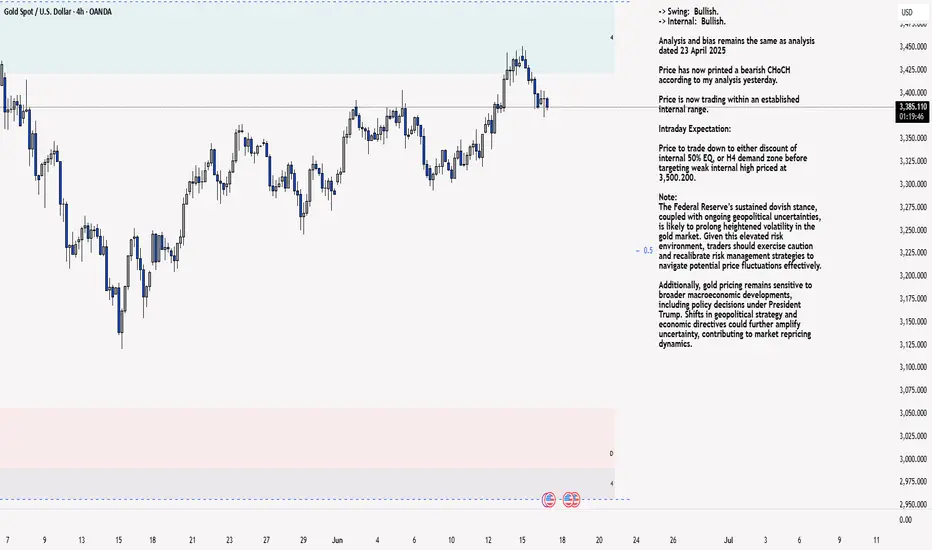
-> Swing: Bullish.
-> Internal: Bullish.
Analysis and bias remains the same as analysis dated 23 April 2025
Price has now printed a bearish CHoCH according to my analysis yesterday.
Price is now trading within an established internal range.
Intraday Expectation:
Price to trade down to either discount of internal 50% EQ, or H4 demand zone before targeting weak internal high priced at 3,500.200.
Note:
The Federal Reserve’s sustained dovish stance, coupled with ongoing geopolitical uncertainties, is likely to prolong heightened volatility in the gold market. Given this elevated risk environment, traders should exercise caution and recalibrate risk management strategies to navigate potential price fluctuations effectively.
Additionally, gold pricing remains sensitive to broader macroeconomic developments, including policy decisions under President Trump. Shifts in geopolitical strategy and economic directives could further amplify uncertainty, contributing to market repricing dynamics.
H4 Chart:
M15 Analysis:
-> Swing: Bullish.
-> Internal: Bullish.
Following previous high, and printing of bearish CHoCH, price has pulled back to an M15 supply zone, where we are currently seeing a reaction. Therefore, I shall now confirm internal high.
Price is now trading within an established internal range.
The remainder of my analysis shall remain the same as analysis dated 13 June 2025, apart from target price.
As per my analysis dated 22 May 2025 whereby I mentioned price can be seen to be reacting at discount of 50% EQ on H4 timeframe, therefore, it is a viable alternative that price could potentially print a bullish iBOS on M15 timeframe despite internal structure being bearish.
Price has printed a bullish iBOS followed by a bearish CHoCH, which indicates, but does not confirm, bearish pullback phase initiation. I will however continue to monitor, with respect to depth of pullback.
Intraday Expectation:
Price to continue bearish, react at either M15 supply zone, or discount of 50% internal EQ before targeting weak internal high priced at 3,451.375.
Note:
Gold remains highly volatile amid the Federal Reserve's continued dovish stance, persistent and escalating geopolitical uncertainties. Traders should implement robust risk management strategies and remain vigilant, as price swings may become more pronounced in this elevated volatility environment.
Additionally, President Trump’s recent tariff announcements are expected to further amplify market turbulence, potentially triggering sharp price fluctuations and whipsaws.
M15 Chart:
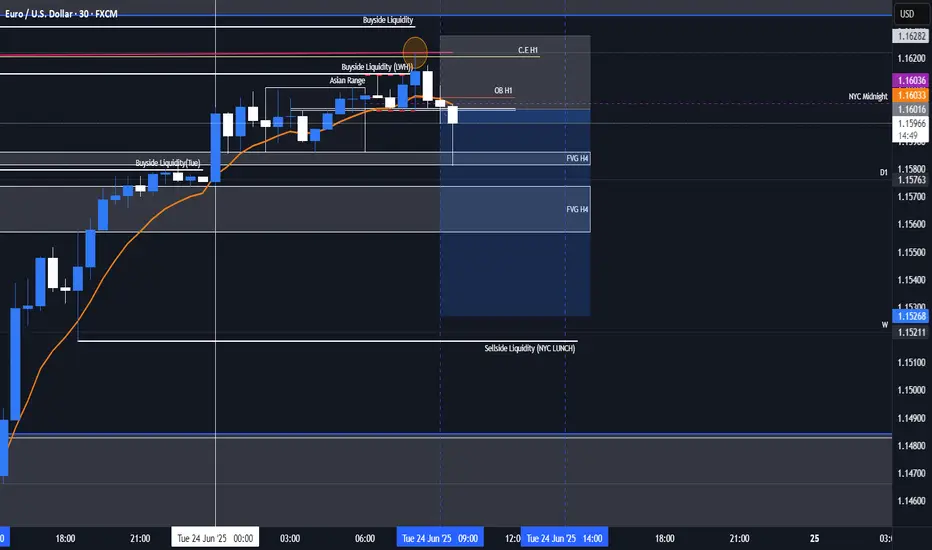
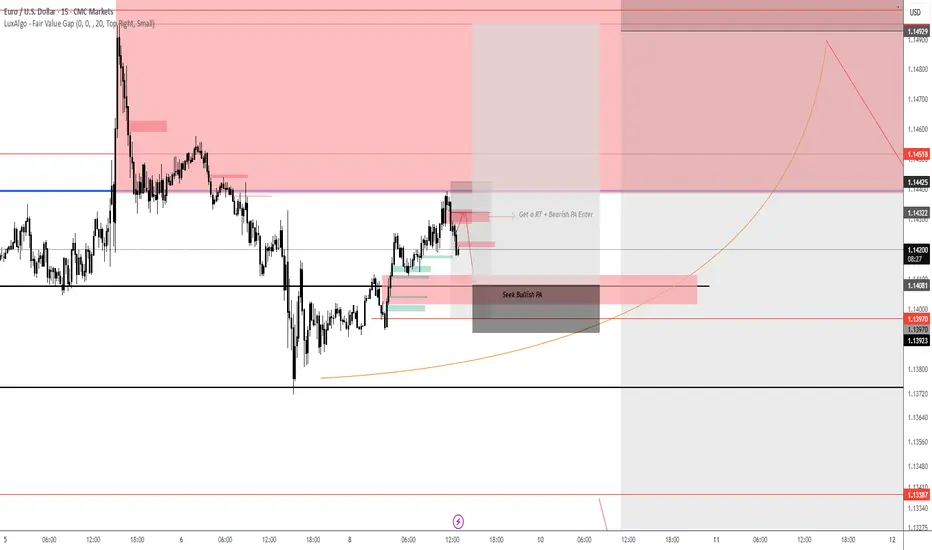
EURUSD Intra-day ShortEURUSD is in a long-term pivot to go short but the market is still in a accumulation phase of collecting orders and so we are still not in the position yet to commit to longer targets. We are looking at short term draw on liquidity like yesterday's NYC session and are accounting for a possible accumulation there after to the upside potentially.
XAU/USD 17 June 2025 Intraday AnalysisH4 Analysis:
-> Swing: Bullish.
-> Internal: Bullish.
Analysis and bias remains the same as analysis dated 23 April 2025
Price has now printed a bearish CHoCH according to my analysis yesterday.
Price is now trading within an established internal range.
Intraday Expectation:
Price to trade down to either discount of internal 50% EQ, or H4 demand zone before targeting weak internal high priced at 3,500.200.
Note:
The Federal Reserve’s sustained dovish stance, coupled with ongoing geopolitical uncertainties, is likely to prolong heightened volatility in the gold market. Given this elevated risk environment, traders should exercise caution and recalibrate risk management strategies to navigate potential price fluctuations effectively.
Additionally, gold pricing remains sensitive to broader macroeconomic developments, including policy decisions under President Trump. Shifts in geopolitical strategy and economic directives could further amplify uncertainty, contributing to market repricing dynamics.
H4 Chart:
M15 Analysis:
-> Swing: Bullish.
-> Internal: Bullish.
Following previous high, and printing of bearish CHoCH, price has pulled back to an M15 supply zone, where we are currently seeing a reaction. Therefore, I shall now confirm internal high.
Price is now trading within an established internal range.
The remainder of my analysis shall remain the same as analysis dated 13 June 2025, apart from target price.
As per my analysis dated 22 May 2025 whereby I mentioned price can be seen to be reacting at discount of 50% EQ on H4 timeframe, therefore, it is a viable alternative that price could potentially print a bullish iBOS on M15 timeframe despite internal structure being bearish.
Price has printed a bullish iBOS followed by a bearish CHoCH, which indicates, but does not confirm, bearish pullback phase initiation. I will however continue to monitor, with respect to depth of pullback.
Intraday Expectation:
Price to continue bearish, react at either M15 supply zone, or discount of 50% internal EQ before targeting weak internal high priced at 3,451.375.
Note:
Gold remains highly volatile amid the Federal Reserve's continued dovish stance, persistent and escalating geopolitical uncertainties. Traders should implement robust risk management strategies and remain vigilant, as price swings may become more pronounced in this elevated volatility environment.
Additionally, President Trump’s recent tariff announcements are expected to further amplify market turbulence, potentially triggering sharp price fluctuations and whipsaws.
M15 Chart:
EURUSD Interim Short Active, Looking for the LongInterim short active from our analysis posted last night, rejected off the lower end of the supply zone highlighted. Looking for the trade to trade down to a good Demand level to then take this trade up to the higher levels of the supply zone. Targeting the 1.1500 region. This will be all dependent on price action. If price moves to plan and 1.1500 is achieved we then can look for the original short position highlighted in last nights analysis.
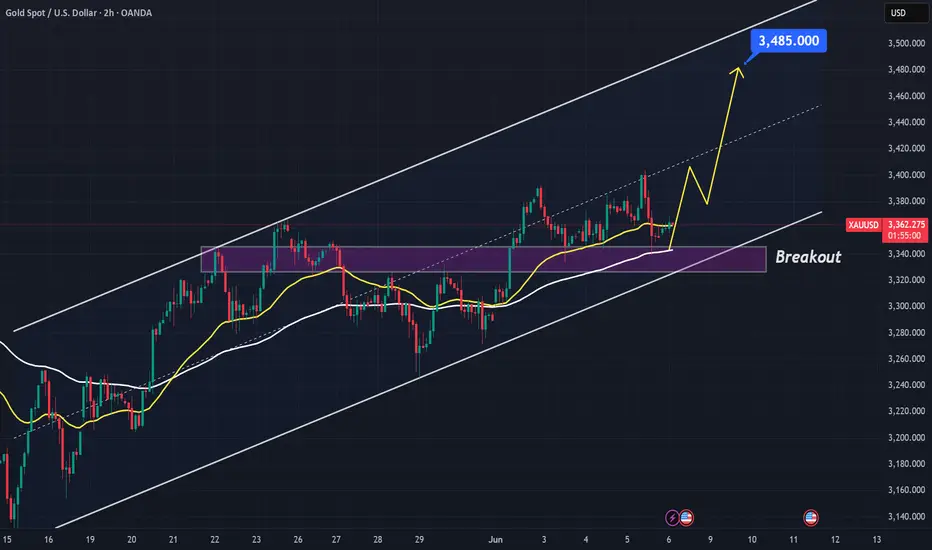
Gold Update – Will Buyers Drive It to 3,485 USD?Great to see all traders again in today’s gold price discussion at the end of the trading session. LyngridTrading here!
Yesterday, gold dropped sharply, with the metal falling by 600 pips during the US session. However, by this morning, it quickly regained its upward momentum, supported by buying pressure around the 3,340 USD support zone.
Specifically, gold regained its momentum after the latest data on the US labor market was just released, showing that the number of initial state unemployment claims rose to 247,000 (seasonally adjusted) by the end of May 2025, according to the announcement from the U.S. Department of Labor. This figure is higher than expected, reflecting a weakening US labor market, which has increased expectations that the Fed will soon cut interest rates to support the economy.
From a technical perspective, as previously analyzed, gold holds a strong short-term technical advantage from the support zone around 3,340 USD. If buying pressure continues, there will be nothing stopping it from rising to 3,485 USD, in line with the idea scheduled at the same time yesterday.
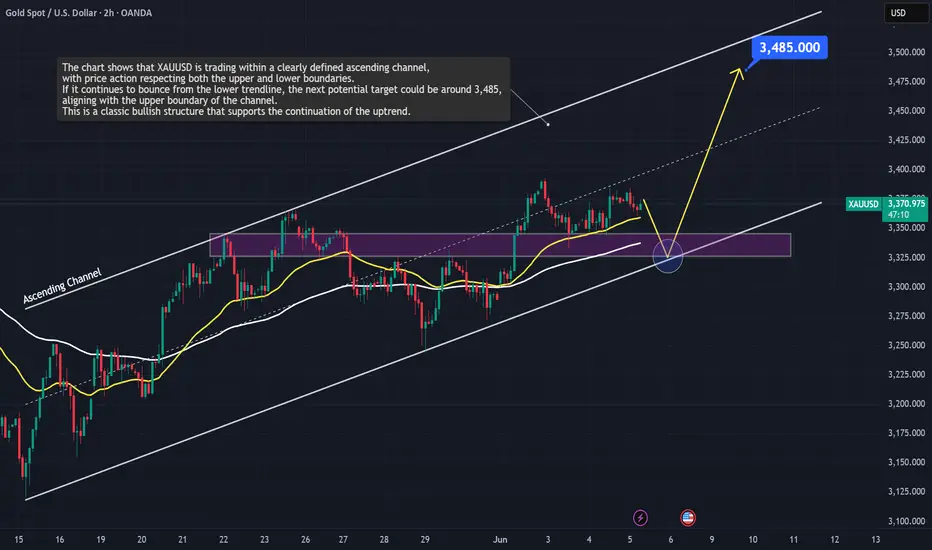
XAUUSD: Bullish Structure Still Intact?Dear friends,
To begin this post, I want you to understand why I want to connect with the global TradingView community. Simply put, I want to share the value I have and listen to more perspectives from all of you. This helps build a stronger, more united community.
And what about you. What do you think of OANDA:XAUUSD hovering around 3,370 USD?
Let’s explore it together!
OANDA:XAUUSD is moving within a very clear ascending channel, with price action consistently respecting both the upper and lower boundaries. This indicates that the bullish structure is still being maintained and the buyers remain in control. The recent upward momentum further reinforces the belief that this trend could continue.
The price is currently approaching a key support zone, marked by the lower boundary of the channel and a previous demand area. If this zone holds, it could offer a strong re-entry opportunity for buyers. The projected bullish target is 3,485 USD, which aligns with the upper boundary of the channel and represents a reasonable upside objective. This is the area I will closely monitor to find a trend-following buy entry, as long as bullish momentum remains intact.
Of course, I do not dismiss the opposite scenario. Failure to hold this dynamic support may suggest that bullish momentum is weakening and could shift the short-term trend to neutral or bearish.
Let me know your thoughts or if you see it differently!
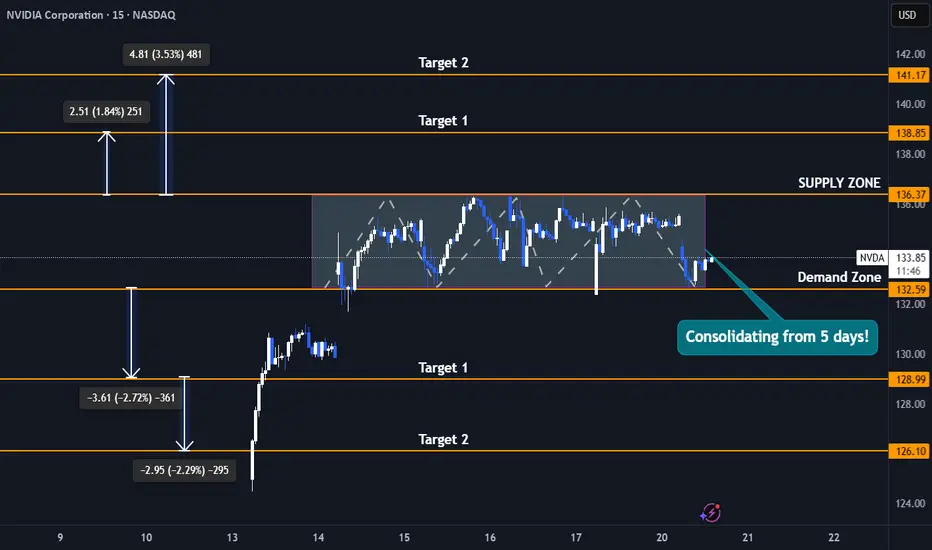
Nvidia Stock 5-Day Consolidation Breakout - Uptrend or Pullback?Trade Duration: Intraday
Trade Type: Breakout
- Nvidia is currently consolidating tightly between $132 and $136, forming a narrow range that reflects a balance between buyers and sellers unwilling to relinquish control. This range-bound action signals indecision, but it won’t last indefinitely.
- Typically, the longer the consolidation, the more significant the subsequent move. As new participants enter the market, a breakout—whether upward or downward—can trigger a powerful surge.
- This move is often amplified by breakout buyers joining in and stop-loss orders of trapped traders being triggered, creating an ideal setup for an intraday breakout trade.
- I plan to initiate either a buy or sell position depending on the breakout direction, capitalizing on the momentum generated by this tight consolidation phase.
Upside Targets : 138$ and 141$
Downside Targets : 128$ and 126$
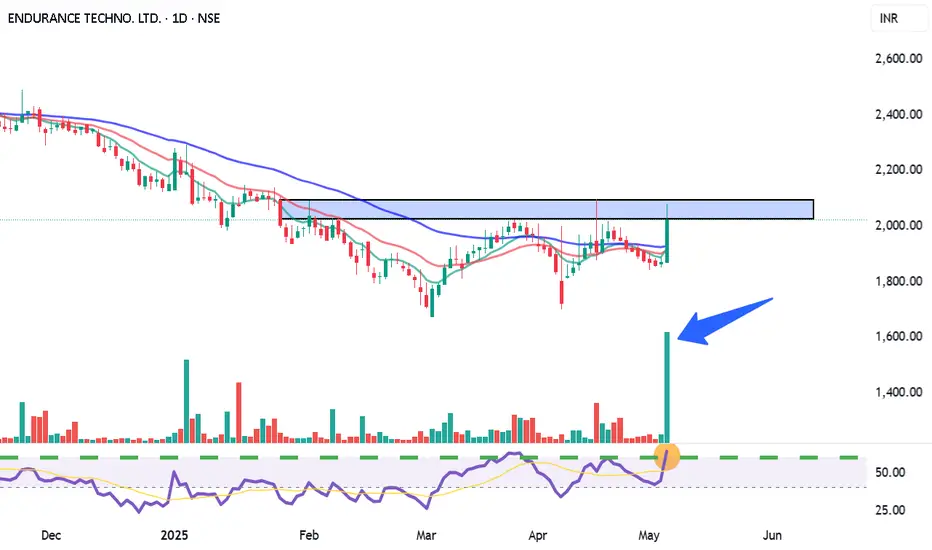
ENDURANCE – Breakout from Supply Zone | Target ₹2136 ⚙️ ENDURANCE TECH LTD (NSE:ENDURANCE)
Time Frame: 15min / 1 Hour
📊 Trade Type: Positional / Intraday Momentum
📌 Buy Zone: ₹2042 (Above supply zone breakout)
🎯 Target 1: ₹2136
🎯 Target 2: ₹2287
🛑 Stop Loss: ₹1915
📈 CMP: ₹2022.60
📌 Chart Insights:
✅ Strong volume breakout from horizontal resistance
✅ Cleared EMA 9/13/26 crossover
✅ RSI > 60 indicates bullish momentum
✅ Bollinger Band breakout (BB %B > 1.00)
✅ Breaking above pivot R2 zone (₹2042) opens room to R3
⚠️ Strategy:
Enter on confirmation above ₹2042 with volume support on 15min or 1H timeframe.
Stop loss below breakout candle or EMA cluster around ₹1915.
Trailing stop as it approaches targets.
For Education Purposes Only
EICHERMOT (NSE) – Bullish Setup on 15min & 1H🔑 Trade Plan:
📥 Buy Above: ₹5485 (above current resistance & candle body highs)
🎯 Targets:
T1: ₹5527 (Pivot R1)
T2: ₹5555
🛡️ Stop Loss: ₹5380 (below 13 EMA & Supertrend support)
📊 Technical Signals:
RSI: 58.08 – Bullish momentum, still room to run
%B (BB): 0.77 – Close to breakout from upper band
EMA Crossover: 9 EMA > 13 EMA – Short-term bullish crossover confirmed
Supertrend: Support at ₹5322, aligning with bullish reversal
Volume: Spike during recent green candles signals strong buying interest
⚙️ Strategy Notes:
Use 15min chart for entry timing post breakout
Tighten SL to cost after T1 hits
Ideal for short-term intraday/swing traders
For Education Purposes Only

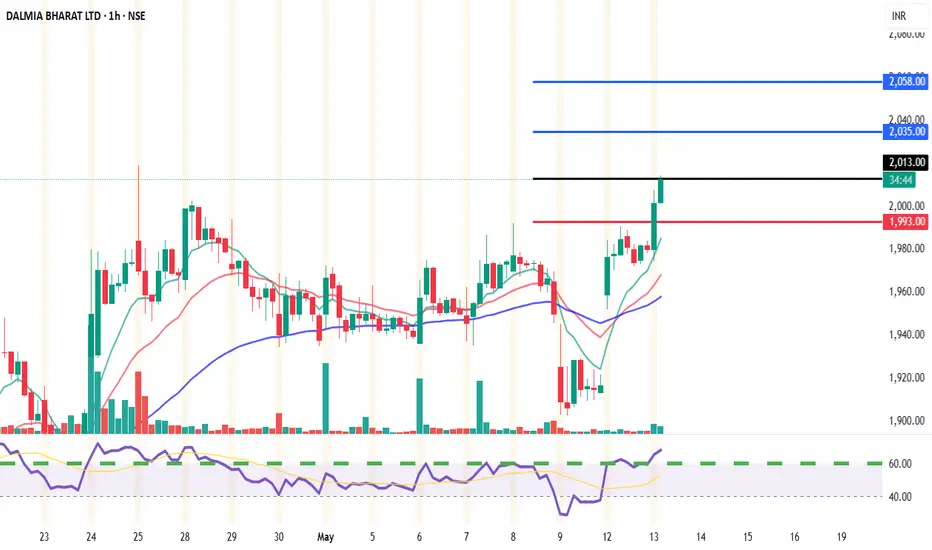
Trade Setup: DALMIA BHARAT (NSE)📊 Chart Summary:
Current Price: ₹2,009
EMA Support: 9 EMA (₹2,003.57) | 26 EMA (₹1,993.31)
Volume: Increasing with bullish candles
Price Action: Sustaining above key pivot and EMA levels
Momentum: Strong with minor consolidation
✅ Intraday Buy Setup (15min & 1h)
Buy Above: ₹2,013.50 (Break of intraday resistance zone)
Targets:
🎯 Target 1: ₹2,035.80 (Pivot R2)
🎯 Target 2: ₹2,058.30 (Pivot R3)
Stop Loss: ₹1,993 (below 26 EMA and pivot zone)
Risk:Reward: ~1:2 or better
For Education Purposes Only
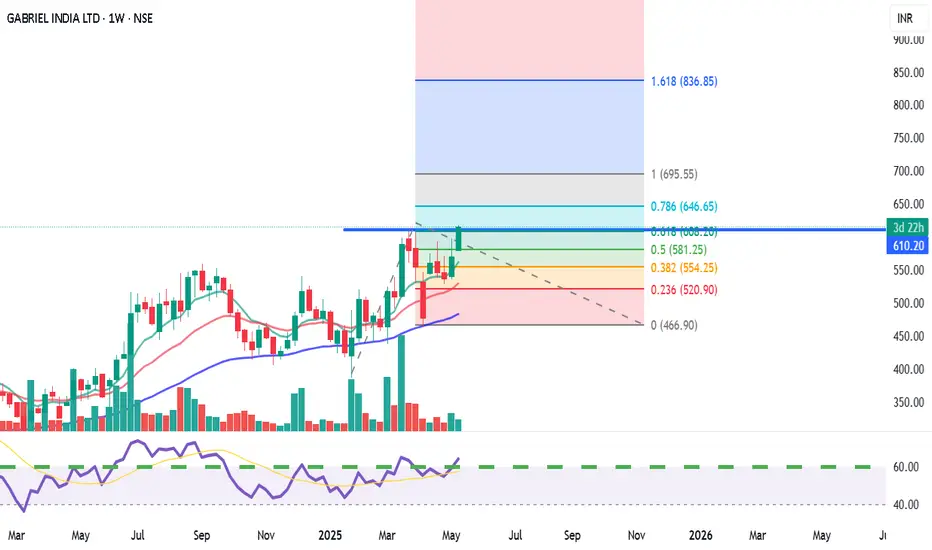
Gabriel India Ltd (GABRIEL) – Weekly Resistance Breakout Setup✅ Trade Idea:
Price has reclaimed the 0.618 retracement at ₹608.25
Breakout above the ₹612 horizontal level (weekly closing basis)
Volume is rising and RSI shows strong uptrend
💰 Buy Zone:
Entry: ₹610 – ₹613
(preferably above ₹612 on strong 15min or 1H candle close)
🎯 Targets:
T1: ₹630 (previous minor supply zone)
T2: ₹646.65 (Fib 0.786 level)
T3: ₹695.55 (Fib 1.0 extension)
T4: ₹836.85 (1.618 extension for swing positional)
🛑 Stop Loss:
Intraday SL: ₹598 (below 9 EMA on 1H)
Swing SL: ₹581 (Fib 0.5 retracement support)
🔁 Strategy:
Wait for confirmation via volume + RSI > 60
Trail SL to ₹610 once ₹630 is hit
Lock partial profit near ₹646 if market sentiment weakens
For Education Purposes Only