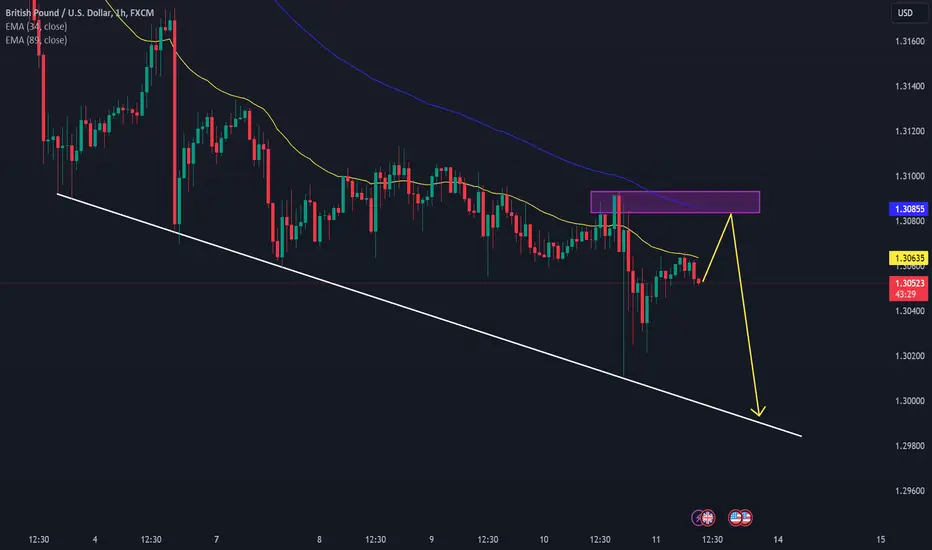
GBPUSD: The sellers still have the upper hand.Currently, GBPUSD is moving around 1.305 at the beginning of the weekend trading session with the weakness continuing since the beginning of the week.
Although there is a recovery, it is only short-term and is a trend correction. With a strong reversal from the EMA 34, 89, this currency pair is still heavily influenced by the technical selling sentiment.
In the short term, we expect to continue to prioritize selling with the profit-taking target right at the limit of the downtrend line marked on the chart.
Intradaytrade
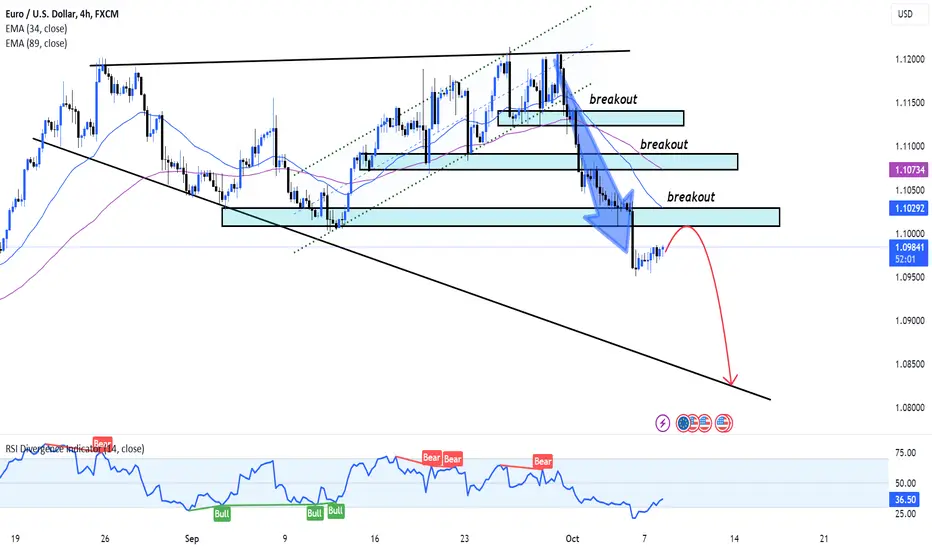
EURUSD should buy or sell?Hello everyone!
EURUSD is currently following my previous prediction as it is in a deep decline, hovering at 1.098 and breaking out of the support level of 1.101.
With 3 deep declines and breaking out of 3 support levels, sellers continue to profit. Therefore, I expect it to continue moving down at least to the lower price channel, as indicated by the flat EMA for shorting.
Happy trading and don't forget to share your opinions in the comments section!
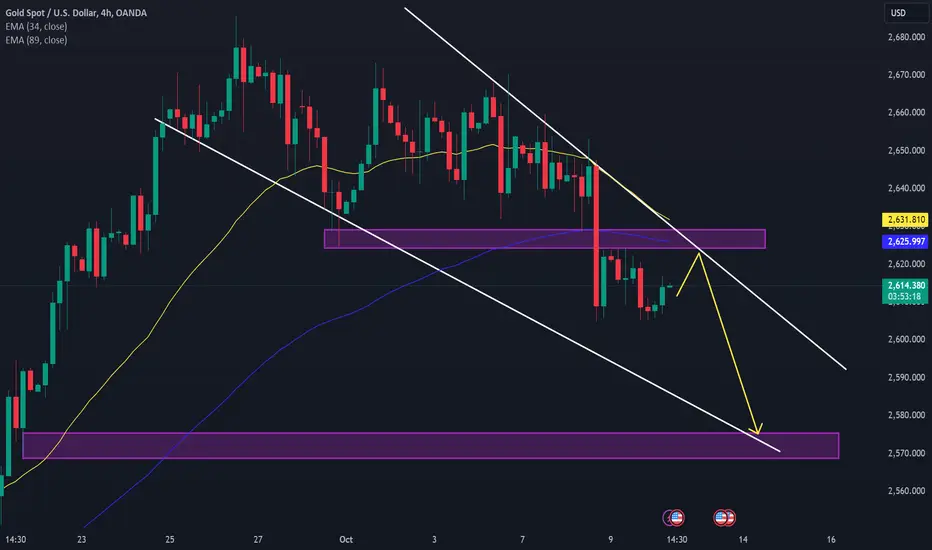
XAUUSD: Continues to fall furtherHello dear friends, nice to meet you in today's gold price race!
Today, gold has not changed much, mainly fluctuating around the $2600 mark, and the downtrend is still dominant.
The metal is under pressure as the USD starts to regain strength. On the analytical chart, the price has dropped below the support level of $2625. The 4-hour chart shows the possibility of this downtrend continuing soon. With the acceptance of the falling wedge resistance and the reaction at the EMA 34 confirmed, we may not see any significant support until $2575.
How do you think gold will perform in the coming time?
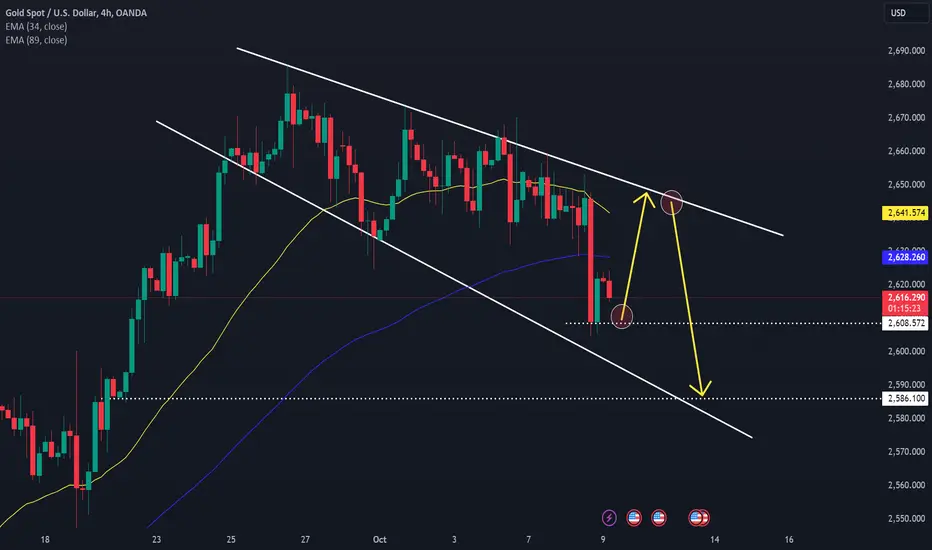
XAUUSD: The Downtrend Continues!Currently, we are witnessing a recovery attempt in gold after testing the psychological support level at $2,600. It is clear that sellers were unable to push the metal below this important level, as gold found new support at $2,605, showing signs of a steady recovery since yesterday.
Looking ahead, gold prices have paused their earlier declines in preparation for the Fed meeting on Wednesday. The US dollar has maintained its gains, supported by rising Treasury yields, amid geopolitical tensions in the Middle East and China’s woes. Meanwhile, gold appears to have stalled near the key support level at $2,630, with the daily RSI indicating room for upside.
However, on the 4-hour chart, the downtrend remains intact, with significant resistance around $2,650. Therefore, I still believe XAU/USD will continue to trade lower, with a potential target set at $2586.
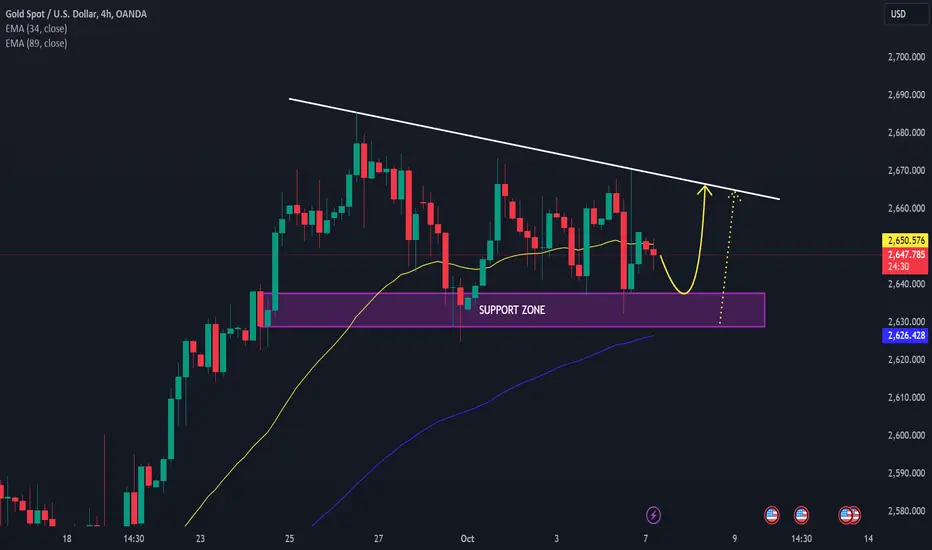
XAUUSD: Support Holds, Breakout Ahead?Looking at XauUSD's 4 -hour chart, we can see that the price is being blocked by the decreasing resistance line and there is no clear breakthrough through this level. EMA 34 (yellow) is currently acting as a short -term resistance close to the current price, while the EMA 89 (blue) continues to be below, supporting the price if the batch occurs sharply.
An important support area (purple area) has been determined from 2,630 to 2,645, this is where the price has reacted in previous times. This area can be a point to track the purchase signals if the price continues to decrease and touch this area.
Scenario 1: If the price continues to be resisted from EMA and the resistance line decreases, the price may check the support area again. There will be a possibility of a batch from here, creating opportunities for the buyer. This is supported by the potential "Double Bottom" model, which can be clearly seen in case the price check the support and maintain.
Scenario 2: If the price can break the resistance line above, especially when closing the candle above 2,652, this will be a strong signal for the continued trend of increasing and opening the potential to 2,670 or higher.
XAUUSD: Short!Hello all traders!
Double top pattern has formed on H1 chart as clearly setup
And now focus on Short targeting expected target $2624.
Good luck!

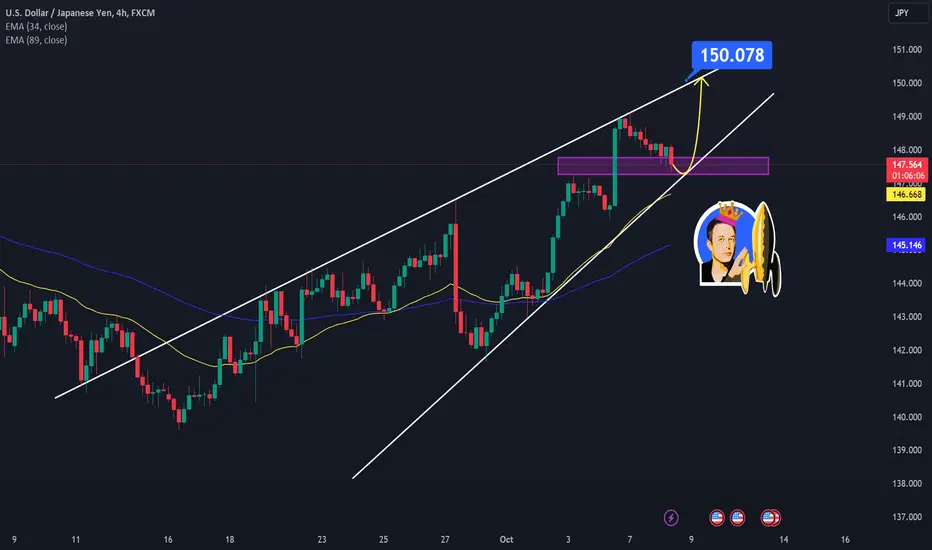
USDJPY Set to Surge Higher – Targeting 150.00?Dear traders!
USDJPY is currently maintaining a fairly steady uptrend, hovering around 147.64 despite a slight 0.34% adjustment downwards during the day. In my personal view, this correction is largely due to the pair encountering the upper boundary of the short-term rising channel. However, upon closer inspection, technical factors such as the rising wedge and the EMA 34.89 remain strong, indicating that the appeal of this pair is far from over.
Considering these factors, Ben’s personal opinion is that USDJPY will likely continue its upward momentum, with a potential target around 150.00.
Wishing you all successful and prosperous trading!
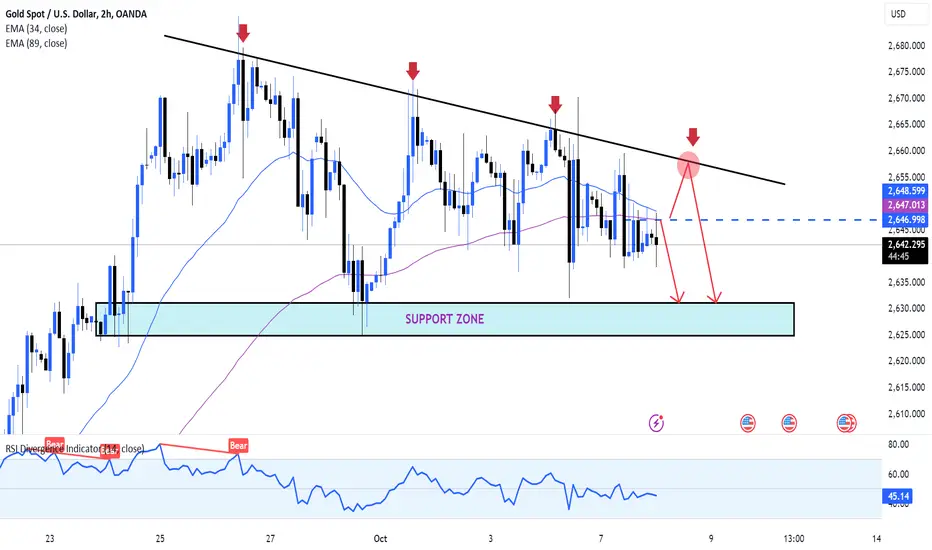
Gold Price Today: Struggling to Break Free!At the start of Tuesday’s trading session, gold (XAUUSD) is hovering around $2,646, with a modest increase of 0.17% on the day. However, the precious metal lacks strong momentum, as the U.S. jobs report exceeded expectations, dampening hopes of a significant rate cut by the Federal Reserve. This has driven up U.S. Treasury yields and strengthened the USD, putting downward pressure on gold prices.
From both a fundamental and technical perspective, a further decline in gold could be expected, especially if it reacts to the trendline or resistance levels. A selling strategy could be considered if sellers capitalize on the price correction influenced by the 34 and 89 EMA indicators.
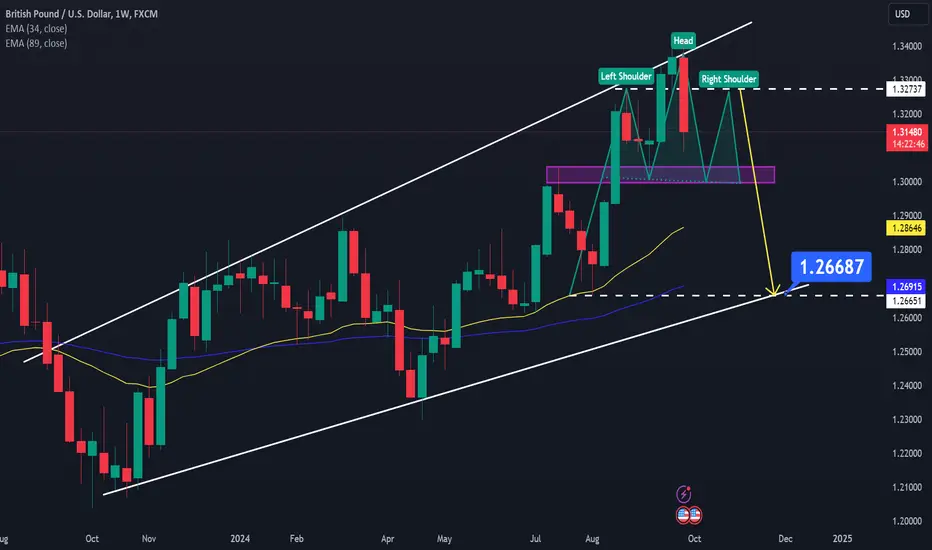
GBP/USD: Bullish Continuation or Reversal?Today, GBP/USD continues its upward trend and is trading around 1.312 by the end of the session. Overall, the pair is approaching a key support level, and the EMA 34 and EMA 89 lines have not yet reversed, indicating that bullish momentum may still be in play. The recent price pullback seems more like a test rather than a confirmed reversal.
However, we must not rule out the possibility of breaking support, especially if the Head and Shoulders pattern completes as projected. The 1.3261 resistance level is currently being actively defended by sellers. Should a break occur, GBP/USD will present a profitable opportunity for short sellers, with the price potentially heading towards the lower boundary of the ascending channel once again.
This is a critical moment to closely monitor the market. Whether it's a continuation of the uptrend or a support break, make sure you're ready for both scenarios.
Good luck with your trading!
USDJPY: Back to Uptrend?Hello everyone,
Currently, USDJPY continues its strong upward momentum, trading steadily around the high level of 146.70, up 0.19% on the day.
From a technical analysis perspective, USDJPY is forming an Elliott Wave 5 pattern, with the first three waves already completed (currently in wave 4). Ben expects the support level around 145.77, aligning with the 0.618 Fibonacci retracement of the previous upward move, to hold, with the next target being the psychological level of 149.22.
What about you? Where do you think USDJPY will gain strength next? Share your thoughts!

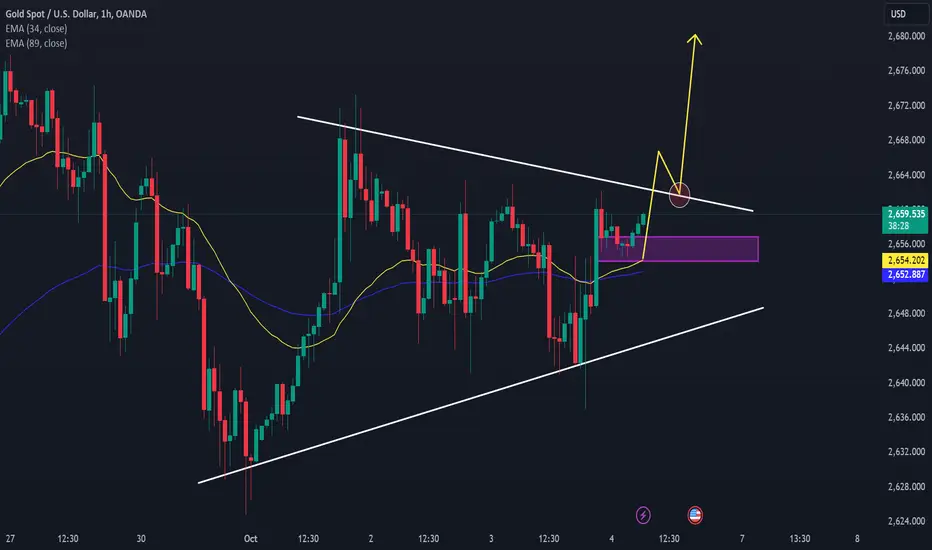
XAUUSD: Positive Technical OutlookHello everyone!
Currently, gold is hovering around the $2,658 mark in early trading, showing a slight recovery after its price correction from $2,640 late yesterday.
On the technical chart, gold continues to maintain a strong uptrend within a parallel wedge pattern, with the convergence of the 34 and 89 EMAs signaling further upward potential. A solid support level is also clearly established, reinforcing this recovery trend.
Given these factors, we can confidently expect gold to break out of its current sideways phase, likely surpassing the upper boundary of the wedge and pushing higher in the near future. Therefore, the preferred strategy right now is to *buy* – seize this opportunity, my friends!
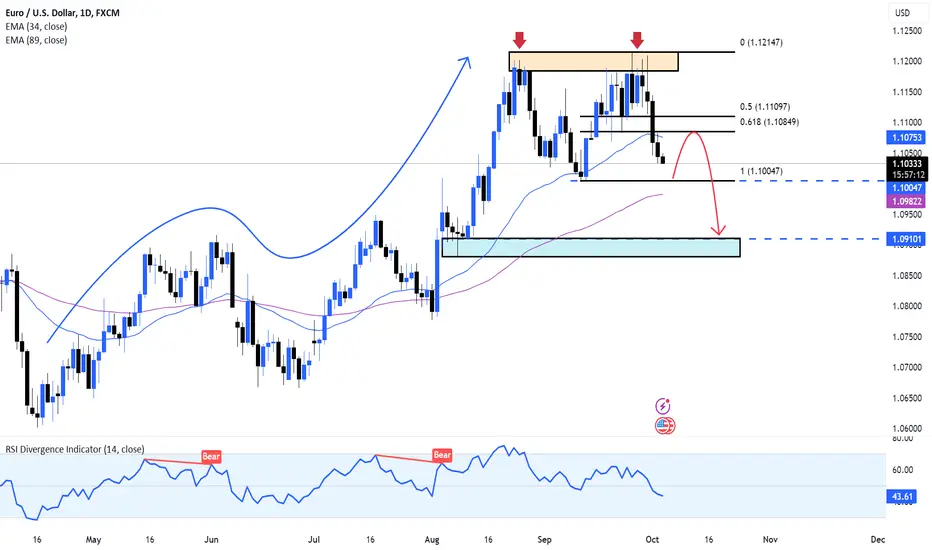
EURUSD: Continuously searching for new bottoms!Dear Investors,
Today, let's dive into the EURUSD pair analysis with Conan!
In recent days, EURUSD has not had many big fluctuations, but still maintains the trend of finding new bottoms through red candles. Technically, the double top pattern has been confirmed and the price has broken the 1.1100 level, opening the possibility of a deeper decline. However, to break the strong support at 1.1000, the sellers need confirmation from the new resistance zone at 1.1085 - a level that matches the 0.618 Fibonacci level in our forecast. Potential profit-taking levels that investors can consider are 1.1000 and 1.0900 respectively.
What do you think about this analysis? Share your views!
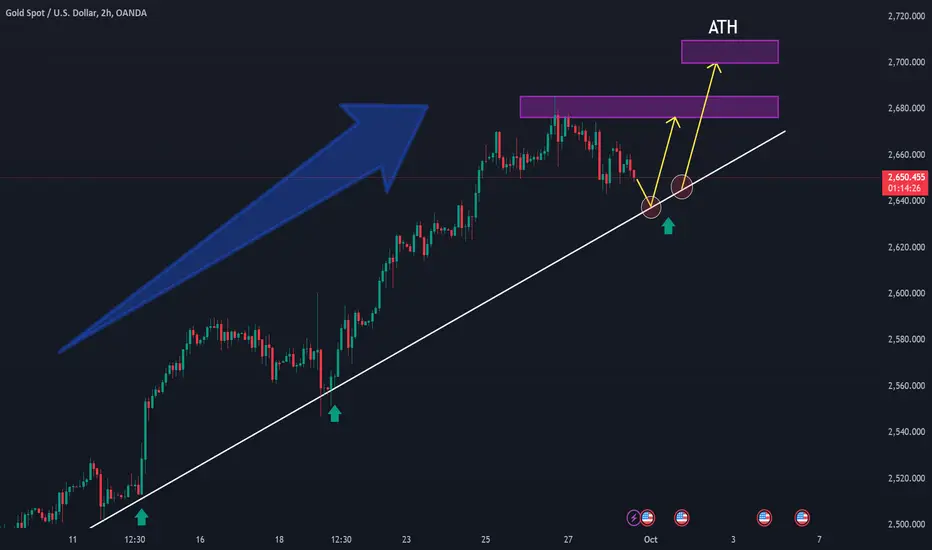
Trading strategy !Hello, dear traders! In my view, the recent rally in gold is mainly due to expectations of lower US interest rates and the growing demand for safe havens amid geopolitical uncertainty. Currently, gold is trading around $2,660, down -0.14% on the day. However, I believe that the overall bullish trend remains intact.
Looking at the 4-hour chart, I can see that XAUUSD is holding above the rising trendline and the 34.89 EMA. This reinforces the idea that gold prices could continue to rise. If gold breaks above the all-time high of $2,685, this could signal further upside momentum, targeting round numbers like $2,700 and even the psychological level of $2,750.
What do you think about the trend of XAUUSD? Do you see more room for it to break higher? Let's discuss!

Gold price today is still supported to increase !Hello everyone! What do you expect from the gold price today, let's discuss today's strategy?
Yesterday XAUUSD did not change much compared to yesterday's trading session, fluctuating around $2656, down 0.1% due to lack of new bullish momentum.
Although it is under some short-term pressure due to the strength of the USD, the situation in the Middle East is gradually strengthening, promoting the demand for safe-haven gold.
Besides, there is still positive potential for further appreciation of XAUUSD, as it is still in an unbroken upward channel. A break of $2660 will not see significant resistance until $2670.
What do you think?

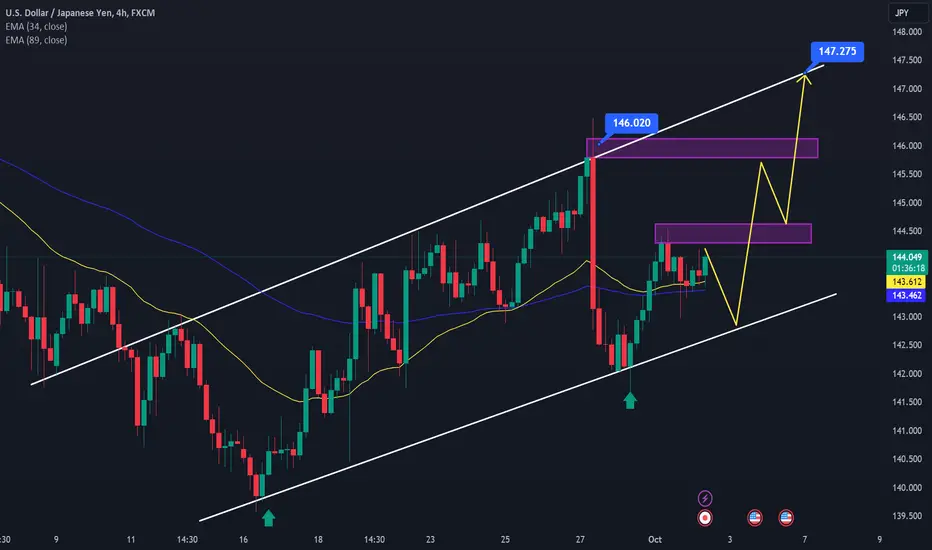
USDJPY: Strong recovery from 143.00Ben, hello everyone! Let's dive into today's USDJPY analysis with Ben!
USDJPY is in an uptrend today, currently trading at 143.95, up 0.29% on the day.
With USDJPY continuing to trade steadily at this positive level, the resistance level of 144.50 will be set as a short-term target, before potentially reacting and testing the price level of 143.00, forming a trend line and using it as strong support for further increases in the medium and long term. The current expected price levels are at the round level of 145.00 and 146.00 respectively and even the upper trend channel limit at 147.00.
Wishing you all profitable trading!
XAUUSD: 500 pip trading strategy!Dear friends, XAUUSD continues to gain some recovery momentum as it has reclaimed 2625, but the main trend and the long-term trend are still moving in a bearish direction from the head and shoulders perspective.
In the short term, the price is approaching 2650 and XAUUSD is approaching the neckline limit. And the bearish pattern is expected to continue to strengthen in the near term, as shown by the unchanged 34.89 EMA, the target is the support levels of 2605 - 2600.
And you, how do you think XAUUSD will move in today's trading day!

Gold price may break through to 2700Gold extended its decline after hitting a record high, currently trading around $2,650. However, the precious metal remains in an uptrend on a short, medium and long-term basis, and since the basic principle of technical analysis is that “the trend is your friend”, the odds are in favor of further upside for the yellow metal.
Support levels to watch are: 2,650 - 2,644
Resistance levels to watch are: 2,670 - 2,680 - 2,700
EURUSD 1.11305 -0.02% SHORT MULTI TIME-FRAME ANALYSIS + DXYHELLO TRADERS
Hope everyone is doing great
📌 A look at The EURUSD At the close of ASIA GOING INTO THE LONDON, TO NY PM SESSION
* With a bullish run into Monday CLOSE (PO3) today will be looking for some retracement.
* looking at the daily last week Friday failed to take high which is a sign of weakness on EU.
* Looking at the IFVG below as targets as well.
* even though the -OB is violated looking for a retracement.
* on the 4H looking for a bullish open to take ASIA high LQ.
* PO3
* Push higher before going for lower structures.
* looking for an aggressive move above out of the range to sweep.
* and aggressive in.
* this where I would look for entries short.
* Looking for the take of that ERL.
* with two possible OTE ( ASIA HIGHS, AND LONG TERM HIGH) , EXECUTION IS BASED ON RR & RISK MANAGEMENT.
* DXY 4H
- Will wait for the DXY to take ASIA lows and trade back in the range as a confirmation as well...
* BASED on the price action served next session...
* We will see what does the market dish.
🤷♂️😉🐻📉🐮📈
HOPE YOU ENJOYED THIS OUT LOOK, SHARE YOUR PLAN BELOW,🚀 & LETS TAKE SOME WINS THIS WEEK.
SEE YOU ON THE CHARTS.
IF THIS IDEA ASSISTS IN ANY WAY OR IF YOU ENJOYED THIS ONE
SMASH THAT 🚀 & LEAVE A COMMENT.
ALWAYS APPRECIATED
____________________________________________________________________________________________________________________
Kindly follow your entry rules on entries & stops. |* Some of The idea's may be predictive yet are not financial advice or signals. | *Trading plans can change at anytime reactive to the market. | * Many stars must align with the plan before executing the trade, kindly follow your rules & RISK MANAGEMENT.
_____________________________________________________________________________________________________________________
|
* ENTRY & SL -KINDLY FOLLOW YOUR RULES | * RISK-MANAGEMENT | *PERIOD - I TAKE MY TRADES ON A INTRA DAY SESSIONS BASIS THIS IS NOT FINACIAL ADVICE TO EXCECUTE ❤
LOVELY TRADING WEEK TO YOU!

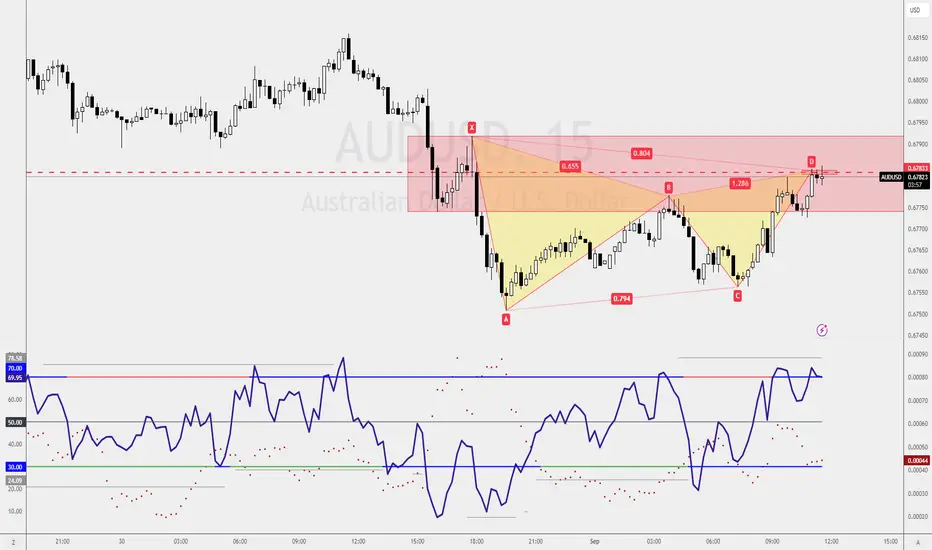
AUDUSD M15, Intraday TradeI just shorted AUDCAD, Bearish 5-0 Pattern on the 1-hourly chart, and now AUDUSD on this Bearish Gartley Pattern.
It seems like the Australian dollar may have a bearish movement for the next couple of hours.
If you have been following, you should know I don't usually trade on the M15 chart, but this one has an upsize trade component.
What is an upsize trade?
An upsize trade is a trading setup that allows me to stretch my final target to the next pattern completion. It's a Trade Management skill that I've used for years.
Before using it, You must be very familiar with the product and strategy.
[INTRADAY] #BANKNIFTY PE & CE Levels(30/08/2024)Today will be gap up opening in banknifty. Expected opening near 51500 level. After opening if banknifty starts trading above 51550 level then possible strong upside rally of 400-500 point in index. 51950 will act as a resistance for today's session.

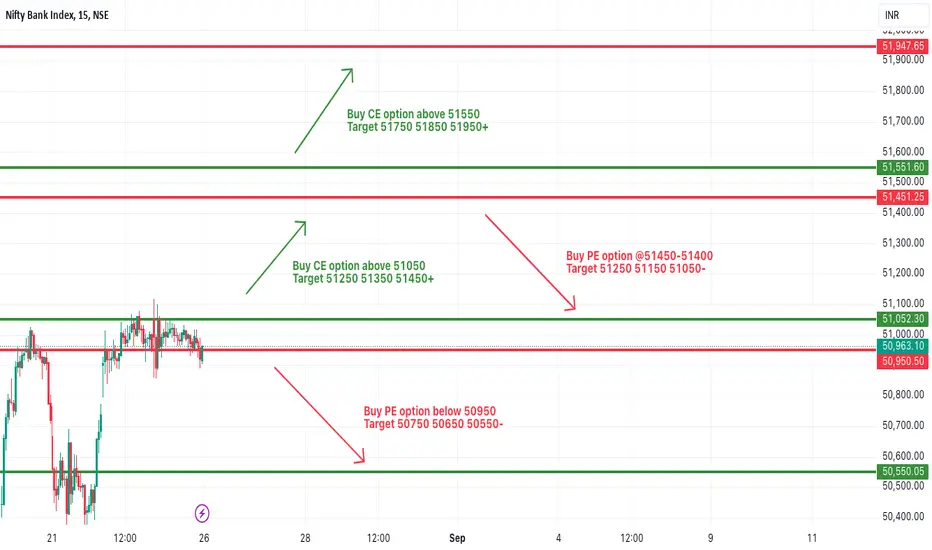
[INTRADAY] #BANKNIFTY PE & CE Levels(26/08/2024)🔔 Bank Nifty Update for Today:
📈 Gap-Up Opening Expected:
Key Level: 51050
Primary Upside Target: 51450+
Extended Upside Target: 51950+
Bank Nifty is anticipated to open with a gap up today. If the index sustains above the 51050 level after the opening, we can expect an upside rally reaching up to 51450 or higher. Should Bank Nifty break through the 51550 level, this rally could extend by another 400-500 points, potentially reaching 51950 or beyond.
📉 Watch for Downside Risks:
Critical Support Level: 50950
Major Downside Risk: Only expected if the index falls below 50950
🔄 Potential Resistance:
Resistance at 51450: There is a possibility that Bank Nifty might face resistance around the 51450 level during its upside rally.
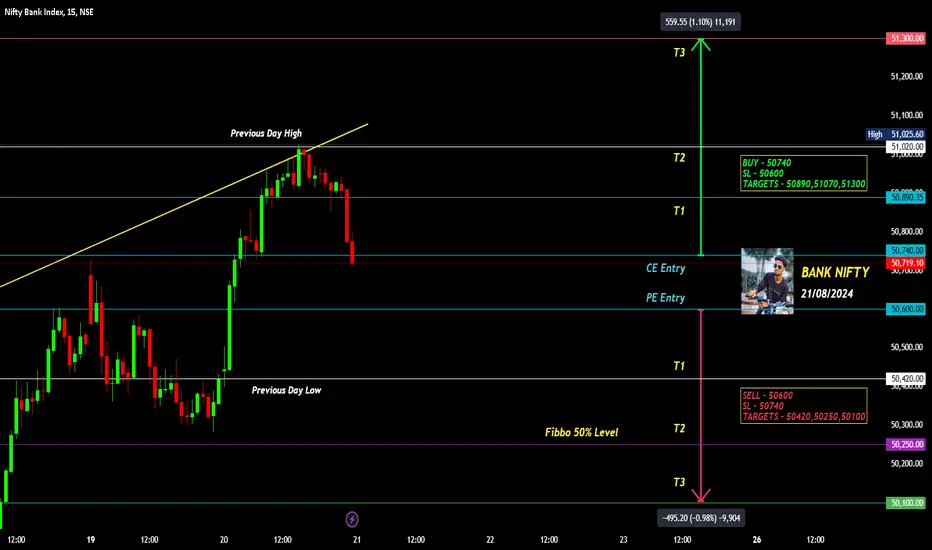
BANK NIFTY INTRADAY LEVELS 21/08/2024BUY ABOVE - 50740
SL - 50600
TARGETS - 50890,51070,51300
SELL BELOW - 50600
SL - 50740
TARGETS - 50420,50250,50100
NO TRADE ZONE - 50600 to 50740
Previous Day High - 51020
Previous Day Low - 50420
Based on price action major support & resistance's are here, the red lines acts as resistances, the green lines acts as supports. If the price breaks the support/resistance, it will move to the next support/resistance line. White lines indicates previous day high & low, high acts as a resistance & low acts as a support for next day.
Trendlines are also significant to price action. If the price is above/below the trendlines, can expect an UP/DOWN with aggressive move.
Please NOTE: this levels are for intraday trading only.
Disclaimer - All information on this page is for educational purposes only,
we are not SEBI Registered, Please consult a SEBI registered financial advisor for your financial matters before investing And taking any decision. We are not responsible for any profit/loss you made.
Request your support and engagement by liking and commenting & follow to provide encouragement
HAPPY TRADING 👍
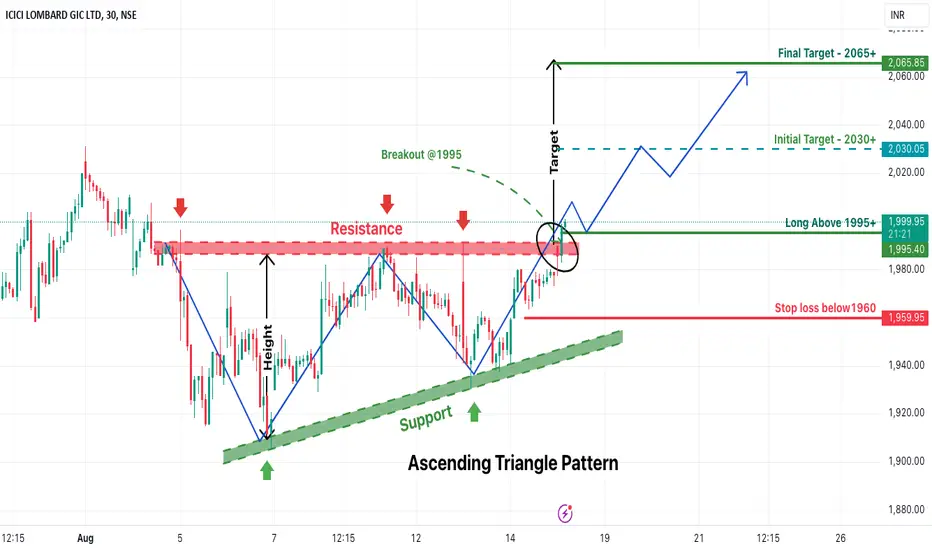
Ascending Triangle Pattern Breakout in ICICIGIICICI Lombard General Insurance (ICICIGI) Analysis – 30-Minute Timeframe
On the 30-minute timeframe, ICICI Lombard General Insurance (ICICIGI) has displayed a bullish breakout from an Ascending Triangle pattern, which is typically considered a bullish pattern indicating potential upward momentum. The breakout suggests a strong buying interest, with expectations of an upside rally in the stock.
Key Levels:
Entry Point: An entry opportunity is identified above the 1995 level, which acts as a confirmation of the breakout.
Stop Loss: To manage risk, a stop loss is recommended just below the 1960 level. This level serves as a crucial support, and breaking below it may invalidate the bullish setup.
Target Levels:
Intermediate Target: The first target for this trade is set at 2030, where partial profits could be booked.
Final Target: The final target is anticipated at 2065 or above, aligning with the expected continuation of the bullish trend post-breakout.