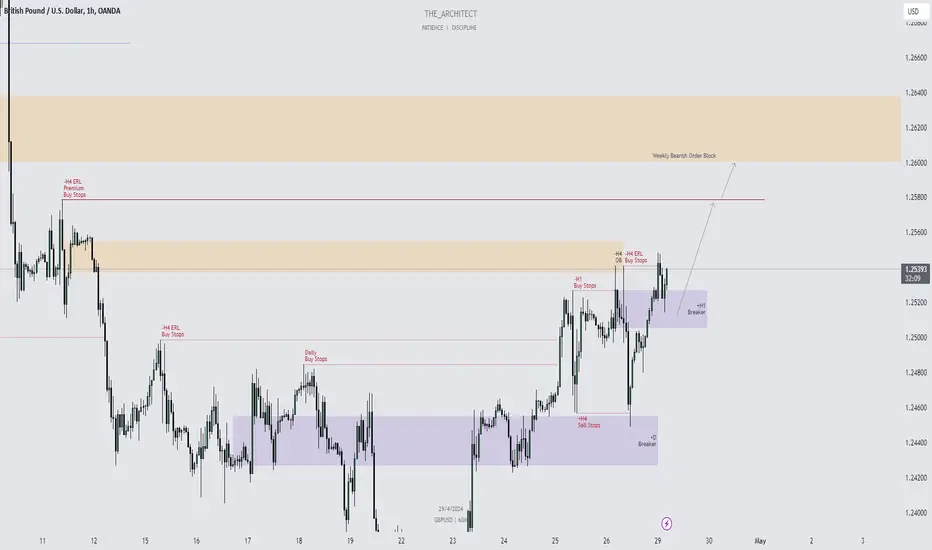
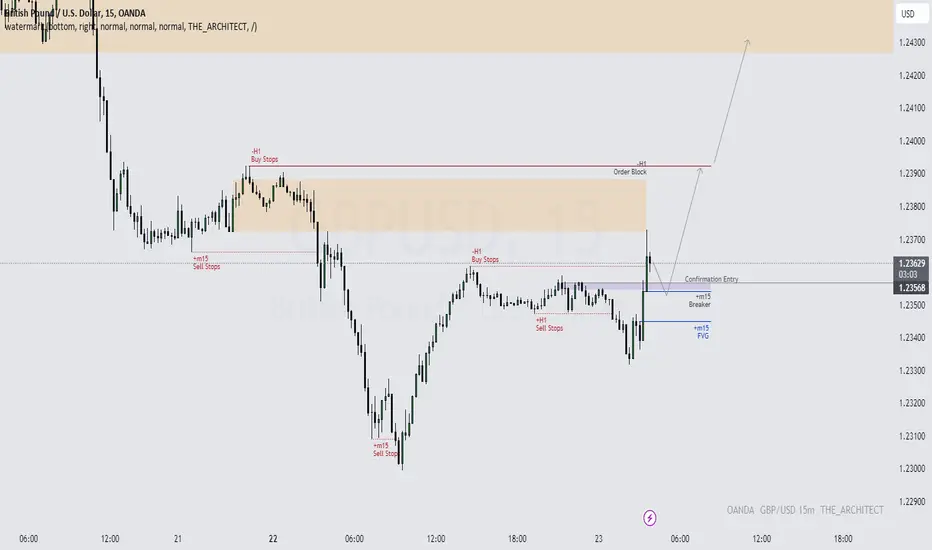
GBPUSD: Bullish Shifts & Strategic Objectives Ahead!Currently, GBPUSD demonstrates a temporary shift in bullish institutional order flow, targeting specific objectives. Over the past week, I've observed a draw towards the H4 premium buy stops, followed by a potential move towards the weekly bearish order block. While my overall sentiment on GBPUSD remains bearish on higher timeframes, I anticipate a bullish move towards these buy-side objectives before a potential bearish reversal. However, given the critical juncture, I remain open to adjustments in my analysis.
At the moment we are supporting a H1 bullish breaker, in which I am interested in looking to take a confirmation entry on.
Stay tuned for an upcoming weekly outlook video analysis.
Kind Regards,
The_Architect
Intradaytrade
Continuing Bullish Momentum: GBPUSD Buy Thesis Reinforced!Greetings Traders!
Yesterday, I provided an analysis highlighting potential buying opportunities, targeting key areas such as the Buy Stops and the weekly bearish order block, given the prevailing bullish institutional order flow. Today, we aim to continue this narrative by seeking further buying opportunities to reach these significant objectives.
Price action on the m15 timeframe has recently interacted with a Bullish order block, leading to a market structure shift (MSS). Currently, price has retraced to a m5 breaker, presenting an opportune moment to enter new buy positions. Additionally, there's a possibility of a brief downside movement to trigger sell stops before resuming the upward trajectory towards higher timeframe objectives.
Yesterdays Analysis:
Fridays Video Outlook:
Best Regards,
The_Architect

GBPUSD: Unlocking Profit Potential with Bullish Momentum!Dear Traders,
GBPUSD is signaling further potential draw towards key points, particularly the Buy Stops and ultimately the weekly bearish order block, serving as our targets. With the institutional order flow leaning bullish, aligning our trades accordingly is prudent.
Currently, price resides at a H1 Bullish order block, where I'm eyeing a confirmation entry to pursue the outlined objectives as indicated on the chart above.
Stay tuned for ongoing updates.
Best Regards,
The_Architect

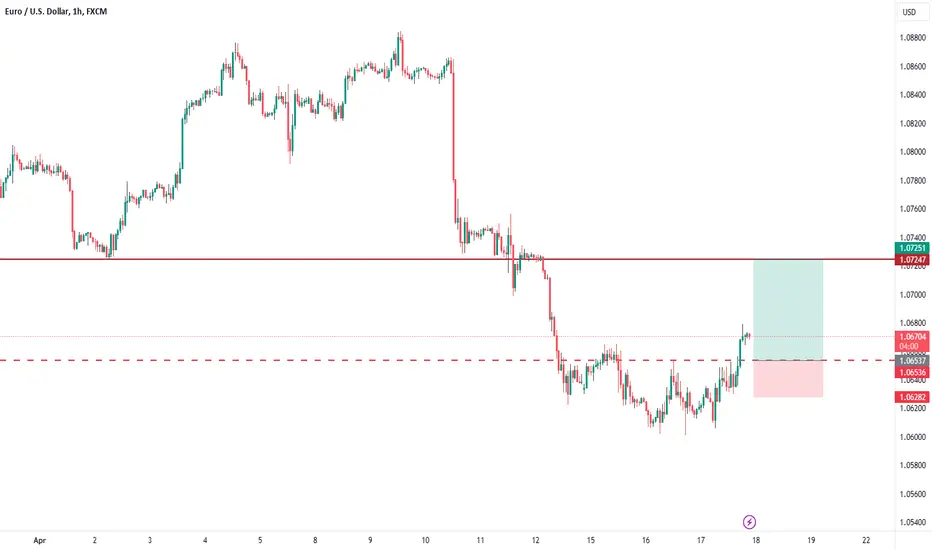
"EUR/USD Retracement After Bearish BreakoutThe EUR/USD pair has recently encountered significant downward pressure, breaching key support levels.
A double bottom pattern, a classic bullish reversal formation, has formed within the downtrend indicating a potential exhaustion of selling pressure.
We can expect a retracement towards the broken support at 1.07257.
Bearish Waves Ahead: Unveiling GBPUSD's Trading PathGreetings Traders,
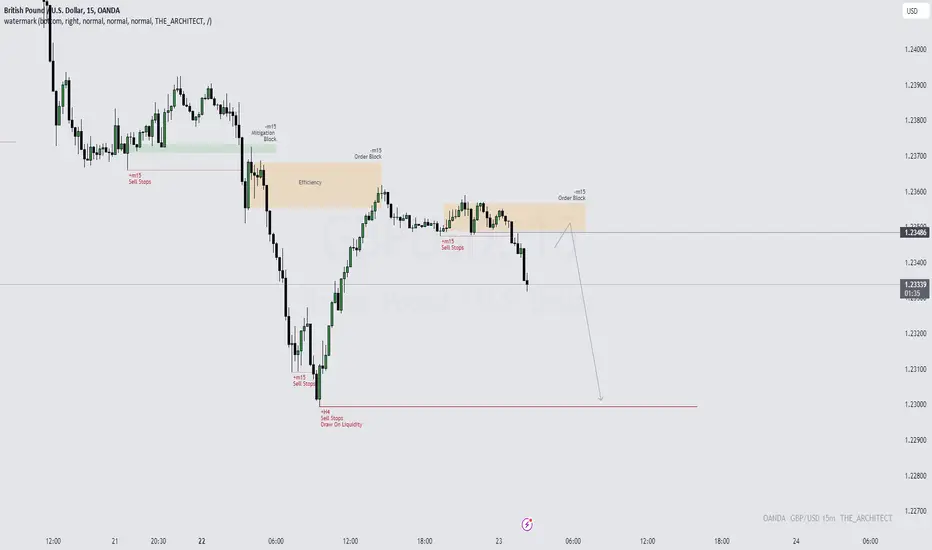
Yesterday, our focus was on minor bullish objectives, although it's important to note the prevailing bearish sentiment in the institutional order flow. Price successfully reached these objectives, notably the daily bearish order block. Currently, we've observed a bearish market structure shift on the H1 timeframe, signaling a continuation of the downward trend.
Our analysis highlights the sell-side objectives, with the overarching goal being a move towards the daily sell stops.
Yesterdays Analysis GBPUSD: Potential Minor Bullish Targets
Best regards,
The_Architect
GBPUSD: Potential Minor Bullish TargetsGreetings Traders!
We've just witnessed a bullish market structure shift, signaling a potential upside move in price, aiming to reach the H1 buy stops, followed by a target towards the daily bearish order block. Stay tuned for updates as the scenario unfolds.
Firstly, I would like to see price draw into the m15 bullish breaker where we can look to enter a confirmation entry for longs.
Kind Regards,
The_Architect
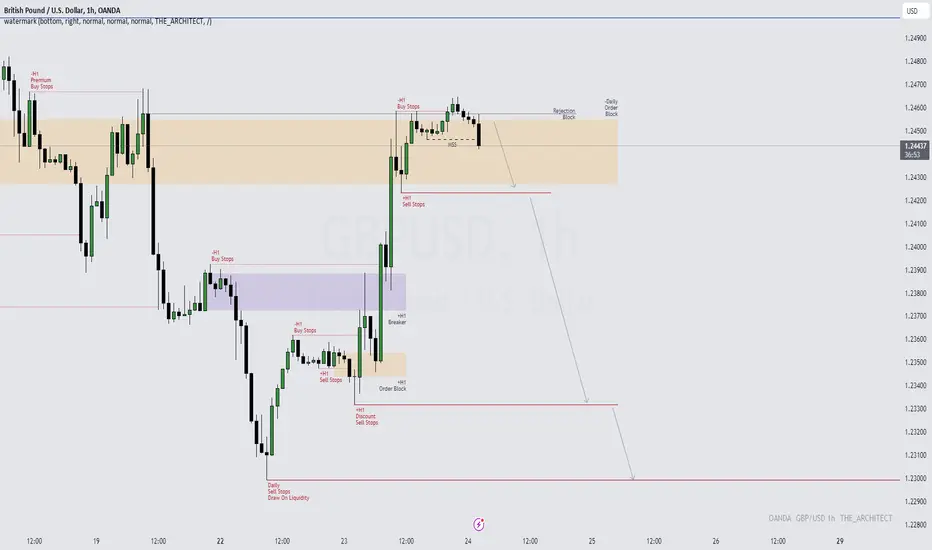
GBPUSD Sell Idea: Anticipating Further Bearish MovementGreetings Traders!
Currently, GBPUSD exhibits strong bearish sentiment , marked by consistent draws on liquidity to the downside. We've recently retraced to a point of efficiency, effectively covering the inefficient price movements from the previous volatile downside move .
Notably, we've interacted with a m15 bearish order block , with price action confirming a market structure shift to the downside . Consequently, I'm closely monitoring the potential draw back into the current m15 order block , anticipating further bearish movement towards the H4 Sell Stops.
Stay tuned for updates as the situation unfolds.
Kind Regards,
The_Architect
Intraday Trading Nifty Futures & Options-20th Mar ’24 Below mentioned points are discussed in my post analysis video(Fast forward to 0:25 for Hindi Audio)
-No Trades in the morning
-No Volumes in Nifty
-Selling Nifty Once Prev Day Low Breaks Was the Plan!
-How will i trade when market opens tom

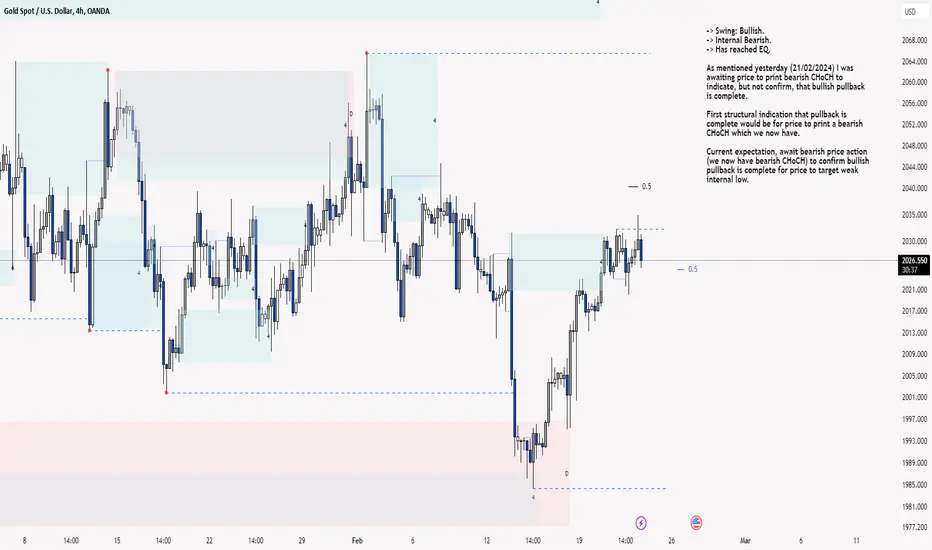
XAU/USD 08 March 2024 Intraday AnalysisH4 Analysis:
Analysis/Bias remains unchanged since yesterday (08/03/2024)
-> Swing: Bullish.
-> Internal: Bullish.
Price has printed a swing BOS and subsequently a bearish CHoCH which is the first structural indication, but not confirmation that bearish pullback is underway.
Expectation is for price to pullback to H4 POI or 50% EQ before targeting internal high.
H4 Chart:
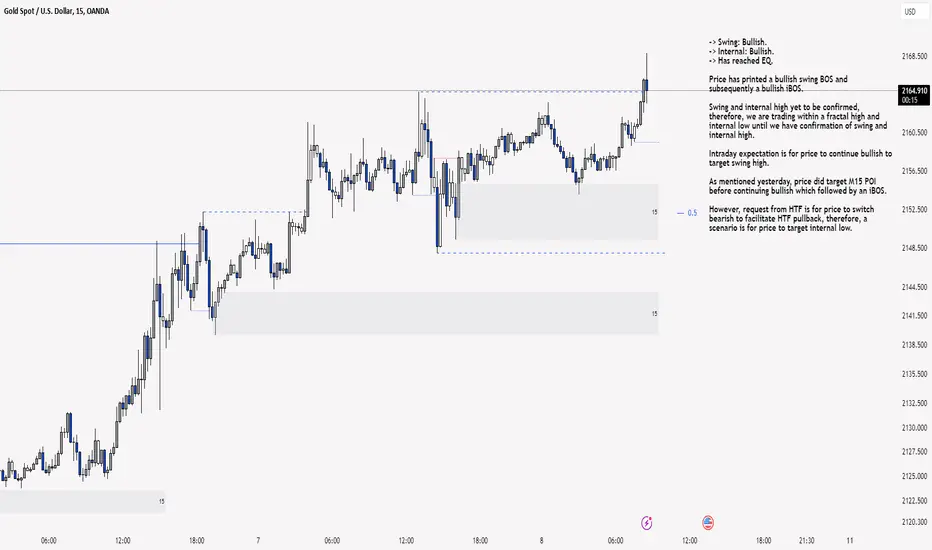
M15 Analysis:
-> Swing: Bullish.
-> Internal: Bullish.
-> Has reached EQ.
Price has printed a bullish swing BOS and subsequently a bullish iBOS.
Swing and internal high yet to be confirmed, therefore, we are trading within a fractal high and internal low until we have confirmation of swing and internal high.
Intraday expectation is for price to continue bullish to target swing high.
As mentioned yesterday, price did target M15 POI before continuing bullish which followed by an iBOS.
However, request from HTF is for price to switch bearish to facilitate HTF pullback, therefore, a scenario is for price to target internal low.
M15 Chart:
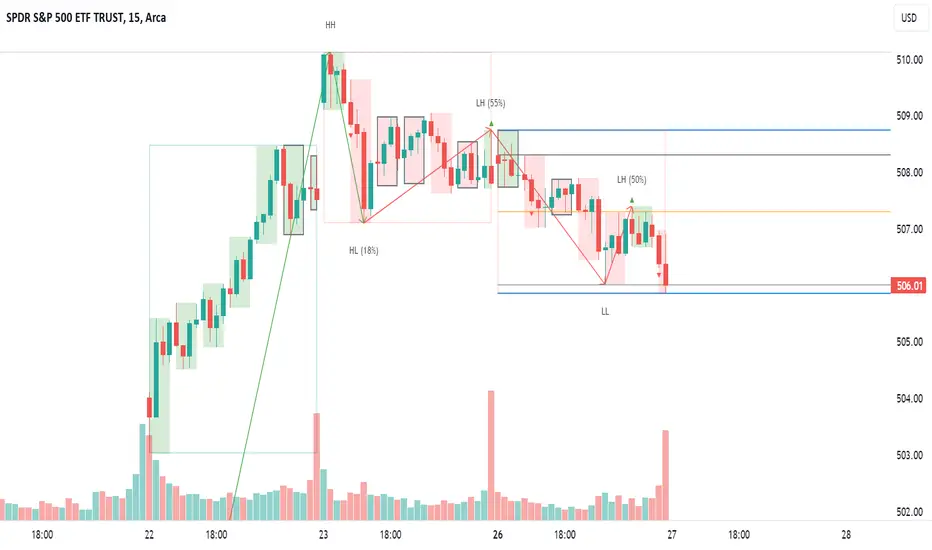
Market bulls take restAfter a spectacular rally last week market bulls are taking a pause. Last two days look quite bearish on the daily chart but if we look at lower timeframes we won't see any signs of strong selling. Price is drifting down very slowly as a result of profit taking and low initiative from buyers.
The high level context is still very bullish: we're in an uptrend, market made new high, retracement <30%, there is an unfilled gap from last week.
There will be some volatility as new economic data released, but at this moment my bias is 100% bullish
Disclaimer
I don't give trading or investing advices, just sharing my thoughts
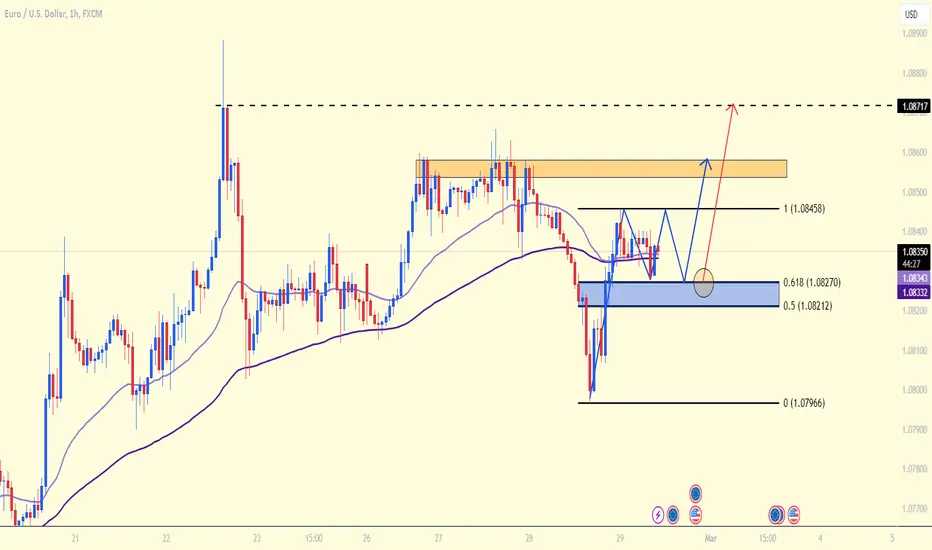
EURUSD : Buy now ???Hello everyone! Are you leaning towards buying or selling EURUSD today?
I'm currently eyeing a buying opportunity for EURUSD as the pair has retraced to the 0.5 - 0.618 Fibonacci zone. According to Dow Theory, buyers seem poised to propel the next price rally for EURUSD, with targets set at the 1.085 resistance and aiming further for the 1.087 peak.
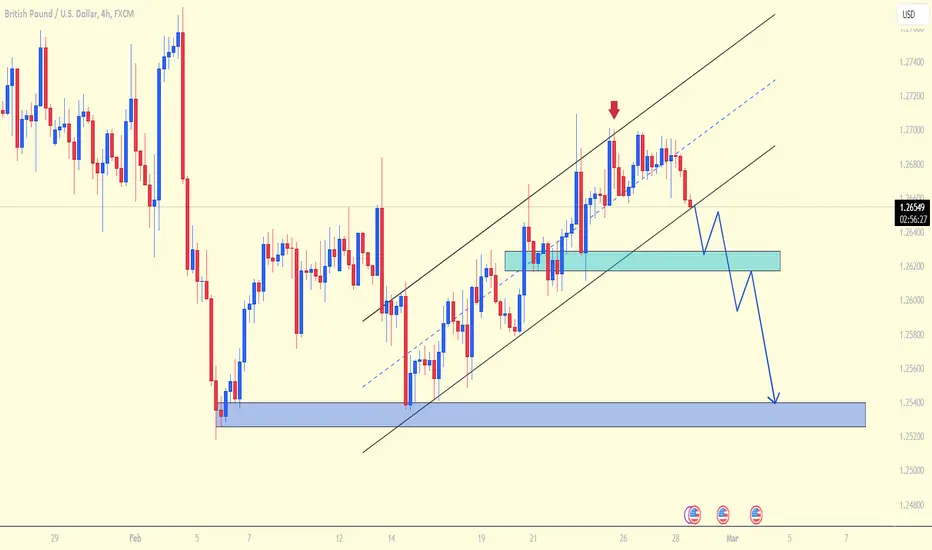
GBPUSD: Discount ! GBP/USD is currently testing the near low of 1.2650 in early European trading on Wednesday. The US dollar is strengthening its recovery amidst cautious sentiment, ignoring the negative yields of US Treasury bonds.
At the moment, this currency pair is hovering around the 1.2650 mark, caught in a technical standoff between the resistance level at 1.2700 and an uptick in short-term technical support, rising from its last low to the level of 1.2550.
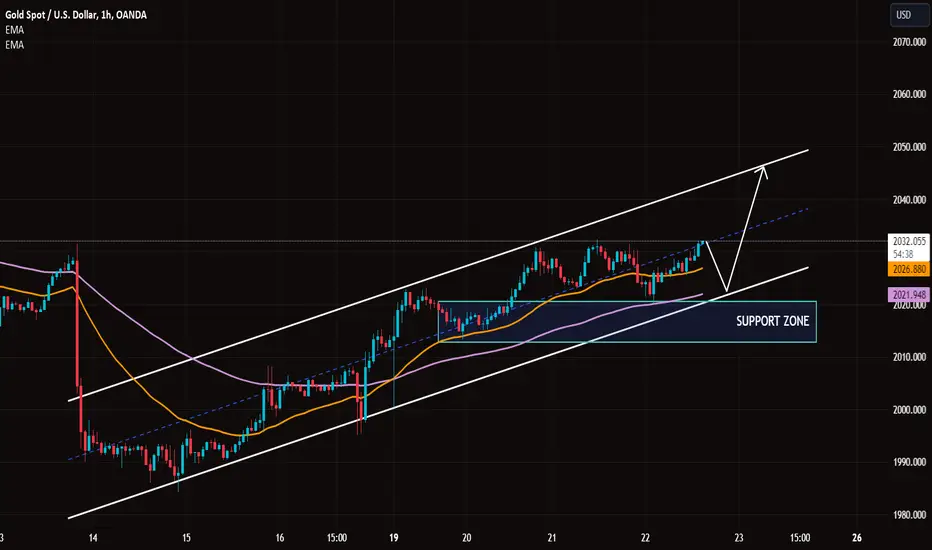
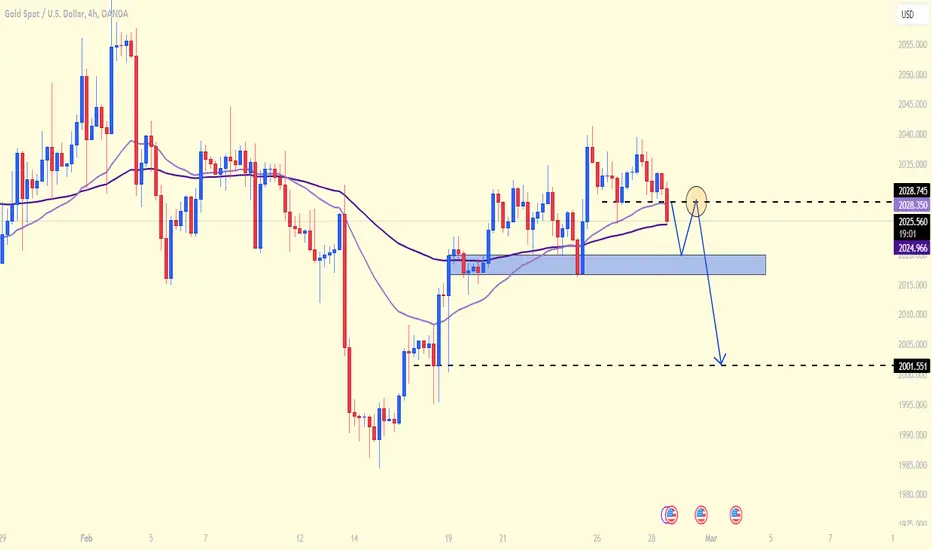
XAUUSD - Many factors can be surprised
Hello, dear friends! Today, gold has dipped nearly $5, trading around $2025 USD after failing to break the resistance at $2035 USD. The movement of gold prices is currently largely influenced by the Federal Reserve's (Fed) interest rate expectations. As such, the upcoming release of the core Personal Consumption Expenditures (PCE) Index - the Fed's preferred inflation gauge - this Thursday is drawing significant attention from investors.
Investors remain vigilant, closely monitoring data to gain clearer insights into the state of the US economy and shape their interest rate expectations. The US PCE for January rose by 0.4% from the previous month. If the PCE data comes in hotter than expected, it could pose challenges for gold prices. However, even in such a scenario, gold is expected to maintain its stance around the $2000 USD mark. Gold prices might only fall below this threshold if this week's economic data turns out to be unexpectedly high.
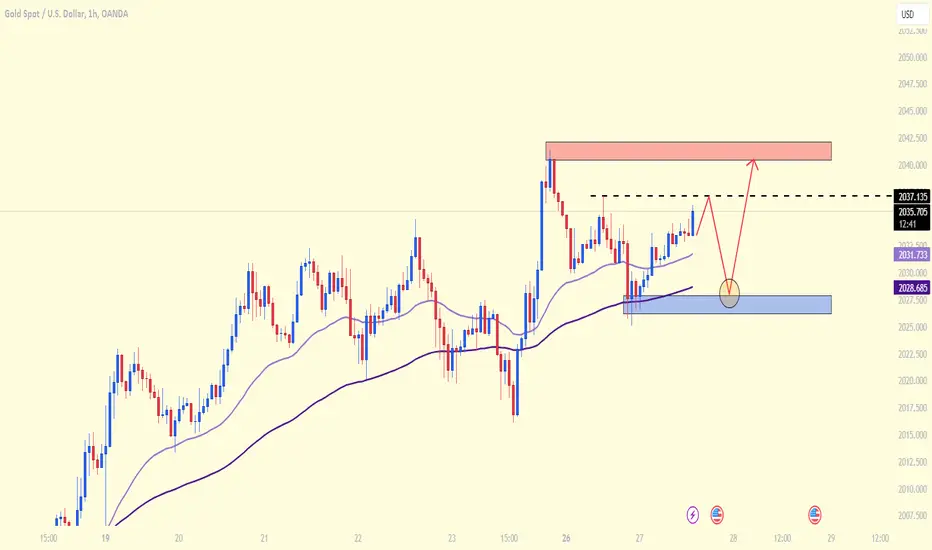
Gold strategy todayGreetings, cherished friends! How do you feel about today's gold prices? Let's delve into a lively discussion!
Recent developments have led to a slight downtrend in the USD, yet gold prices haven't soared as one might expect. Gold continues to hover around the $2032 to $2035 mark, with its future direction seemingly shrouded in uncertainty, heavily swayed by global market news.
Turning our gaze to today's gold price outlook and technical analysis:
Gold remains on an upward trajectory, buoyed above the 34 and 89 EMA lines. Immediate resistance levels are spotted at $2037 and $2041, suggesting a favorable buying strategy:
🌟 Consider entering a buy position in the gold zone of $2028 to $2031
🔹 Set your stop loss at $2025
🔹 Aim for take profits between $2036 and $2041
Dive into the glittering prospects of gold with us, and let's navigate the tides of the market together!
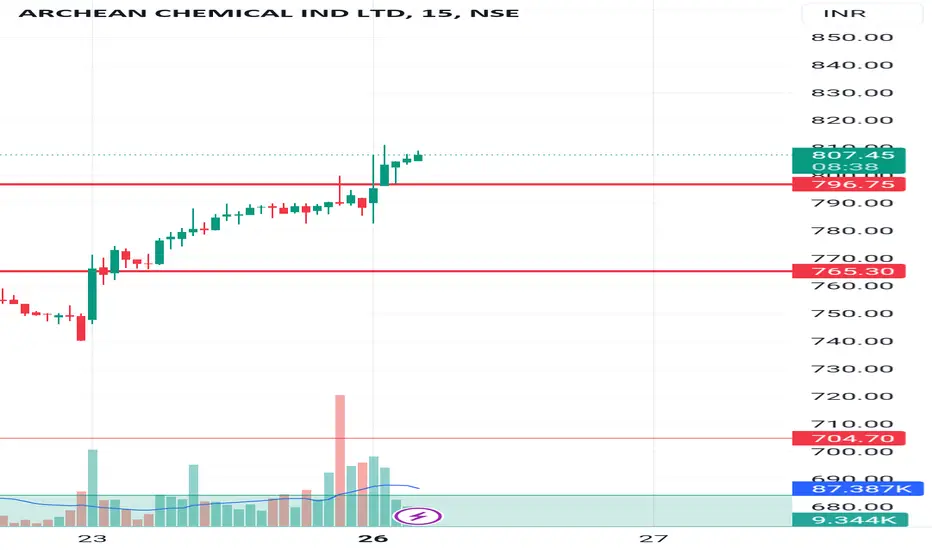
Intraday , Archean chemical Archaean chemical in a inside range looks like a accumulation going on
Good big breakout possible in this
Risky traders can buy this at cmp
Breakout above 812
Ask your financial advisor before buying only for educational purposes
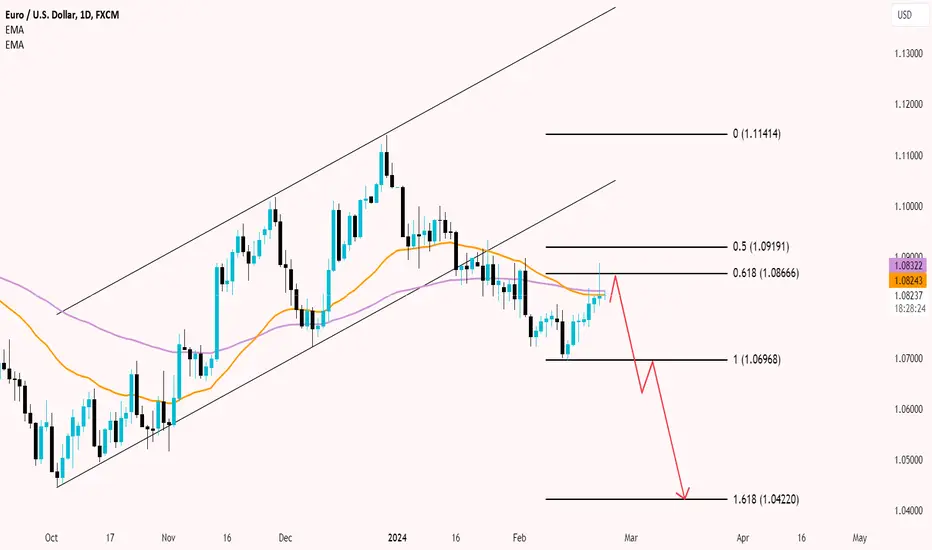
EURUSD: Approaching a bearish momentum?Hello everyone, today EURUSD has risen higher on Thursday, testing the highest bid price since the beginning of February before returning to the 1.0800 area after European and US Purchasing Managers' Index (PMI) data showed a slight decrease or contrary to forecasts.
With the ability to create a DOW from the chart, using the Fibonacci retracement level, the upward movement will soon reach resistance levels at 1.0866 and 1.0919, followed by a rapid decline with an expected touch point of 1.618, which is 1.0422.
What about you? Do you agree with me?
USDJPY: Repeat price behaviorDear friend, what do you think about the next trend of USDJPY for this major currency pair?
Today, USDJPY continues to trade steadily around the 149.00 level, attracting some buyers amidst geopolitical risks and concerns about intervention. Faint hopes of upcoming changes in the BoJ's policy stance may limit further gains. The story of higher interest rates in the longer term by the Fed strengthens the USD and supports USD/JPY.
With the potential for a DOW formation on the chart, it is likely that USDJPY will experience significant volatility, causing price action around the 148.97 and 148.37 levels, which also coincide with the 34 and 89 EMA zones. The price is expected to increase towards the Fibonacci target of 1.618, which is 154.05.
Our "buy on dips" strategy continues to be emphasized.

Gold is less volatileDear friends, today gold continues to move below the resistance level of $2033, following a downward trend.
In particular, the inflation data for January, with consumer prices and wholesale prices rising faster than expected, has made the US Federal Reserve more difficult in making a decision to loosen monetary policy.
Gold may continue to trade sideways in the short term, and the market is awaiting the release of the Personal Consumption Expenditures (PCE) report next week, followed by the Federal Reserve Chairman Jerome Powell's testimony at Congress in early March.

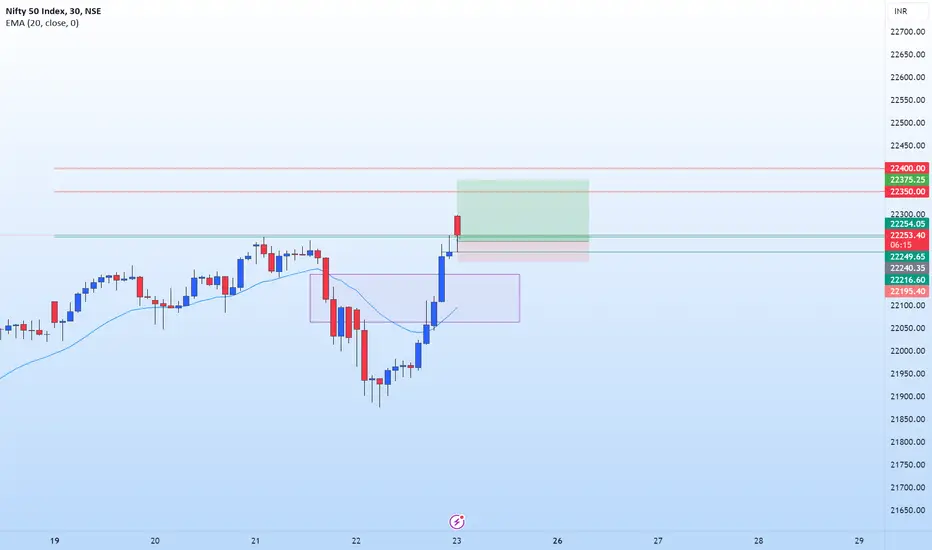
NIFTY 50 23 FEB 24 (INTRADAY)1.Yesterday nifty closed extremely bullish and today opened gap up above previous 2 days high , so this high area will act as support and nifty may start going up from this area, so one can long in intraday for at least 100 points in nifty.
2. Global markets are also bullish.
3. Bank Nifty & Fin Nifty is also strong.
Support Zone Nifty 50- 22217-22250
Upside target in intraday 22350-22400.
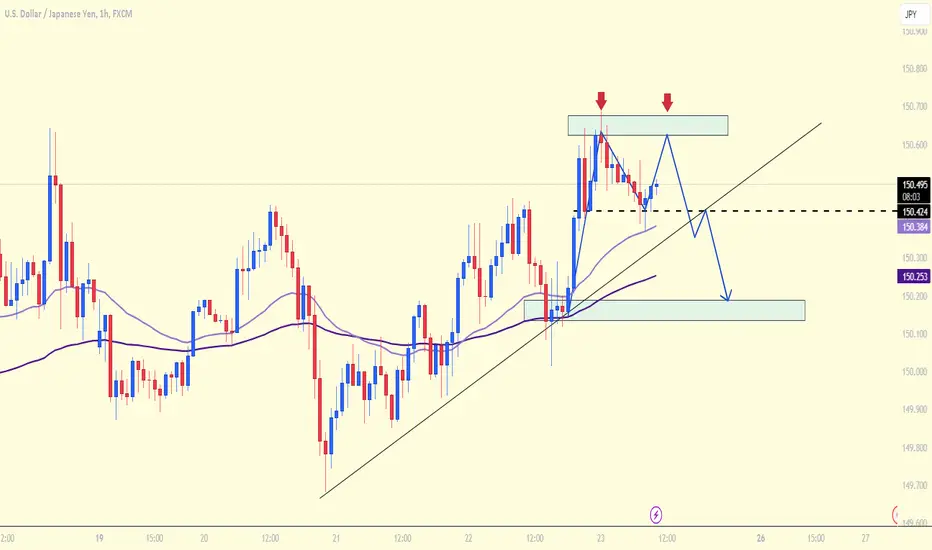
USDJPY : Strategic analysis today!Hello everyone, today the USDJPY has been trading around the 150.500 mark during the early trading hours of the weekend. This pair found support at 150.42 and retested the 34 EMA line.
Trend Forecast: USDJPY is expected to continue its upward momentum and is forming a double top pattern as indicated on the chart. We will consider a sell strategy if USDJPY reaches that level.
What about you? What are your thoughts on the trend and your next trading strategy for USDJPY? Drop a comment to let me know!
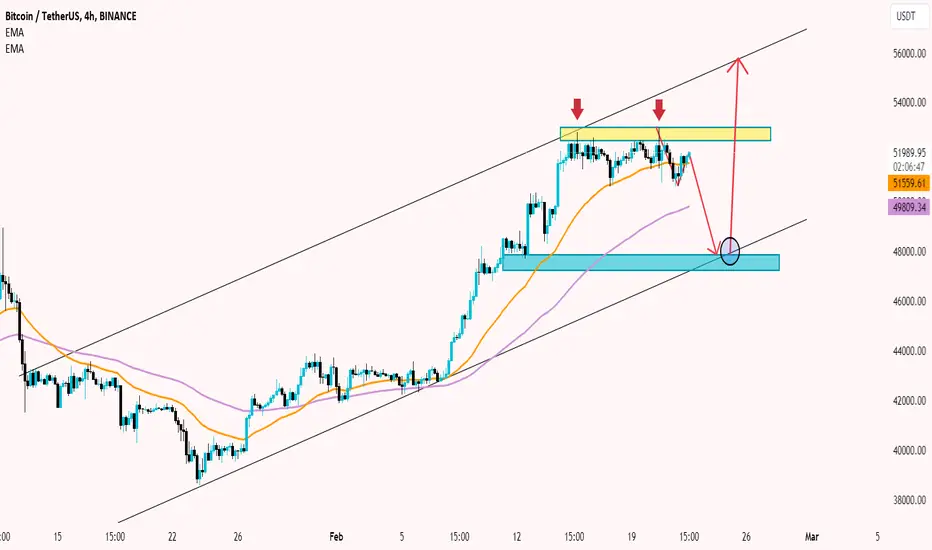
BTCUSDT: Sell or Buy?The BTCUSDT is once again trading below the resistance level of $52,000, mainly moving sideways around the price level of $51,866, highlighting a 0.03% increase for the day.
From the 4-hour chart, we observe that this coin has exhibited a double top pattern, and if it breaks below the support level of $50,600, the ultimate profit target that the market could aim for is at $43,000.
The strategy is to buy when the price declines in the short term, as long as the support level of $43,000 is maintained for BTC.
XAU/USD 22 Feb 2024 Intraday AnalysisH4 Analysis:
-> Swing: Bullish.
-> Internal Bearish.
-> Has reached EQ.
As mentioned yesterday (21/02/2024) I was awaiting price to print bearish CHoCH to indicate, but not confirm, that bullish pullback is complete.
First structural indication that pullback is complete would be for price to print a bearish CHoCH which we now have.
Current expectation, await bearish price action (we now have bearish CHoCH) to confirm bullish pullback is complete for price to target weak internal low.
H4 Chart:
M15 Analysis:
-> Swing: Bullish.
-> Internal: Bullish.
-> Has reached EQ.
Price has printed a further bullish iBOS. Internal range established.
Bearish pullback currently underway indicated by bearish CHoCH.
Price is currently reacting to the upper part of discount to 50% EQ of the internal range.
Intraday expectation is for price continue bullish to target weak internal high. Price may continue bearish, react at M15 POI before targeting weak internal high.
M15 Chart:
Buying XAUUSD channel formationDear friends, what do you think about the next trend in Gold?
Today, the price of gold has regained momentum, rising nearly $2,030 at the start of Thursday after a brief pause in its recovery on Wednesday. The market's risk-accepting environment is playing a role as a resistance to the US Dollar, despite the hawkish tone of the January meeting minutes from the US Federal Reserve.
Furthermore, recent price action suggests that gold is holding above the support level, with upward momentum supported around 2015 and 2020.
On the other hand, technical indicators such as the EMA 34 and 89 continue to consider a potential buying position. Trading with the trend is always safe and effective.