Gold Market Update
Gold prices today continued a subdued trading pattern with minimal fluctuations, mainly moving sideways around $2025 USD, confined within a narrow price wedge.
The precious metal is facing pressure as investors reduce their expectations for a Federal Reserve rate cut in March 2024. This sentiment has bolstered US bond yields and the value of the USD, exerting downward pressure on gold prices.
The market's focus is currently on the upcoming release of US Gross Domestic Product (GDP) data for Q4 2023 on January 25, followed by the Personal Consumption Expenditures (PCE) index on January 26.
These two pieces of data are eagerly anticipated by the market as they are expected to more clearly define the Fed's monetary policy direction in the near future, which will significantly influence the global gold price trend.
Intradaytrade
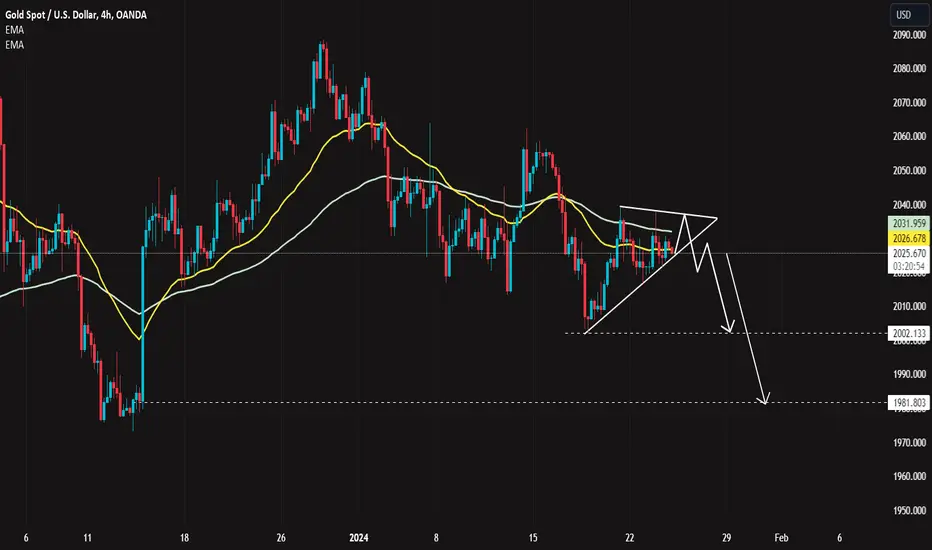
Gold clings to modest gains near 2,030 USD - XAUUSDHello dear friends, in today's trading session, the longer-term moving averages EMA 34 and 89 are slightly lower than the current level, limiting the price increase. Finally, the technical indicators do not provide clear direction, as they are not reaching any significant levels.
With the potential formation of a cup and handle pattern, I expect gold to rise to around $2040 and then retreat.
The "buy on dips" trading strategy for gold continues as long as the significant static support level of $1988 is maintained. The uptrend could strengthen further if strong buying pressure is received from this final support level.
Support levels: $2016.40, $2001.60, $1988.60
Resistance levels: $2033.10, $2047.20, $2056.80
AUDCHF I Potential rise to top of the channelWelcome back! Let me know your thoughts in the comments!
** AUDCFH Analysis - Listen to video!
We recommend that you keep this pair on your watchlist and enter when the entry criteria of your strategy is met.
Please support this idea with a LIKE and COMMENT if you find it useful and Click "Follow" on our profile if you'd like these trade ideas delivered straight to your email in the future.
Thanks for your continued support!

USDJPY: stays below 148.00Dear readers, USD/JPY is experiencing downward pressure and has dropped to the 147.50 level during the European trading session on Tuesday. Following the Bank of Japan's decision to maintain their policy settings as expected, Governor Ueda stated that they will assess whether to keep negative interest rates when the current price target is achieved.
As a result, the US Dollar is showing signs of depreciation, so I anticipate that USD/JPY will decline towards the support level at 146.00, where the EMA line is converging, before any new catalysts emerge.
NIFTY INTRADAY LEVELS FOR 23/01/2024BUY ABOVE - 21670
SL - 21620
TARGETS - 21720,21840,21920
SELL BELOW - 21580
SL - 21630
TARGETS - 21530,21480,21420
NO TRADE ZONE - 21580 to 21670
Previous Day High - 21720
Previous Day Low - 21530
Based on price action major support & resistance's are here, the red lines acts as resistances, the green lines acts as supports. If the price breaks the support/resistance, it will move to the next support/resistance line. White lines indicates previous day high & low, high acts as a resistance & low acts as a support for next day.
Trendlines are also significant to price action. If the price is above/below the trendlines, can expect an UP/DOWN with aggressive move.
Please NOTE: this levels are for intraday trading only.
Disclaimer - All information on this page is for educational purposes only,
we are not SEBI Registered, Please consult a SEBI registered financial advisor for your financial matters before investing And taking any decision. We are not responsible for any profit/loss you made.
Request your support and engagement by liking and commenting & follow to provide encouragement
HAPPY TRADING 👍

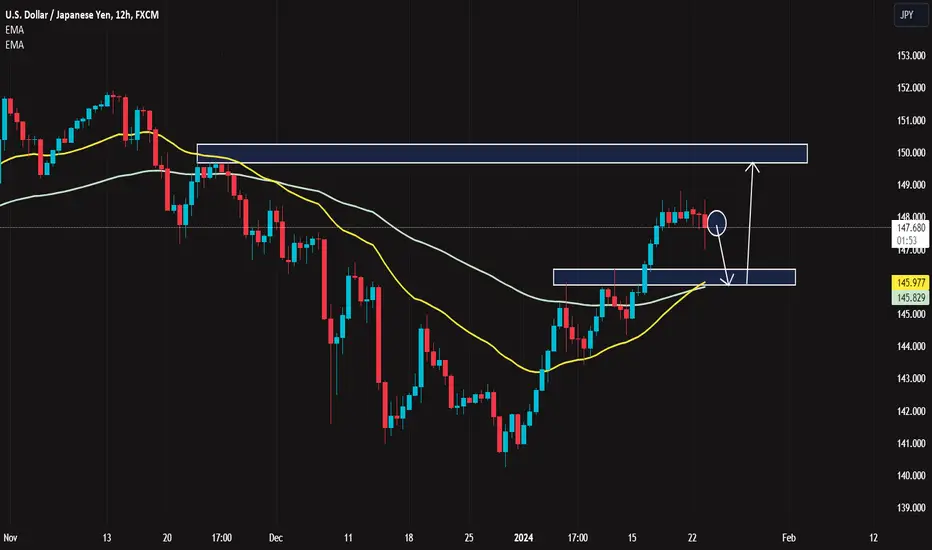
USDJPY developments today"USDJPY This Week: Continuation of Uptrend or a Correction in Sight?"
Faced with the challenging question of USDJPY's direction this week, we observe that the currency pair is maintaining a remarkable upward streak, reaching 147.89 in the early trading hours of the week.
In the short term, technical indicators continue to support the upward trajectory of USDJPY. The pair is attempting a recovery after finding significant support around 148.00. This upward momentum could be further bolstered as the US Dollar Index (DXY) gains traction from bets favoring a potential interest rate cut by the Federal Reserve in March.

Change gold positively on the weekend!Hi, dear friends, nice to meet you in the game to transfer gold price today!
On the fourth day, Gold carried out a strong weakness, the price reached the psychological level of $ 2000 but made the adjustment again and lasted to this day.
The precious metal is currently trading around US $ 2022 and is close to Fibonacci's 0.5 - 0.618 regression, so the prospect of this precious metal is still high.
However, if it can overcome that regression level and overcome the temporary resistance level at 2033 USD it can open for gold more and more strongly recovering opportunities with the contribution from stress. Political escalation will push high risks globally.
The economies will continue to suffer from inflation pressure due to goods deficiency. This will make the global economy difficult to recover as expected, so they will boost gold to make profits and prevent risks for capital flows. The forecast of gold price has increased sharply, when stress has not ended.
In your opinion, how will gold move in the near future?

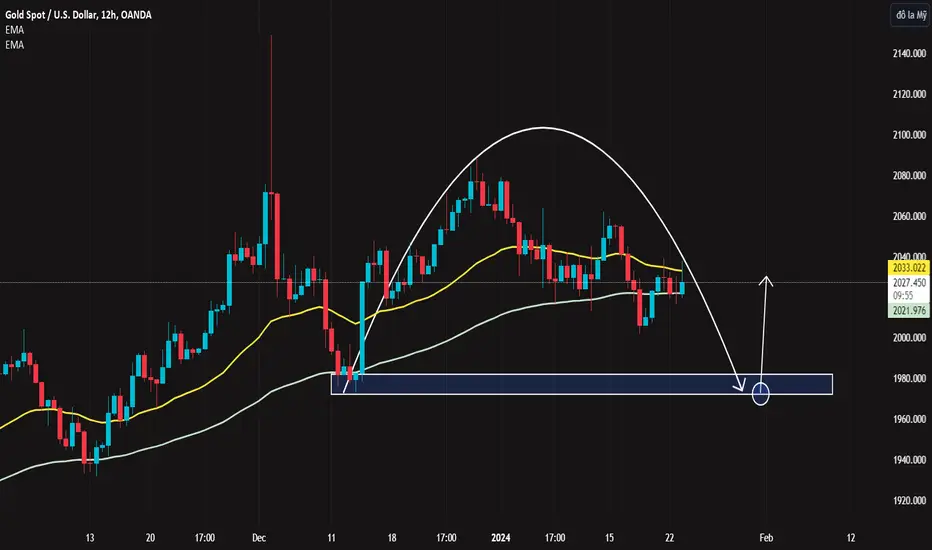
XAUUSD : Prices continue to weakenHello dear friends!
Gold prices today continued to fall sharply with gold down 25 USD to 2,001SD/ounce but soon regained the level of 2010 USD at the time of writing.
Accordingly, gold prices continued to plummet to a more than 1-month low in mid-week trading session as strong economic data strengthened the USD and Treasury bond yields and reduced market expectations about the US interest rate cut in March.
Gold's close below $2,015/ounce signals that the sideways range has been broken and the precious metal is entering bearish territory, with it still expected to reach $2,000 again and possibly lower to $1,990.

GBPSUD ICT Long setup in Lower timeframe. 30 pips profit possiblGBPSUD ICT Long setup in Lower timeframe. 30 pips profit possible!
Hey traders! 👋
Quick update~
GBPUSD is in Downtrend in 4H or above timeframes.
Perhaps a displacement and Choch break through 1.2679, retested on support level 1.2639 today.
Possible a little hit the Swing high 1.2696~ Gain some pips from Long trade.
Remember, this is just an idea and not a guarantee. Always do your own research and analysis before making any trades. Good luck! 🤞
If you found value in this post, please like and share it and let more traders can alert this and for up coming updates and ideas, thank you so much!👋

EUR/USD attracts some sellers below the mid-1.0900 Hello everyone, what do you think about EURUSD today?
Currently, EURUSD is still in a downtrend after the pair formed a double top pattern and started to decline more with a reversal signal from EMA 34.
Risk aversion in the market dragged risky assets like the Euro lower amid rising tensions in the Red Sea.
For today's trading, we will prioritize SELL because the main trend is still down and trend trading is always an effective and safe way to trade.
What about you, do you think we should sell EURUSD?

Gold price today: Trading is quietHello everyone, nice to meet you again in today's talk about gold prices.
Currently, gold price is fluctuating around 2050 USD and down nearly 8 USD compared to yesterday's transaction. In general, the first day of the gold week did not have much change in trend because the US market was closed during the Martin Luther Day holiday.
However, escalating geopolitical tensions in the Red Sea and a risk-on environment still benefit safe-haven assets such as gold.
December retail sales next Thursday and a preliminary estimate of the January Michigan Consumer Sentiment Index on Friday. The focus will remain on inflation, as Canada, the UK, Germany and the Eurozone will post updates, which will directly impact gold prices whether they have breakouts to the upside or downside. new.

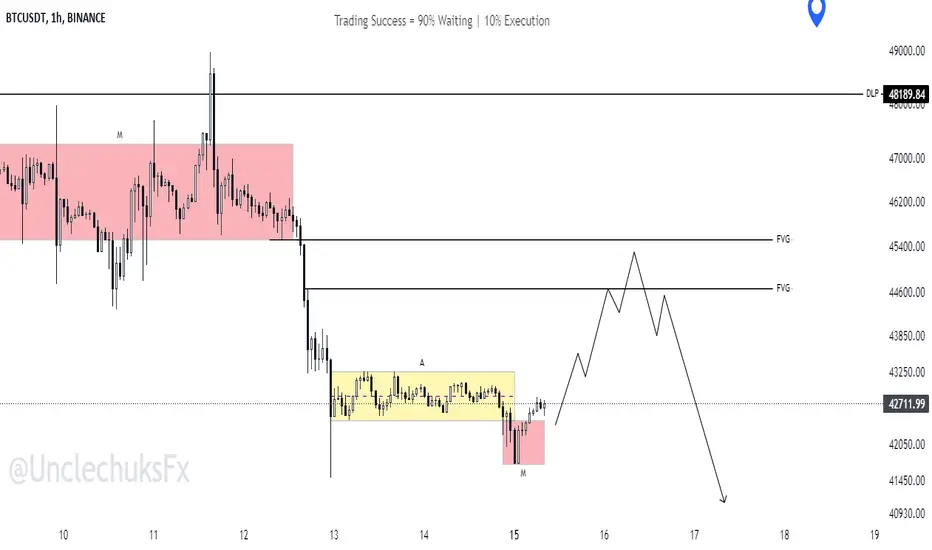
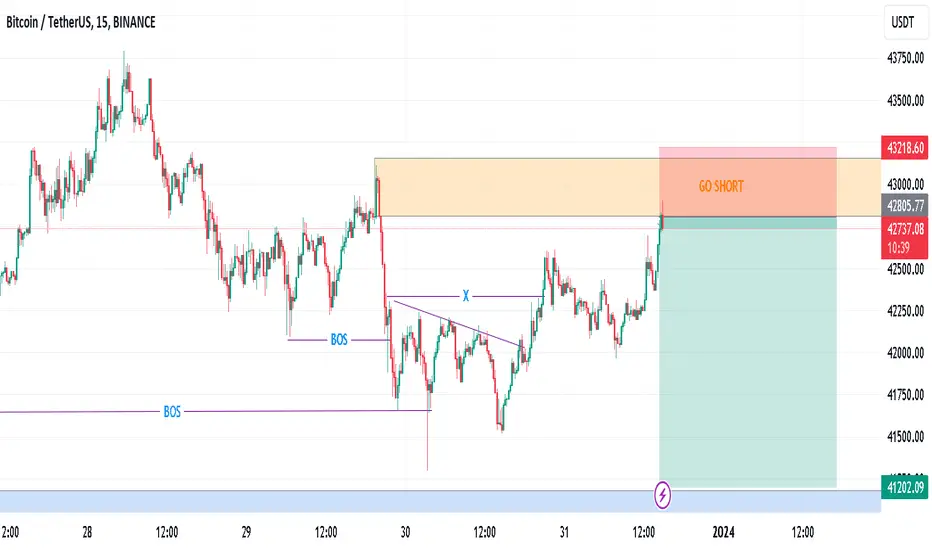
BTCUSD ForecastOn the 4H TF, we see the classic Accumulation and Manipulation for Bitcoin. We're now in the Distribution Phase.
Nonetheless, on the lower TF, we'd be looking to take advantage of another AMD formation into the 4H FVG before we continue downwards.
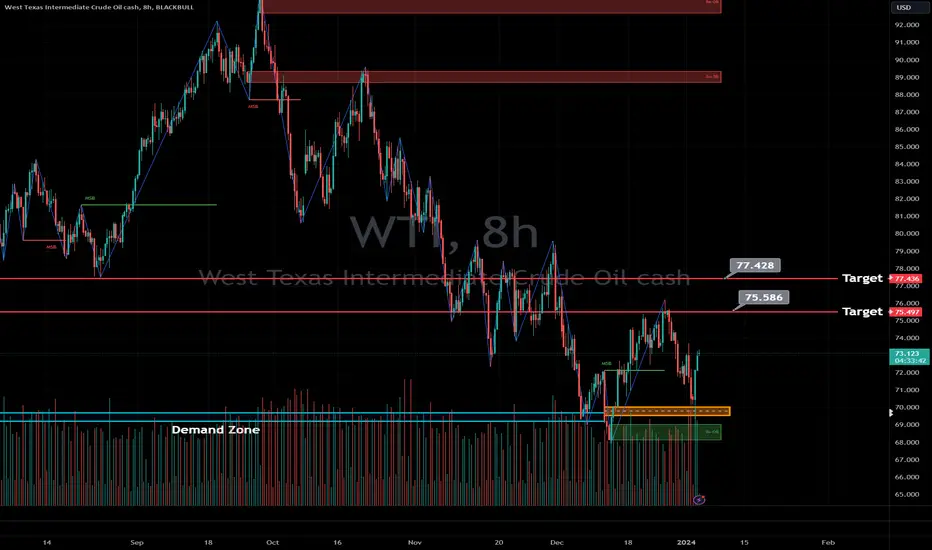
How you can earn money from this ICT setup?Here you are, please read the summary about Oil price below~
📈 Oil prices surged in early trade on Thursday, extending the previous day’s sharp gains on concerns about Middle Eastern supply following disruptions at a field in Libya and heightened tension around the Israel-Gaza war.
🛢️ Brent crude rose 33 cents, or 0.42%, to $78.58 a barrel by 0101 GMT, while U.S. West Texas Intermediate crude futures rose 40 cents, or 0.55%, to $73.10.
📈 Both benchmarks rose by around 3% to settle higher for the first time in five days on Wednesday, with WTI seeing the biggest daily percentage gain since mid-November.
🚫 On Wednesday, local protests forced a full shutdown of production at Libya’s Sharara oilfield, which can produce up to 300,000 barrels per day. The field, one of Libya’s largest, has been a frequent target for local and broader political protests.
💥 Also on Wednesday, nearly 100 people were killed in blasts at an event to commemorate commander Qassem Soleimani who was killed by a U.S. drone in 2020. Iranian officials blamed unspecified “terrorists” and vowed revenge. However, no group has yet taken responsibility for the attack. The U.S. has seen no indication Israel was behind the blasts, White House national security spokesperson John Kirby said.
🔥 Swirling regional tensions from the ongoing Israel-Hamas war also continue to support oil prices.
🚀 On Tuesday, Hamas’ deputy leader was killed in a strike in Beirut - the first strike to hit the Lebanese capital in almost three months of near daily fire between the Israeli military and Iran-backed Hezbollah that had been confined to the border region.
🚢 Shipping concerns in the Red Sea also remained after Yemen’s Iran-backed Houthis said on Wednesday they had “targeted” a container ship bound for Israel. U.S. Central Command said the militant group had fired two anti-ship ballistic missiles in the southern Red Sea the previous day.
Technical Analysis:
As we can see there are demand zone and FVG near $68 to $70 since the middle of 2023.
Here is a sharp rebounce (Pin bar) on the demand zone. A good ICT Long setup for both Swing and Intraday traders!
The decline in gold prices has not stopped yetHello everyone, let's learn about the gold market today with Karina!
Today's gold price is still in a downtrend with the price sometimes dropping to 2020 USD, but there has been a slight recovery and trading around 2027 USD at the time of writing.
In the context of the market waiting for the US to announce the Consumer Price Index (CPI) in December 2023, this index is expected to reach an annual increase of 3.2%, 0.1 percentage point higher than the level 3. .1% previously. However, core CPI after excluding food and energy prices is expected to decrease from 4% to 3.8%.
In response to this information, US stocks increased quite sharply, causing financial investors to focus capital on stocks. As a result, very little money flows into precious metals. The decline in gold prices today has not stopped, which is understandable.

Should gold be prioritized for sale anymore?Hello everyone, what do you think about the price of gold?
Today gold does not have too many fluctuations, mainly around 2030 USD and the trend is still stuck in a downward trend!
About gold trading strategy:
-On the analysis chart, gold is limited below the resistance level of 2036 USD and confluences with the two EMA lines, so the downtrend is even more supported. Therefore, we will prioritize Sell orders with the goal of taking profits at the defensive level of the Bulls in 2020 - 2017 USD.
Good luck to you !

BTCUSDT: Upward momentum remains the sameHello smart traders!
Today BTCUSDT continues to trade above 46,300 USD and there is not much change in trend while still focusing on the sideway.
About today's trading strategy: In terms of signs, in the short term BTCUSDT is in an uptrend with bullish consensus from EMA 34 and 89 signals.
The two support levels are 46,000 and 45,500 USD respectively, located near the EMA's operating zone, so the outlook is that after the price retests these two lines, the recovery momentum will continue.
And you, do you think BTCUSDT will increase or decrease today?

Intraday Scalping Idea for USDJPY: Key Levels and Sell LimitsHey traders! 👋
H1 ICT short setup
Let’s take a look at the USDJPY H1 chart, which performed LG and Displacement + Choch after the last NY session and Asia AM session. Our AI screener shows that the JPY has slowed down the weak strength (turning to the strong side gradually) and the USD is increasing momentum to the weak side, which makes USDJPY drop as well.
If you’re looking for an intraday scalping idea, here’s one for you:
🎯 Target on key levels:
145.30
144.72
📉 Sell limit order levels:
145.48
145.63
145.77
🛑 Stop loss:
145.90
Remember, this is just an idea and not a guarantee. Always do your own research and analysis before making any trades. Good luck! 🤞

Where will the gold price go this week?Hello dear friends, let's explore the price of gold for the new week with Karina!
Gold prices opened the week's session and traded relatively stable at around $2043. On the analysis chart, gold is still in a downward trend, but selling pressure is gradually weakening as gold shows some signs of upward movement with a support level near $2035. Overall, in the short and medium term, the possibility of a price decline seems to be limited as long as the precious metal maintains its fundamental level of $2030.
Speaking about upcoming trends: Gold is heavily influenced by market news, and inflation data this week will be crucial. Therefore, it is important to closely monitor and grasp these updates to have a clearer view of the upcoming strong increases or decreases in gold.

GBPUSD Looking like it wants to reverse soonAs I monitor price looking for the original target of the previous Aug high to be taken out but not to sure if it will have the strength to get all the way up there. It is only Monday and a New High/Low is created for the week between Tue - Thurs. So watching to see how price reacts going into tomorrow.

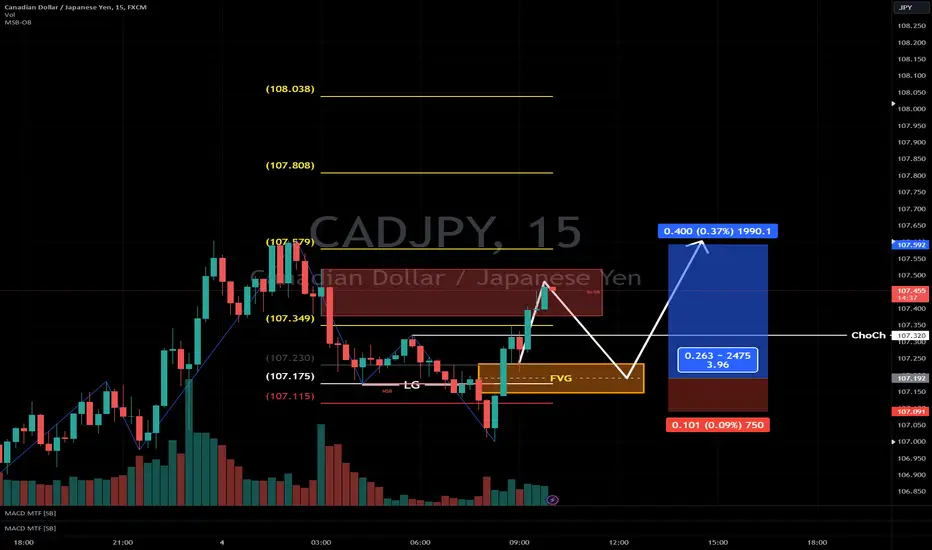
How do you earn daily profit from JPY pairs?🚩 [SB AI New Signal Notification
Release time : 2024/1/4 1000
Strategy : Daytrade scalping
Chart : CADJPY
Direction : ICT Long setup
Price : Buy Limit orders near the FVG, Stop loss and TP levels.
#SB signals #New strategy #Forex #CADJPY #Daytrade #Scalping #Freedom trading style #Easy trading #Copy and earn #Zero learning curve
BTCUSDT SHORTA possible short trade idea for bitcoin dollar. Price has grabbed the liquidity from inducement zone and now reacting at its supply zone. Price may drop from this supply zone. Take good care of your stop losses. Happy Trading
XAUUSD Strategy to analyze gold price trends todayGold prices (XAU/USD) are on a steady trend, positioned for their best year in the past three years, driven by various global economic factors and geopolitical tensions.
Although spot gold fell slightly early Wednesday, it remained near a two-week high. Gold futures prices, in turn, are rising, making them likely to post strong annual gains. This performance reflects gold's enduring appeal in uncertain times.
It broke above the 2067.00 minor resistance level, which could now act as new support. The next key resistance level is 2149.00. Staying above the key support level of 1987.00 reinforces this bullish sentiment.
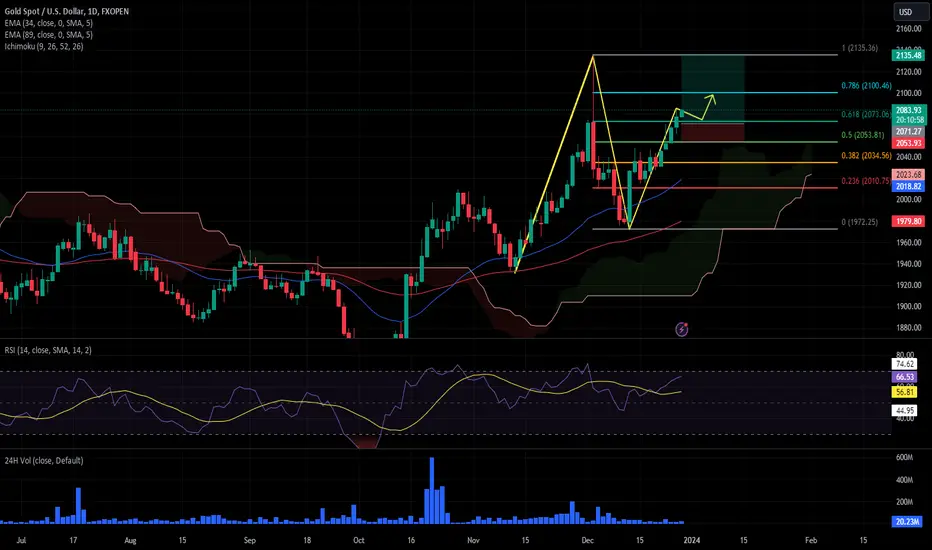
Gold continues to search for new highsGold is currently experiencing a sustained upward trend, with prices being driven higher due to the recent recovery on Friday. The trend line is still in the process of forming, and there is an immediate resistance level at $2,070. If there is a breakout above this resistance level, it could propel XAUUSD towards a third peak formation, which is anticipated to occur along the trendline at $2,130.
