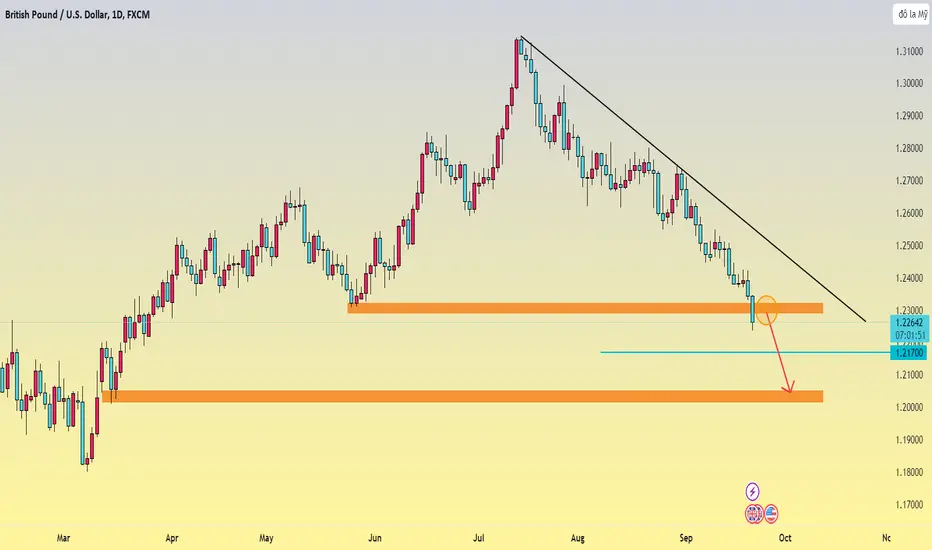
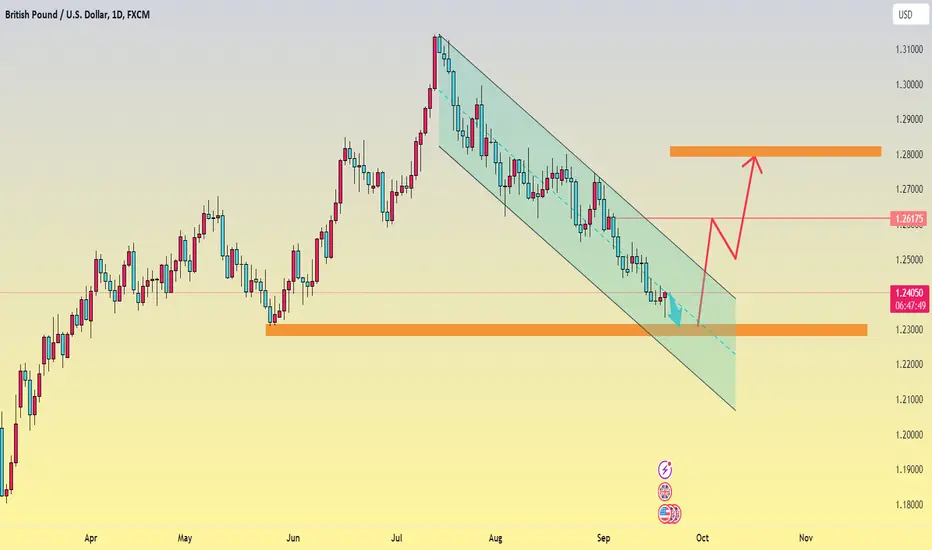
GBP/USD fights in a downtrendGBPUSD broke the low of 1.23081, coinciding with sell-side liquidity, making it a medium-term level for sellers' profit targets. Further declines below that are possible towards 1.21700. I would like to see sellers attack that near-term support level in the near term before we reach new targets.
Intradaytrade
GBPUSD tests the declineGBP/USD is testing daily lows near 1.2270 on upbeat retail sales data from the UK. It last traded at 1.2272, down 0.16% on the day.
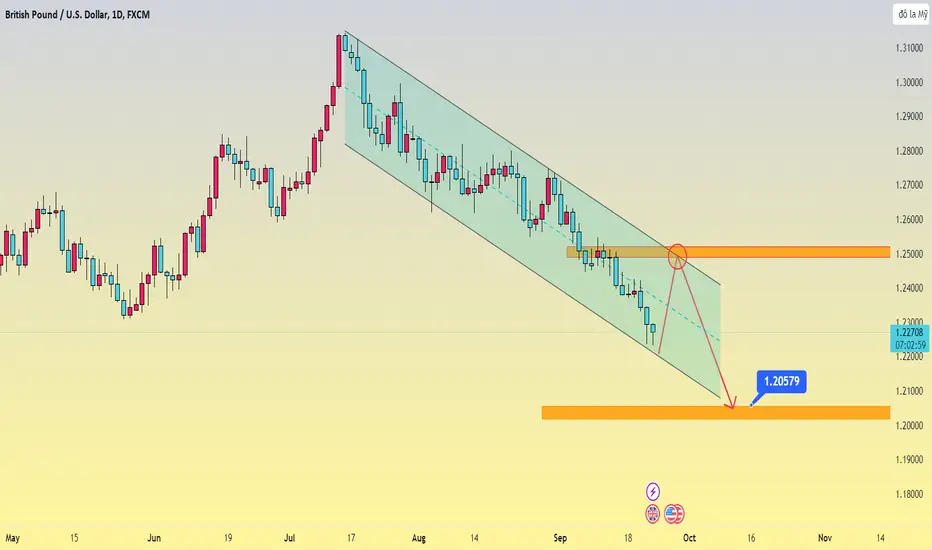
Overall, we can see that the main trend for the pair so far is bearish, so the downside is that if that happens, it will likely reach 1.205 close to 1.2000.
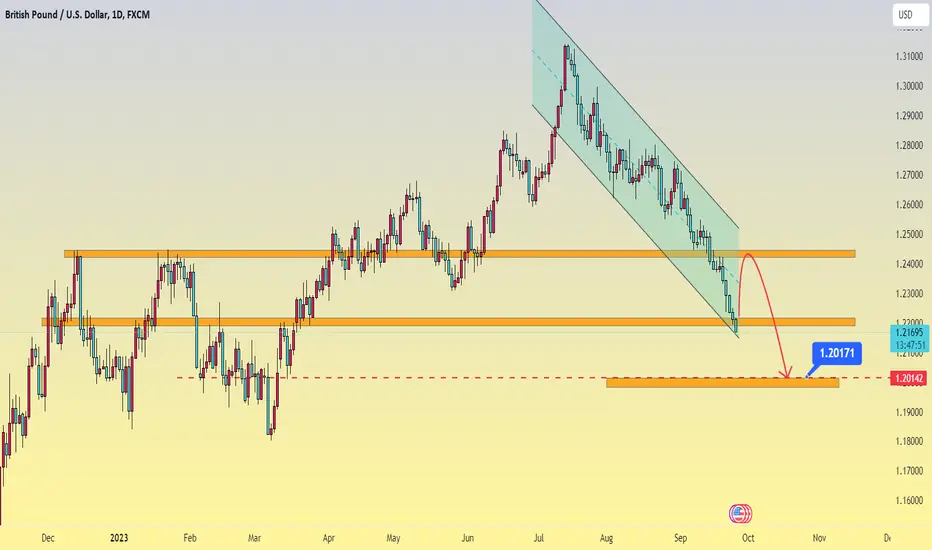
GBP/USD continues its multi-month downtrendToday, the GBP/USD exchange rate continues to weaken near its lowest level in many months, trading around 1,219. GU is close to its highest level since the beginning of the year, amid a hawkish Fed outlook and rising US bond yields. Last week's surprise BoE pause continued to weigh on GBP and put further pressure on the currency.
Looking at the 1D timeframe, we can see that GBPUSD has dropped to support compared to previous months. However, given that the downtrend has not stopped, it is expected that the pair will fall to the designated level of 1,201.
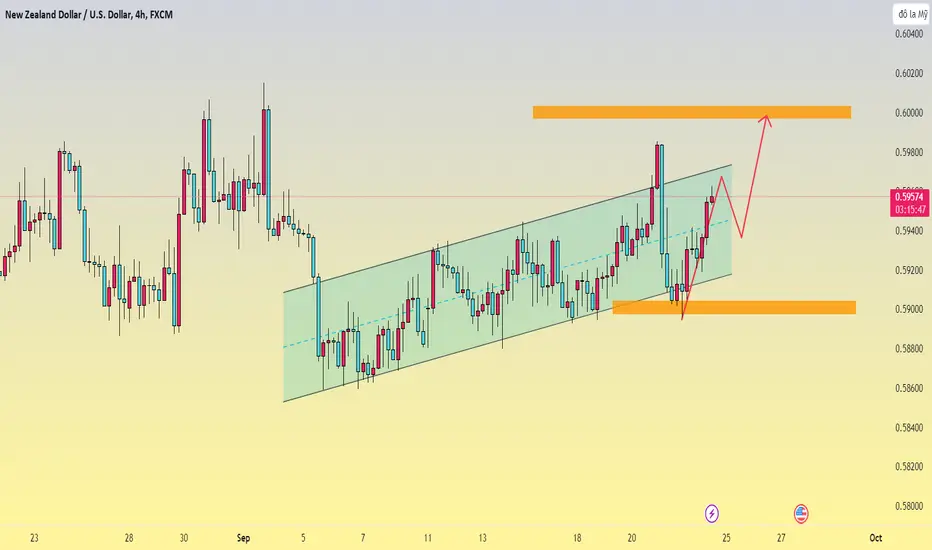
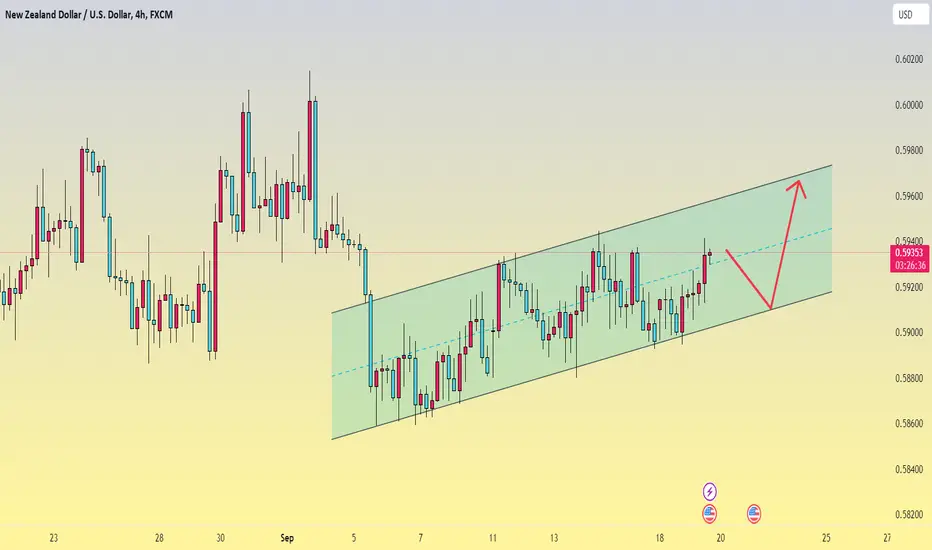
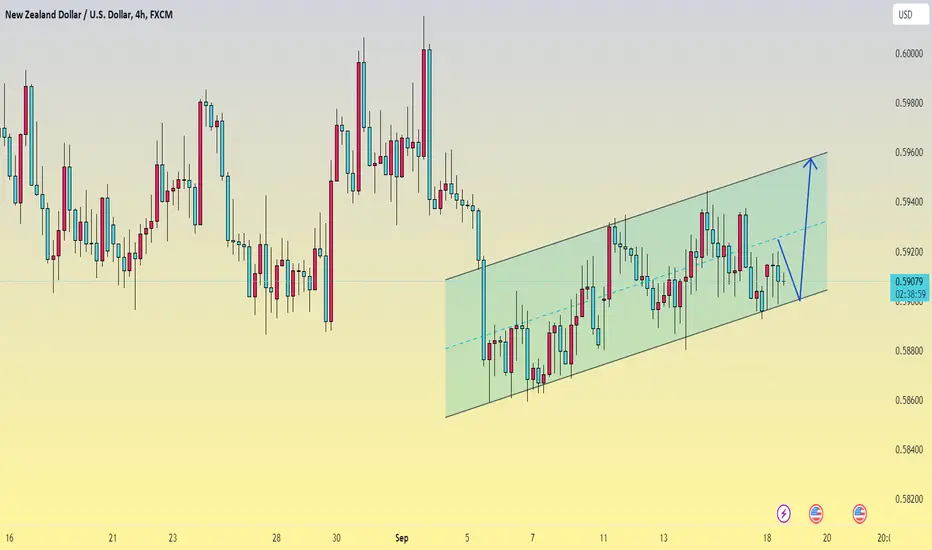
NZUSD continues to riseToday we see a further increase in the pair reaching 0.595 trades and remaining within the main uptrend.
The pair's next target is 0.600
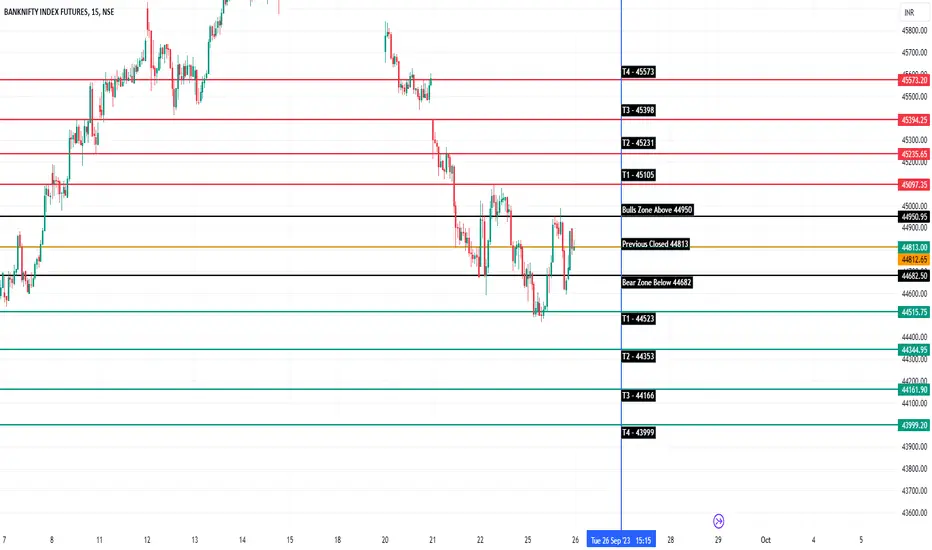
BANKNIFTY INTRADAY PREDICTED LEVELS FOR 26 SEP 2023Bank Nifty Predictions for Intraday Players, these levels are only valid for one single day, which is 26th Sep 2023, and only for the educational purpose only.
I have marked all the levels on the upside and downside on the Intraday Charts, which anyone can see easily.
Bull Zone Means Buying Above Once Any 5 Min Candle Give Closure Above that Level and Bear Zone Means Selling Only, If Any 5 Min Candle Get Closed Below Bear Zone.
All the predictions are only for testing purposes, and for paper trading only.
Disclaimer : Please consult with your financial advisor before taking any real trade in the live market.
Expect gold this weekHello dear friends. What do you think about Gold?
After the opening price at the beginning of the week, we witnessed a slight decrease in Gold, from 1925 USD to 1923 USD. Gold continues to trade in a neutral range as the Federal Reserve kept interest rates unchanged in its September monetary policy meeting.
Technically: A drop is expected at least to the next Critical Support level which is anticipated at $1900 after a retracement to the broken level and then a rise to the prescribed level.

Gold increased slightly todayIn this morning's trading session, gold prices increased slightly, reaching 1929-1930 USD in the context of a slight decrease in the value of the USD. Meanwhile, the US Dollar Index (DXY), which measures volatility against six major currencies (EUR, JPY, GBP, CAD, SEK, CHF), fell 0.1% to 105.22. This has supported gold prices.
Sincerely thank everyone

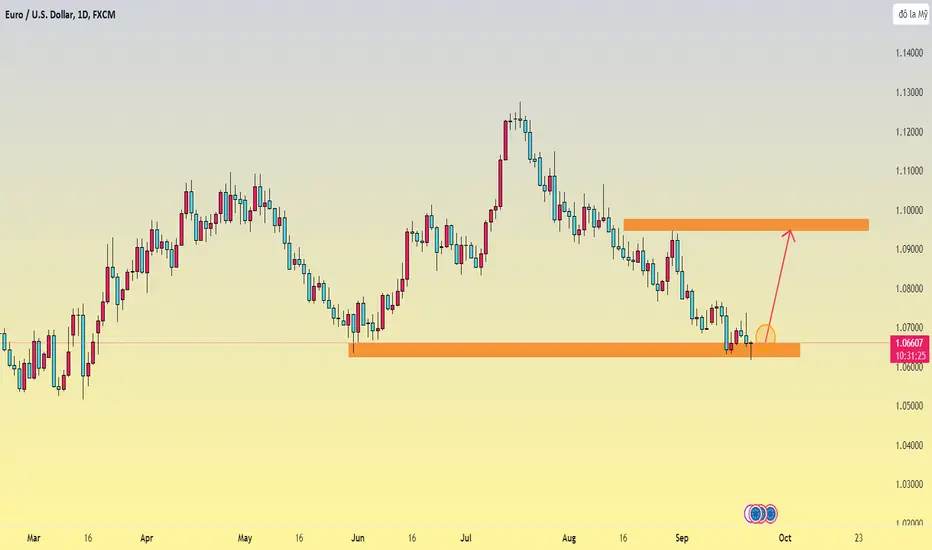
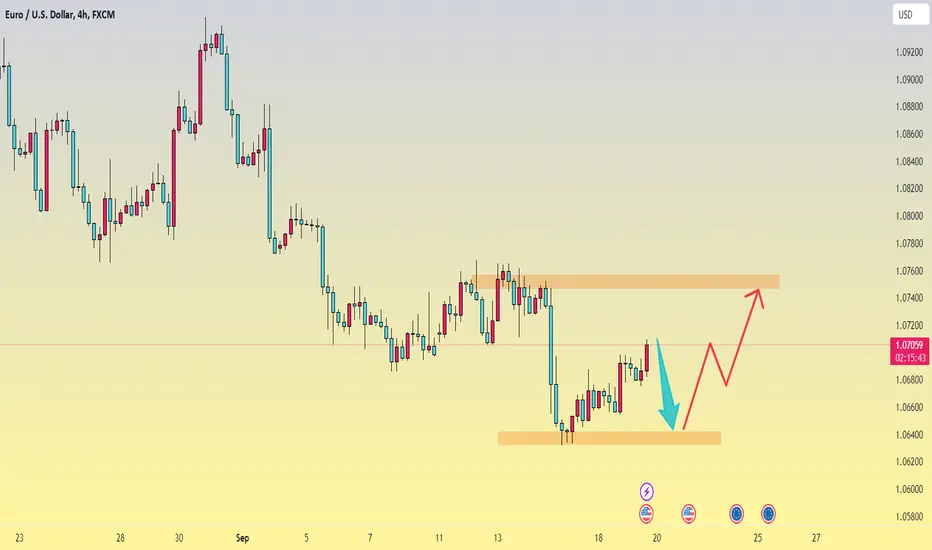
EUR/USD bounces off 6-month lowAfter falling to a new several-month low, the Euro (EUR) is attempting to recover some of its losses against the US Dollar (USD), pushing EUR/USD back to the 1.0650 region at the open. European doors on Thursday.
Looking at the technical picture we can see that the pair still holds the support level at 1.0640. So in general, if this support level is not broken, we can consider buying.
Gold prices continue to retreat, waiting for opportunitiesHello dear traders. Do you have questions about Gold today? Currently, gold is showing signs of weakness and trading at lows below 1930 USD, in the context of a strengthening US dollar due to Fed decisions.
Gold still shows its decline as it still cannot overcome the strong resistance level of 1946 USD. Therefore, the possibility of a significant decrease may invite many sellers to join the market.

Looking ahead, NZD/USD is down in the short termNZD_USD price rebounded to retest the 0.5929 resistance level which is likely to break this resistance and test the 0.5932 , 0.5937 level
But this is a strong critical level
So I think there is a high possibility
We will see a bearish move in the short term

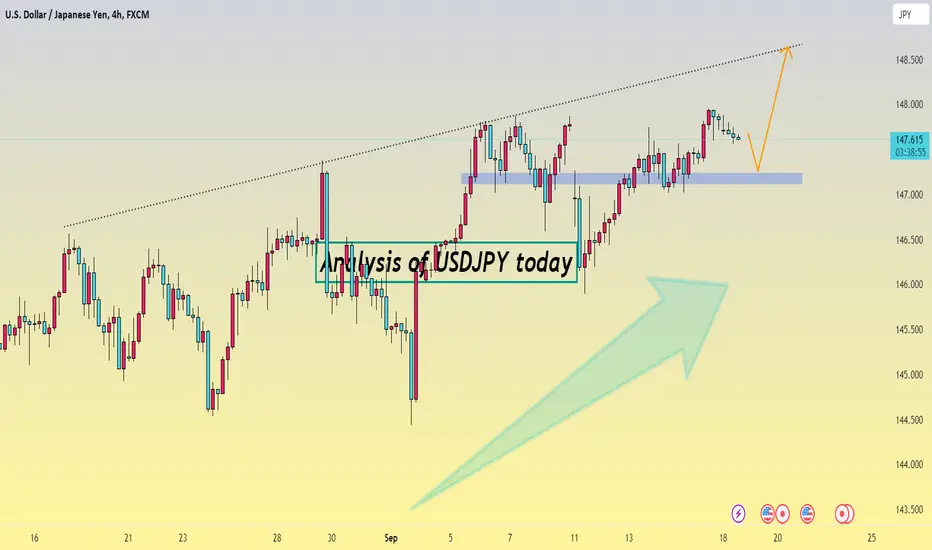
Analyzing USDJPY today, what should you note?Today, USD could rise further, but it is unlikely to threaten a significant biological boost at 148.86. To maintain the uptrend, USD needs to stay above 147.68.
BUT! The USD rose today with the DXY index around 105 points as Fed officials remained hawkish, which affected the USD/JPY pair.

The GBP/USD pair continues to maintain a downtrendThe GBP/USD pair maintained its sequential downtrend on Tuesday and remained confined below the 1.2400 level during the Asian session. Meanwhile, prices hit their lowest since June last week and a lack of buying power suggests the path of less resistance is now down.
How does gold fluctuate after news from the FED?Gold today traded stably around 1927 USD.
Yesterday's news update:
As you may have noticed, after the Federal Reserve (Fed) announced news about gold interest rates there was a strong reaction and spiked to a high of 1945 USD. However, when the Fed decided to keep interest rates unchanged at 5.25% to 5.50%, gold quickly returned to a lower price of 1927 USD.
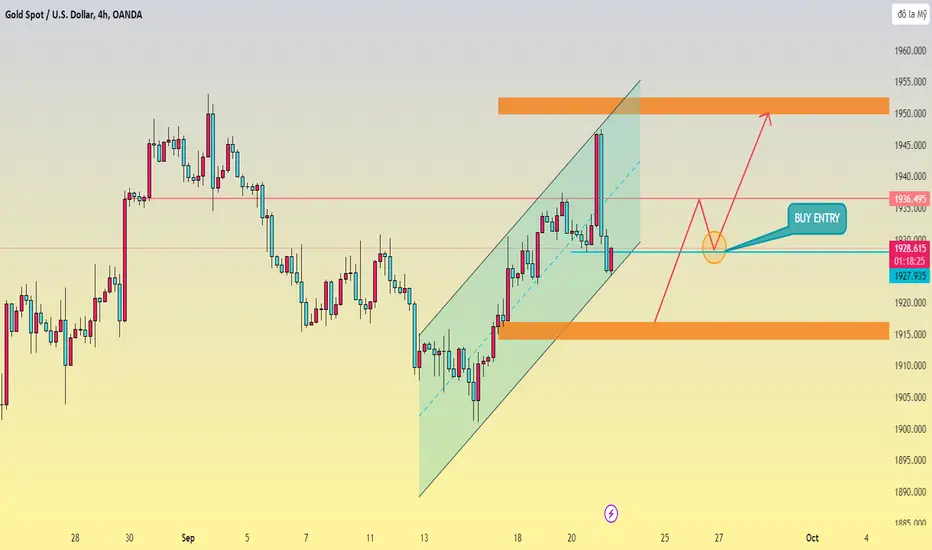
Looking at the technical picture we can see that Gold is in an uptrend after receiving support from the low of $1901. Given that Gold's main trend line is still intact, the possibility of Gold increasing is quite high. If the Fed reduces interest rates in the near future, Gold will likely break the resistance level of 1950 USD.
What should EUR/USD pay attention to?The fundamental and technical outlook for the EUR/USD currency pair is mixed. The US economy is performing better than the Eurozone economy, but the Fed is also predicted to raise interest rates more aggressively than the ECB. This could cause EUR/USD to weaken in the coming months.
Technical analysis
The price is in a minor correction uptrend, as marked in the chart. Don't get carried away by this and remember that the market is unpredictable, but for now I would mark this as LONG, for a short period of time. BUT! On the H4 chart and on the D1 chart, the EUR/USD currency pair is also trading in a downtrend.
NZDUSD should sell or buy?Hello investors!
Today, it seems that our expectations for the Discount NZD yesterday did not come true when it was traded within 0.5895/0.5920. There are signs that the rising momentum is forming, although only exploration. Currently, as long as the NZD remains over 0.5895 (with a small support level of 0.5910), it can be stronger but overcoming an important resistance at 0.5960 can be difficult. towel.
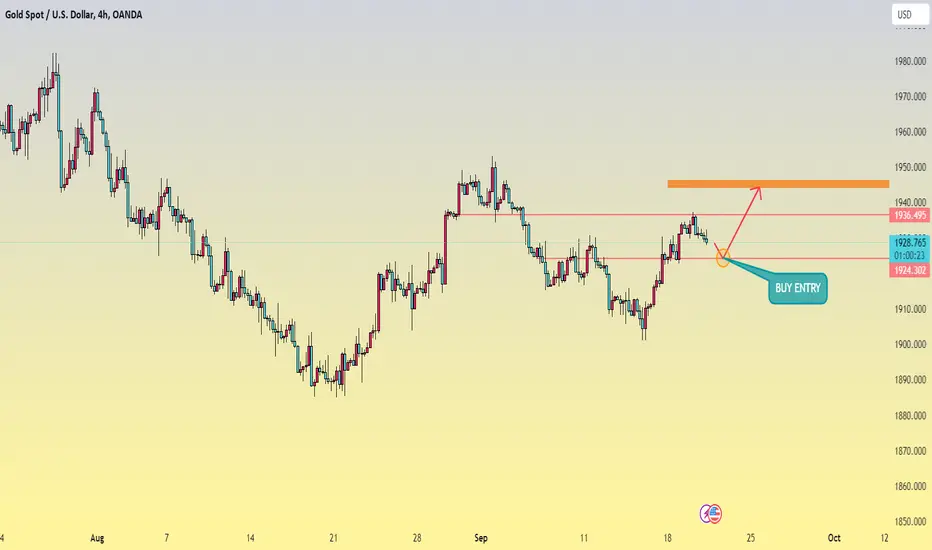
XAU- recovered thanks to USD cooling downToday, gold continues to increase mainly thanks to the decline in the value of the US dollar. The DXY index fell from over 105 points to 104.5 points.
It is likely that the Federal Reserve will keep interest rates steady in the 5.25% - 5.5% range at its upcoming meeting. This partly strengthens gold prices and creates an opportunity for gold to return to 1950 USD.
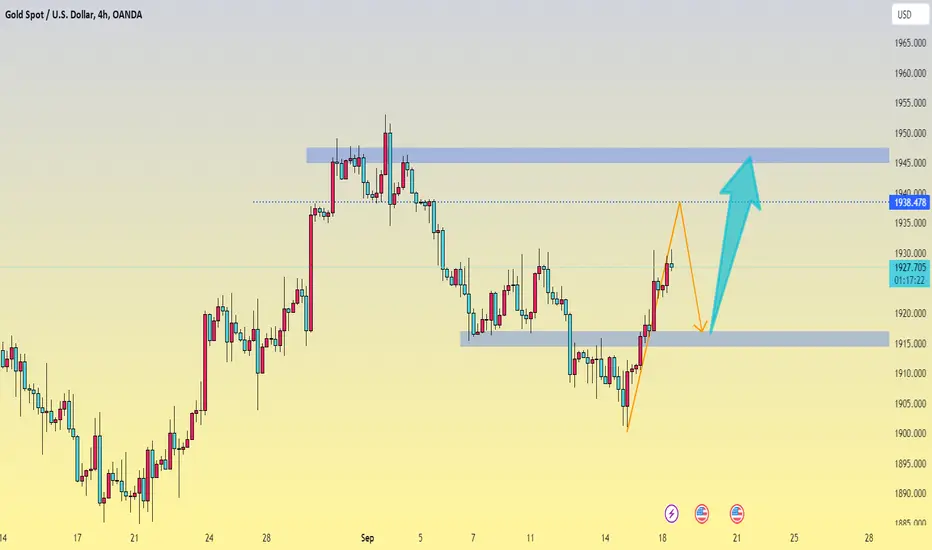
Gold price finds new peak in ascending trendGold prices were a bit volatile today attracting some buying pressure for the third straight day on Monday and are slowly rising towards the $1938 level. XAU/USD is now looking to build on the recent decent recovery from around $1,900.
Looking at the 4-hour golden frame, the downtrend line has been crossed, clearly showing signs of a change in sentiment, causing us to set our target at a higher level. Gold's next targets will be 1938, 1945 and ultimately 1950 USD.
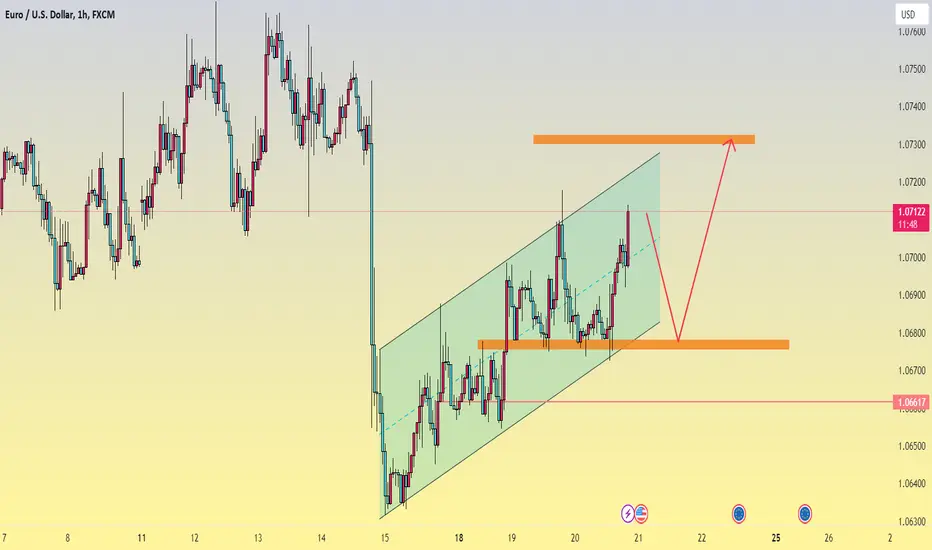
EURUSD analysis todayCurrently, EUR/USD is trading under pressure below 1.0700 during Tuesday's cautious Asian session. It is speculated that the ECB's completion of the rate hike will weigh on the common currency, while the USD's bearish action could support the pair.
However, the main risk to the EUR outlook is that the ECB turns dovish sooner than expected and/or growth momentum in the Euro area continues to decelerate sharply.
Gold prices have upward momentum in the short termGold prices increased short-term this week but were affected by information about the FED's upcoming interest rate increase. But recent results show a rapid recovery in the US economy in the second half of 2023. We can therefore see the Gold market likely to quickly return below 1900.
Analysis of NZD/USD todayHello friends.
NZD/USD started the new week on a positive note, trading higher around 0.5910 despite weak economic data from New Zealand. This currency pair received support for the US Federal Reserve's (Fed) decision to increase interest rates.
The pair is targeting $0.594.
USDJPY continues to have difficulty increasingHi everybody.
Today, the USDjpy market is still calm with little volatility. Currently, this pair of money is passing and trading around the price of 147.69. It seems that USDJPY is having difficulty seeking opportunities to increase prices when the pressure exceeds strong resistance of 147.80. Despite trying many times but still unable to overcome.

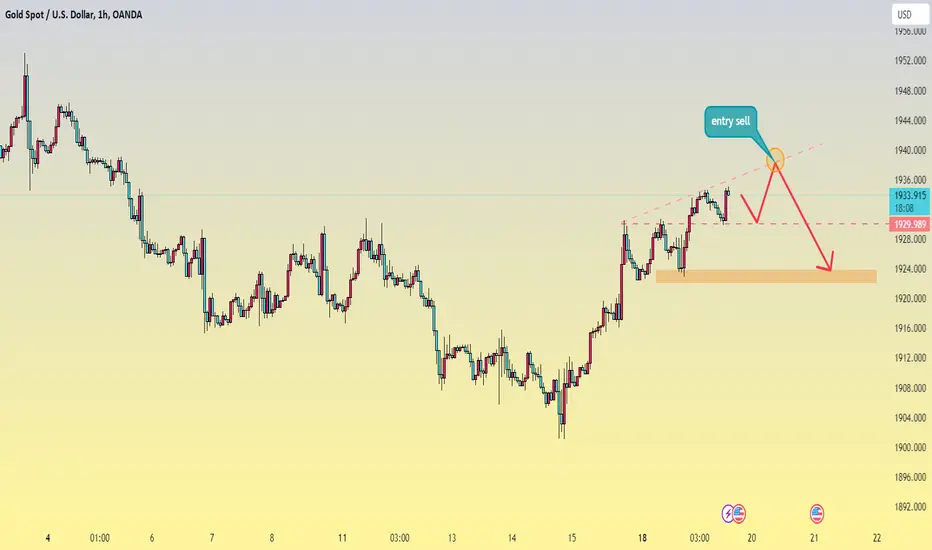
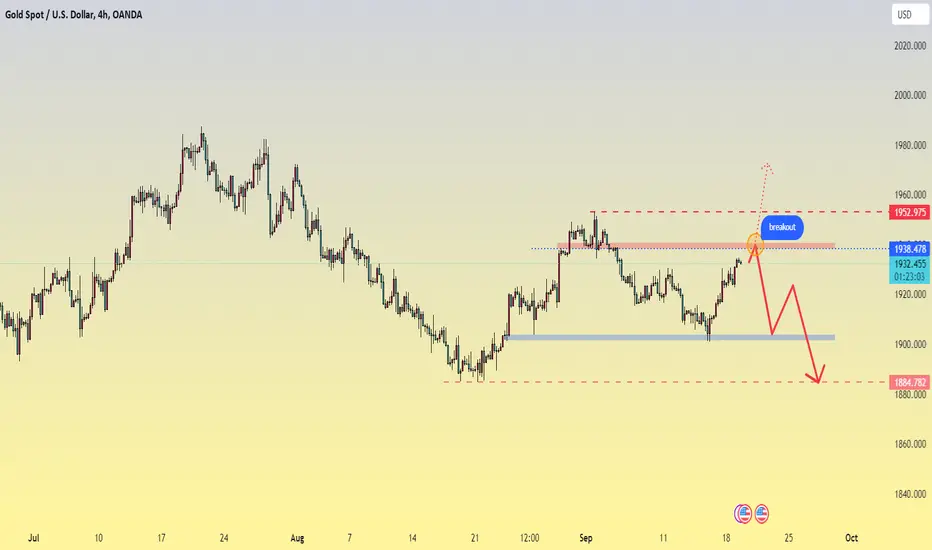
Testing resistance, ahead of XAU/USD declineAlselv hello everyone, let's comment on the Gold price this week.
Currently, today's gold price continues to show strength when trading around the 1933 USD mark.
However, high gold prices and the weakness of the Chinese and Indian currencies against the US dollar will continue to weigh on demand for gold.
Analysis of USDJPY todayLooking at the 4h chart of USDJPY we can see that there is a fluctuation of slight decline in today's trading session but this pair of money is still in the trend of increasing. Therefore, we should still stick to the script and target higher. If that happens, the psychological level will likely reach the psychological level of 148.50 JPY.