#JPPOWER INTRADAY TRADE SETUPGreetings Folks,
today i have prepared a setup of JPPOWER on NSE
the analysis is as follows
- the price made a required retracement
- i have marked SSL which is also very important support because if it gets broken it may indicate the start of a micro bearish trend
- there is also a minor range which is also marked in the chart
- the railway narrative seems to be overrated now so trade with cautious
dont play with fire, always use predefined stoploss
Intradaytrade

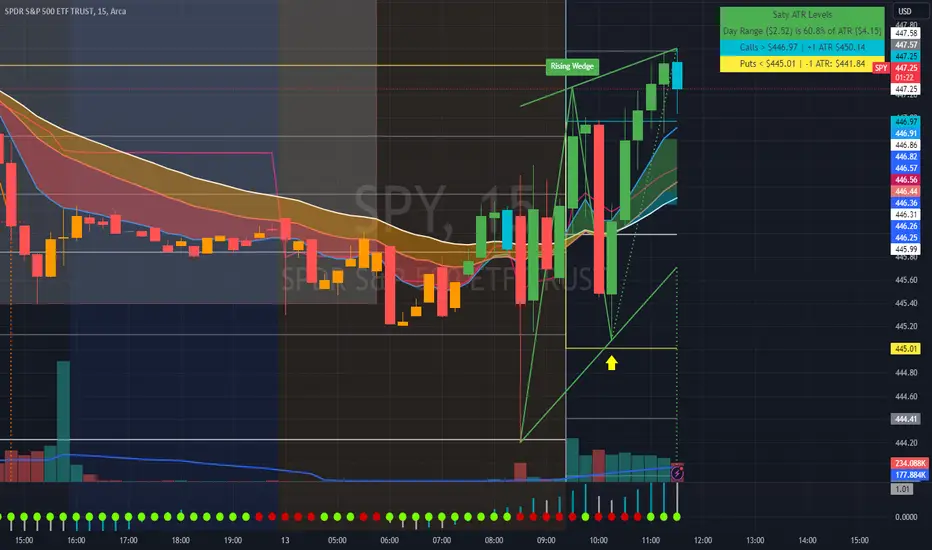
Trend reversal pattern tutorial on $SPY for intraday tradersAMEX:SPY
This is for intraday traders. While doing intraday trades watch out for a trend reversal around 10:15-10:30 AM to see market is showing any signs of trend reversal. If you catch this reversal right and keep your losses small, you can earn lot of money in a short period of time.
You can get entries on a shorter time frame and keep adding if market keeps moving up or scale out taking profit.
Today's trend reversal indicated by the yellow arrow happened around 10:15 printing a huge green candle.
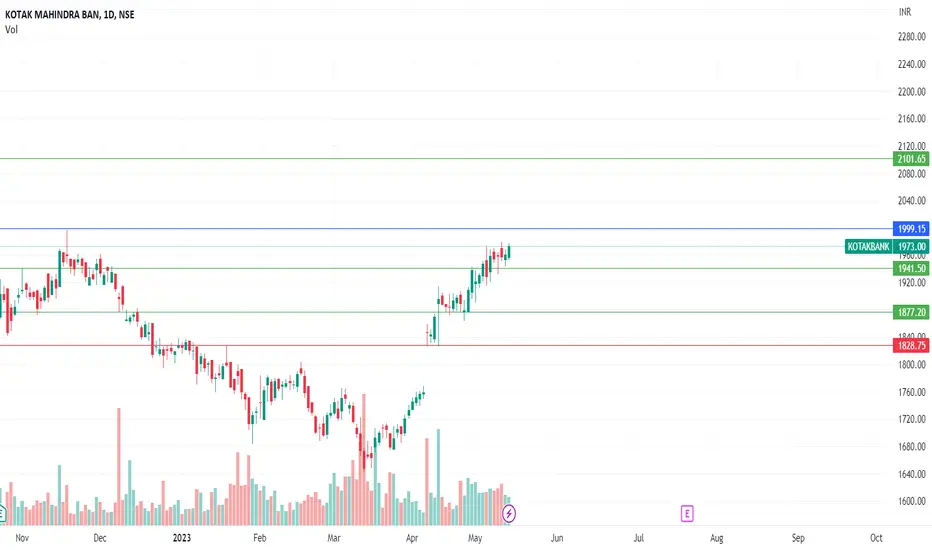
Good Move In KotakKotak Mahindra Bank making higher low each day from April. With strength in bank nifty it will help kotak to break its immediate target of 1999.15. So according to my analysis I would recommend one to go long on kotak with stop loss of 1930 for the target of 2100 if the kotak break 1999.15. Kotak will show strength and go up from now.
This analysis is based for educational purpose this does not guarantee for investment purpose please contact your financial advisor before investing.
Please write me if you see any drawback or any modification in the analysis.
[INTRADAY] #BANKNIFTY PE & CE Levels(07/09/2023) Today will be gap up opening in BANKNIFTY . After opening if banknifty sustain above 44550 level then possible upside rally of 400-500 points upto 44950 Level. And this rally can extend for another 400 points if it gives breakout of 45050 level. Any Major downside only expected in case banknifty starts trading below 44450 level.

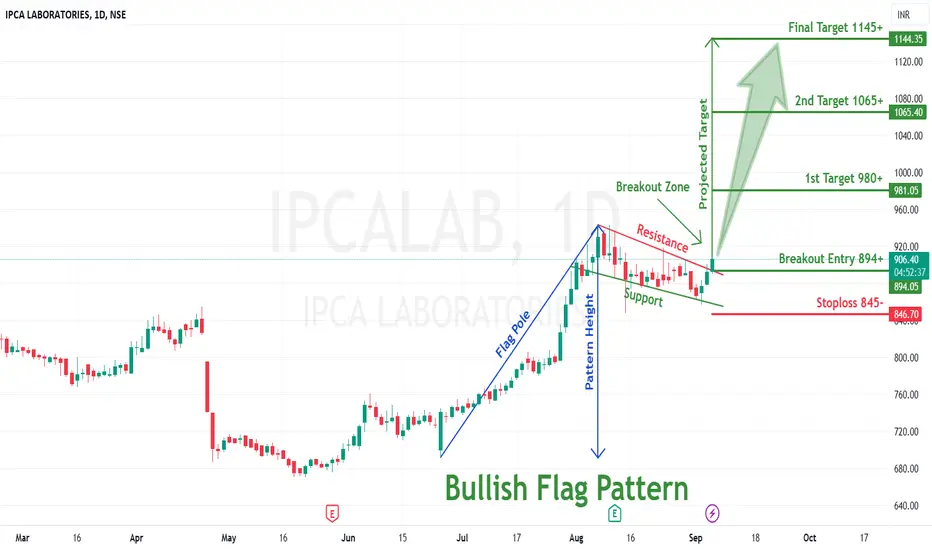
Bullish Flag pattern breakout in IPCALABIpca laboratories Ltd
Key highlights: 💡⚡
✅On 1Day Time Frame Stock Showing Breakout of Bullish Flag Pattern.
✅ Strong Bullish Candlestick Form on this timeframe.
✅It can give movement up to the Breakout target of 1145+.
✅Can Go Long in this stock by placing a stop loss below 845-.
MTF analysis from the monthly downWent from the monthly to the 15 min explaining my bias on each time frame. I'm going to be working with the daily TF going down but keeping in mind of the weekly and monthly bias

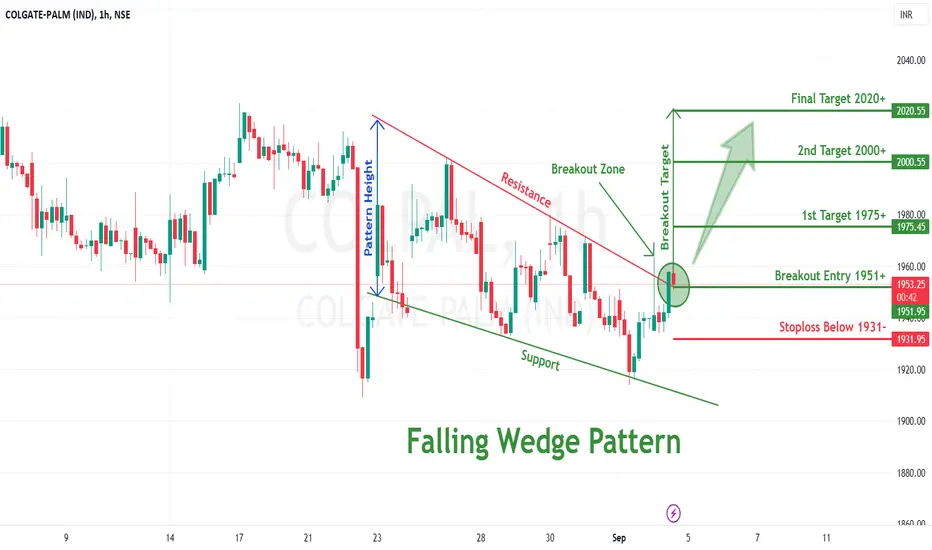
Falling wedge pattern breakout in COLPALColgate-Palmolive (India) Ltd
Key highlights: 💡⚡
✅On 1Hour Time Frame Stock Showing Breakout of Falling wedge Pattern.
✅ Strong Bullish Candlestick Form on this timeframe.
✅It can give movement up to the Breakout target of 2020+.
✅Can Go Long in this stock by placing a stop loss below 1930-.
#NIFTY Intraday Support and Resistance Levels - 04/09/2023Nifty will be gap up opening in today's session. After opening nifty sustain above 19450 level and then possible upside rally up to 19570 in today's session. in case nifty trades below 19410 level then the downside target can go up to the 19290 level.

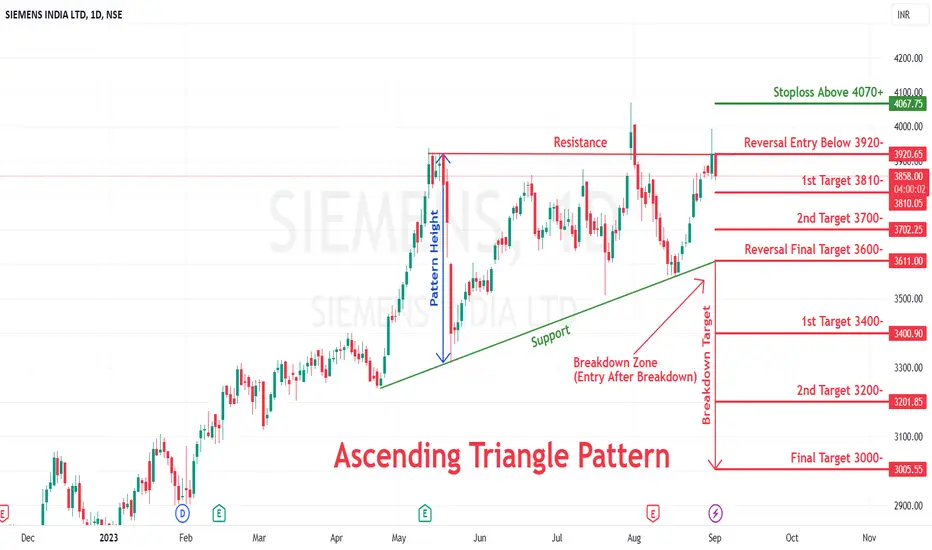
Reversal Ascending Triangle pattern in SIEMENSSIEMENS
Key highlights: 💡
✅On 1 Day Time Frame Stock Showing Reversal of Ascending Triangle Pattern.
✅ It can give movement upto the Reversal final target of below 3600-.
✅There have chances of breakdown of Support level too.
✅ After breakdown of Support level this stock can gives strong downside rally upto below 3000-.
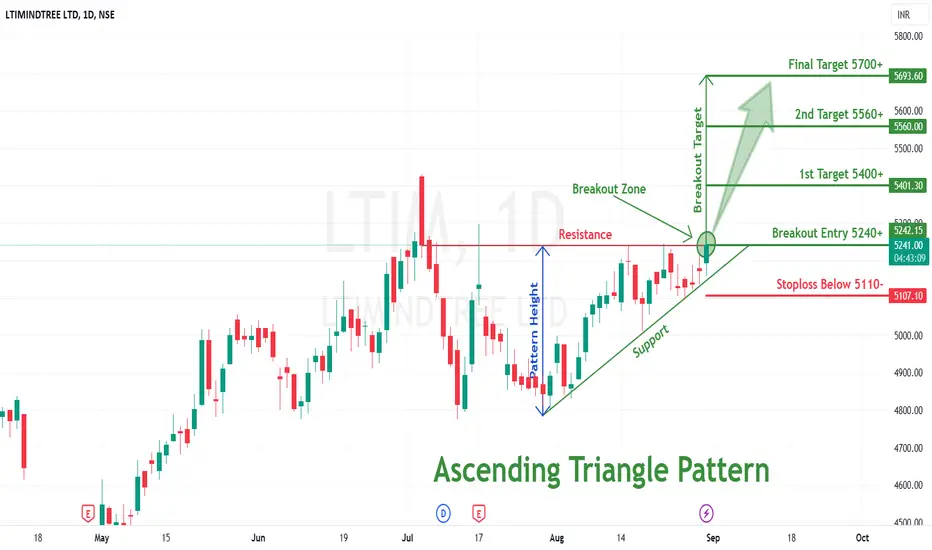
Ascending Triangle pattern breakout in LITIMINDTREELITIMINDTREE LTD
Key highlights: 💡⚡
✅On 1Day Time Frame Stock Showing Breakout of Ascending triangle Pattern .
✅Strong Bullish Candlestick Form on this timeframe.
✅It can give movement up to the Breakout target of 5700+.
✅Can Go short in this stock by placing a stop loss below 5110-.
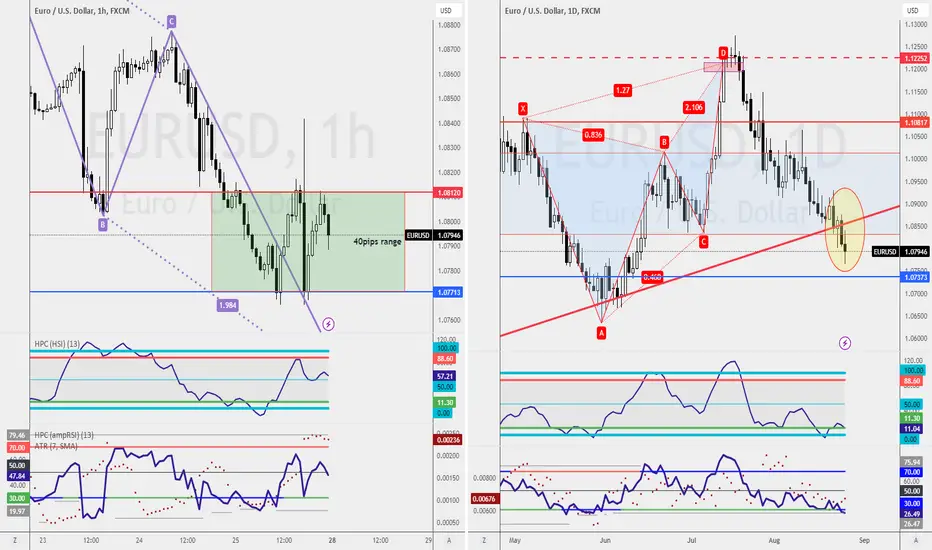
Bulls and Bears in the SpotEver wondered about the intricate tango between bulls and bears in the trading world? 🕺💃 Let's take a peek at the Euro-dollar's current moves on the weekly chart.
While the bullish trend has held its ground, recent weeks have seen the bears making their mark. But, there's a key level – 1.0637 – that holds the secret to shifting the scene. A break below this level could paint a different picture, turning a stronger bull into a weaker one.
Zooming into the daily chart, it's clear that the market is in a delicate balance. A breach below 1.0637 could mark the transition from bullish to bearish.
But it's not just black and white – both the four-hour and one-hour charts show their own stories of bearish movement. 📉📊
In this thrilling scenario, we have two trader groups with differing opinions. This is where the magic happens.
Both buyers and sellers can potentially rake in profits, timing their entries and exits just right.
Aggressive traders might pounce on a shorting opportunity with higher timeframe confirmation, while the conservative ones seek more clues before engaging.
Ready to dive into this intriguing trading universe?
Now, let's return to our weekly chart adventure. The trend line might have been crossed, but the true test lies in 1.0637.
For those braving the bearish waters, a retest at the trend line could be your golden ticket. 🎫🐻
But hey, you can always set your trend line alerts, adapting to your strategy.
If buying is your game, keep an eye on 1.0737 for a possible retest opportunity. On the four-hour chart, our aggressive traders spot a chance in the retest of the trend line.
Stay within those lines, and the shorting opportunity might be just around the corner. And for the one-hour chart enthusiasts, the red and blue lines reveal a potential 40 pips journey.
Got more to discuss? Want to crack the code of profitable trading in just 15 minutes a day? 🕰️
#NIFTY Intraday Support and Resistance Levels - 24/08/2023Nifty will be gap up opening in today's session. After opening nifty sustain above 19450 level and then possible upside rally up to 19550 & this rally can extend for another 100-120 points if it gives breakout of 19560 level in today's session. in case nifty trades below 19420 level then the downside target can go up to the 19300 level.

Timezone Sessions for intraday trading
Here is an examples of most often models for intraday
Asia range - London manipulation - NY reversal
Asia expansion - London consolidation - NY continuation
Asia range - London expansion - NY consolidation
Hunting liquidity stop losses
Hope you enjoyed the content I created, You can support with your likes and comments this idea so more people can watch!
✅Disclaimer: Please be aware of the risks involved in trading. This idea was made for educational purposes only not for financial Investment Purposes.
---
• Look at my ideas about interesting altcoins in the related section down below ↓
• For more ideas please hit "Like" and "Follow"!

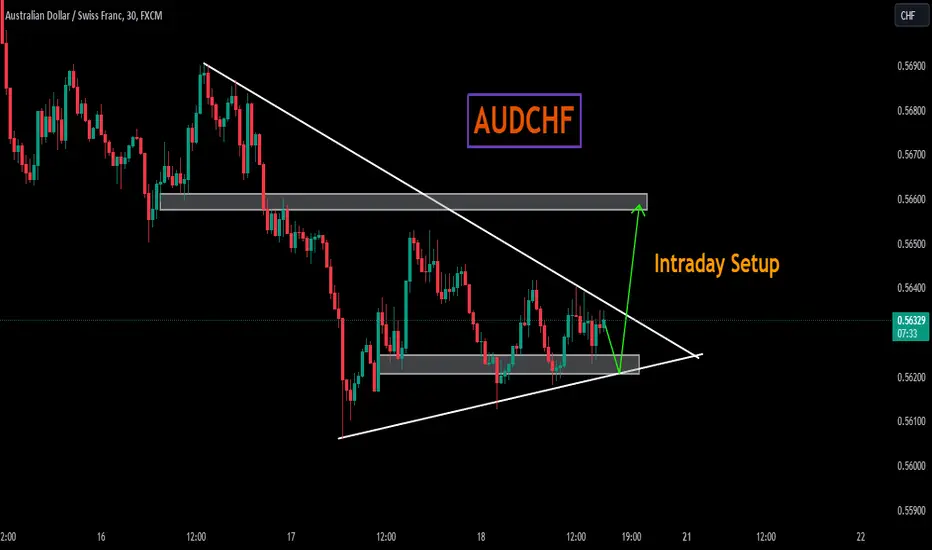
AUDCHFAUDCHF on intraday perspective going some bullish outlook.
As the price is in symmetrical triangle and it is printing HHs in triangle.
It is looking like the price is ready to break through triangle.
if breakout happens and to be hold, the optimum target could be 0.5660.
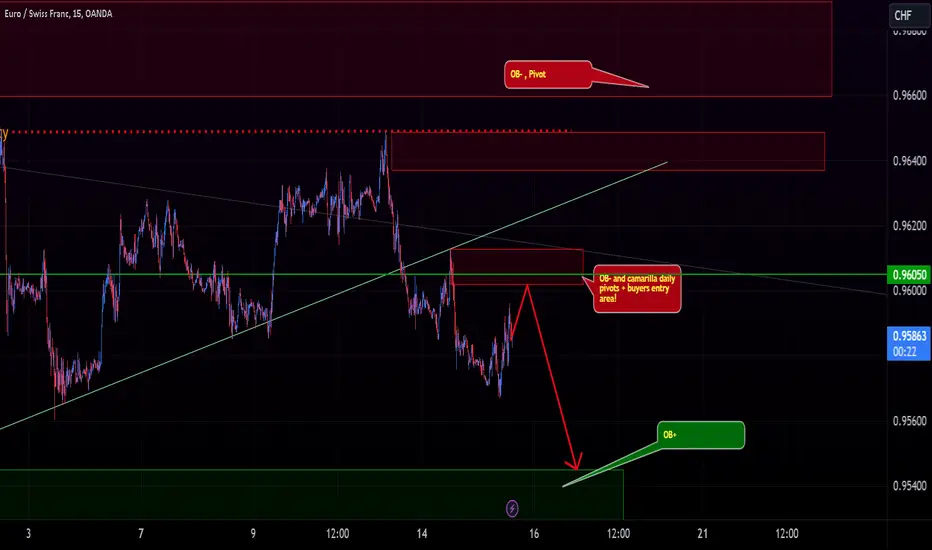
EURCHFCurrently there are Significantly more buyers in the market.
Any touch or reaction to 0.9600 is a chance to short for us!
TP is around 0.9550
#NIFTY Intraday Support and Resistance Levels - 10/08/2023Nifty will be gap down opening in today's session. After opening nifty start trading below 19620 level and then possible downside rally up to 19500 in today's session. in case nifty trades above 19650 level then the upside target can go up to the 19770 level.

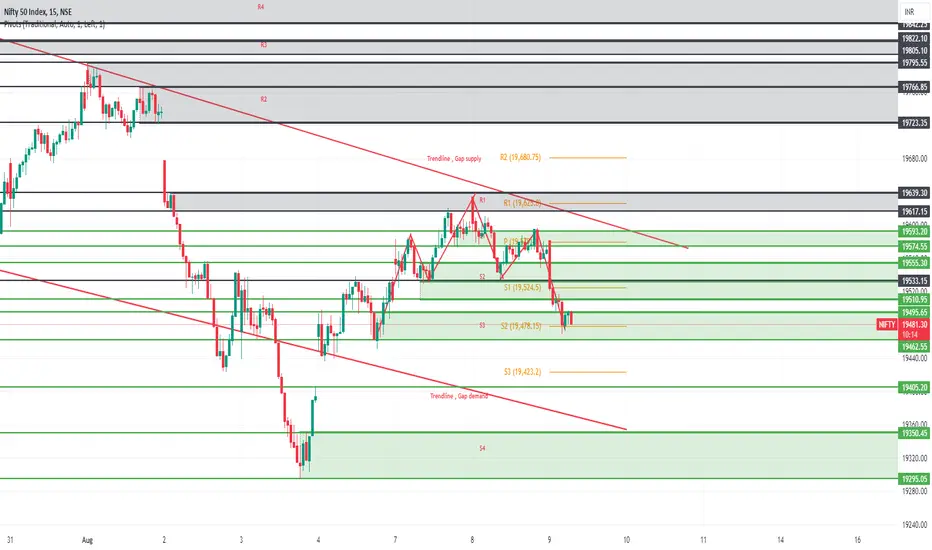
Nifty50 Analysis and Trade Plan for August 09Supply and demand zones marked on yesterday's chart hold good for tomorrow as well.
Black Line zones - Resistances
R1 - 19617-19639
R2 - 19723-19795
R3 - 19805-19822
R4 - 19842-19876
Green line zones - Demand
S1 - 19593-19574
S2 - 19555-19510
S3 - 19595-19462
S4 - 19350-19295
Analysis:-
Same as yesterday, Nifty has not moved majorly from yesterday’s OHLC. Hence Requoting “Nifty is in the process of forming a retracement, Lower High for the Downtrend formed. But if it moves strongly above 19684-19733 which is the 78.6% to 88.6% retracement levels of the previous major swing, which also coincides with the Gap supply zone and out of the falling channel that has formed, then there are high probabilities that the market trend would change to an uptrend.”
19530 will act as an important support level, for 2 days, the market has been taking support at 19530.
Trade Plan:-
If the Market opens a gap up –
1) Will look to short the market based on setup confirmation till the Gap filling / Trendline support/R1 or till 19530 based on price action and run further as needed.
2) Can go long only after consolidation breakout , but too many sell zones above, so may not be keen on this trade unless Nifty crosses and sustains above 19876 zone. Will watch for major resistance zones marked above – R2,R3,R4.
If the Market opens flat -
Will wait for Price action, may be a rejection at R1/TL Resistance again till 19530 or below or could be a consolidation again till 19530 and then move up.
1) Possible short scalp from TL rejection till 19530 based on setup confirmation or could wait till 19530 breaks and then ride till next support level of 19460.
2) Will go long only post consolidation breakout of the smaller TL that has formed today but would be cautious at the major Trendline above and also the gap supply above it, will be keen on price sustainability above the major Trendline till the gap zone of 19738.
If the Market opens a gap down -
1) Will look to short the market if any setup confirmation signal is obtained till the demand levels as marked based on where it opens either at S2/S3/S4 levels. Will be keen to short if there is a huge gap down at 19400 based on setup confirmation. If the price takes support, one may wait for consolidation up moves.
2) Will look to go long only if any setup exists post 75 minutes of consolidation/price sustainability at the higher levels from the Possible demand levels.
Please check for Demand zones below 19200

Nifty Intraday HS Pattern LevelsNifty has formed a Head and shoulder pattern in the intraday time frame, and has broken it's neckline at 19530, so one can consider to go short at the retest of the same 19530, with a bearish candle pattern confirmation or any other technical setup confirmation.
19423 - 19430 target, next support zone.
Happy trading!
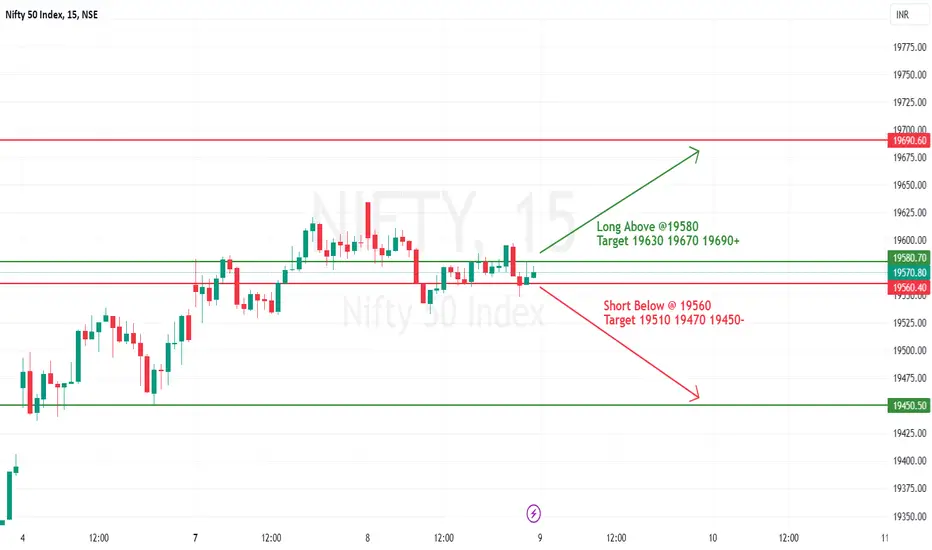
#NIFTY Intraday Support and Resistance Levels - 09/08/2023Nifty will be gap up opening in today's session. After opening nifty sustain above 19580 level and then possible upside rally up to 19690 in today's session. in case nifty trades below 19560 level then the downside target can go up to the 19450 level.
Baja Finance Intraday Trade Levels and AnalysisThe stock is reversing from demand zone after 4 days of consolidation in the same zone, also there is a double top breakdown in Daily time frame, and the stock is poised for a retest of the Double Top neckline area.
75 minutes shows Double bottom very evident with RSI divergence and RSI moving into 70+ strength zone, an up move of odd 7200-7400 levels is possible.
Hence with the above levels, one can consider a long Intraday trade with an RR of min 1:1 or max even 1:2.

Wipro Intraday Price Action Levels for tomorrowPrice compression is seen in 75 mins time frame, if the price sustains above yesterday's close level, the marked levels can be used for Intraday target sell zones.
The RSI is also moving up from oversold to a strength zone of 60-70+.
The price may move to fill the gap at 414-415 zone.
An intraday trade may be possible with the marked levels, above 410 with an RR of 1:2.

BankNifty Future Analysis for 7th August 2023BankNifty Future Analysis for 7th August 2023
As per our #analysis for #BankNiftyFuture, we are expecting these Intraday levels Tomorrow, kindly check the charts on 15 min time frame and act accordingly.
#IntradayLevels
Disclaimer: All the provided levels are for #educational purpose only, please do your own analysis before doing any trade in the live market or consult your #financial advisor before act.
Follow Us For More #Updates in Future

#NIFTY Intraday Support and Resistance Levels - 04/08/2023Nifty will be gap up opening in today's session. After opening nifty sustain above 19430 level and then possible upside rally up to 19550 in today's session. in case nifty trades below 19390 level then the downside target can go up to the 19270 level.
