💶💴EUR/JPY The rally is not over yet💶💴EUR/JPY The rally is not over yet.
💶Euro is showing signs of strength in the current week.
💶 Looking at the Unemployment rate in the Eurozone, it stands at 6.6%, the lowest on record.
💶Inflation is already close to 10% and on the 31st when the flash year-on-year reading is forecast to be 10.1%
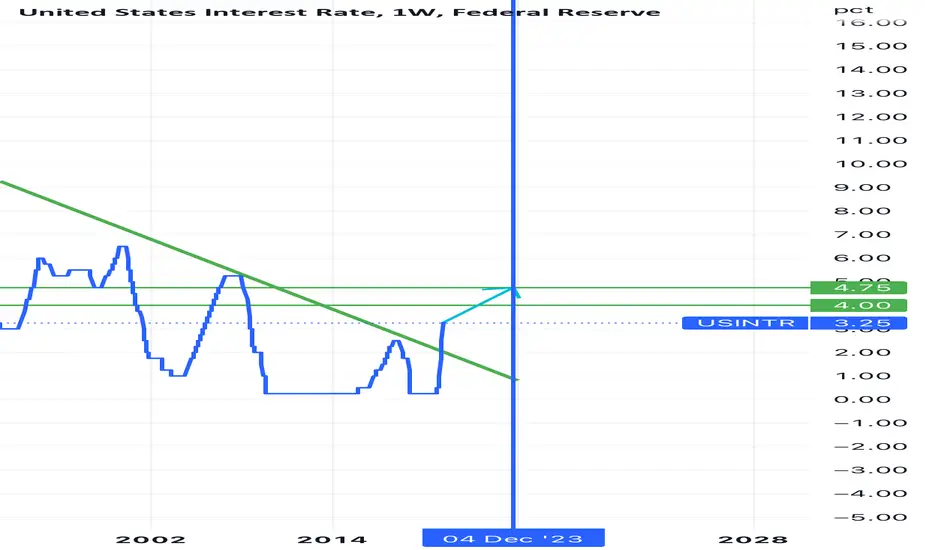
💶Interest rates have been raised by 75 basis points and the market is betting on another 75 point hike to 2%. The decision will be made on Thursday 27 October.
💶The consumer sentiment indicator which is off its lowest levels in years has started to rise slowly and the market expects the positive trend to continue in the coming months. There will be another reading on 28 October.
💶💴On the other side of the globe.
💴In Japan, no change.
💴Unemployment Rate low at 2.5%
💴Inflation low 3%. Japan is one of those countries that has not been hit by Inflation as much as Europe and the USA.
💴Interest rates at -0.1%. Still negative from 2016. Hence these falls in the Yen. When other countries raise rates causing their currencies to strengthen, their strength against the Yen increases.
💴For now, there are no increases on the horizon. The Bank of Japan says it has no intention of changing its monetary policy.
💴But the government doesn't want the Japanese Yen so cheap either, hence in recent days we have seen sharp falls which were interventions to stop the Yen weakening sharply against other currencies.
💴I don't think this will stop investors from pushing prices up again.
Turning to the chart.
📈It probably doesn't need to be told to everyone that we have been in an uptrend since 2000.
📈In the last few days, after the interventions and the attempt to dump the price which was momentarily pushed upwards. This took place at support levels zoned between 143 and 145.
📈 We do not see any signs that the price is going to make any correction in the coming days seeing such big pullbacks on the 1D candles.
📈In order to determine the target we move to the 1M chart.
📈Where after measuring the 2 biggest downward waves using fibo. We come out with a cluster at levels of 160 which seems a very likely scenario if the policy of the central bank of Japan remains unchanged and we enter a time of growths on the Euro.
📈Entering at the current moment and setting a stop below the recent price pullbacks after the interventions with a take profit at the 160 level brings out our best profit/risk ratio so far since I've been posting at.
🚀If you appreciate my work and effort put into this post I encourage you to leave a like and give a follow on my profile.🚀
Intrestrates
S&P 500 Daily Chart Analysis For September 30, 2022 Technical Analysis and Outlook
Repeated dead-cat moves around completed Inner Index Dip 3760 were in order throughout the week, along with the partial completion of our interim rebound target to Mean Res 3775. On Friday, the index penetrated the Inner Index Dip 3760 and is on its way to our next specified target Outer index Dip 3530 - Possible short-term moves are leading to Mean Res 3720. Next Outer Index Dip 3450 is in the making.

Dollar Index Forecast and The Increase In Interest RatesThe Dollar has been on a very strong bull run as we track it week to week. We can see a clear channel has been broken, and price interacting with quarter point. In addition. price has corrected itself by 50%! What do you think is the probability of price popping back into the channel ? Love to hear from the followers of this channel!

Interest rate prediction 2024So i predect another 0.75 and 0.75 hike with total 1.5
Its clear in chart
shorting gold and silver.I missed an entry when gold and silver were going up and providing setups for a long and the only reason I did it was that I concentrate on enrty with GBP/USD. All day this pair was not giving you anything I guess because of Putin's speech and the upcoming FED interest rate. I planning to go short on GBP/USD.
Let see.

2 Year Treasury Bond Yield vs FED Funds RateThis post is intended to show the current gap between the market for the 2 year US treasury yield on bonds and the official funds rate, and why the market is forcing central banks hands into raising interest rates when the market is in such a fragile state in ability to support and maintain debt at heighten interest rate levels.
Simply put, bond market are crashing (i.e. no one wants to hold onto treasure bonds at present because they are yielding very little / people are losing faith in governments ability to uphold their debt obligations / competition in the market for credit is rising etc. etc). All these factors play into buying selling behavior and is repriced in the market.
As a bond or lone has a fixed bond or repayment structure ($amount), if the capital price the bond changes hand in the secondary market is lowered, the effective yield from the bond goes up. For example if a bond is made for $10,000 and requires a 10% interest rate (i.e. $1,000) per specified period, then if this loan / contract / bond (same thinking) is changed hands in the secondary market and sold for $5,000, the new own still receivers the conditions of the prior arrangement. Hence $1000 per period. As the price was $5,000, then the interest or Yield on that bond is now 20% (i.e. $1000 / $5000 x100 = 20%).
As new credit is competing against the secondary market (i.e. you could loan your money out to a new loan or you could buy an existing loan (Bond) on the secondary market), this is how the bond market drives interest rates.
Complicated but hope this makes sense.
in summary, falling bond prices cases rising yields or interest rates. Raising bond prices causes lower interest rates.
Central Banks play in this market as a market participant with an unlimited check book (this is how new base currency or M1 enters the market ( QE - Quantitative Easing) or is removed from the currency supply (QT - Quantitative Tightening ).
If Central Banks want interest rates to rise, they flood the market with bonds, dropping the market prices with excess supply and causing yields to rise. If they want interest rates to drop, they soak up supply in the market of bonds, causing prices to rice and yields (interest rates to drop).
This process is called 'Open Market Manipulation'. AKA planned market manipulation at it's best.
www.federalreserve.gov
The 'official funds rate' is just a forecast which shows how the Central Bank plans to manipulate the bond market until it's next meeting.
Interest rates on loans / bonds etc should be viewed as a measure of risk of default. High interest rates reflect the reward on offer for lending your currency out and the risk you will not get it back.
In short, Market conditions (such as inflation ) changes investors view on risk. When Central Bank manipulation of the bond market goes our of whack with the risk to lending in the market, we see large gaps between the yield curves on bonds between the official funds rates issued by the Central Bank .
This gap is clearly shown this chart, comparing the 2 year yield against the Official FED Funds rate (the interest rate you hear about on the TV).
History shows the 2 year is a good leading indicator on what Central Banks will do with interest rates.
Make no mistake, the market and inflation is forcing Central Banks to raise interest rates.
I very much question the robustness of 'the economy' to handle higher interest rates at present.

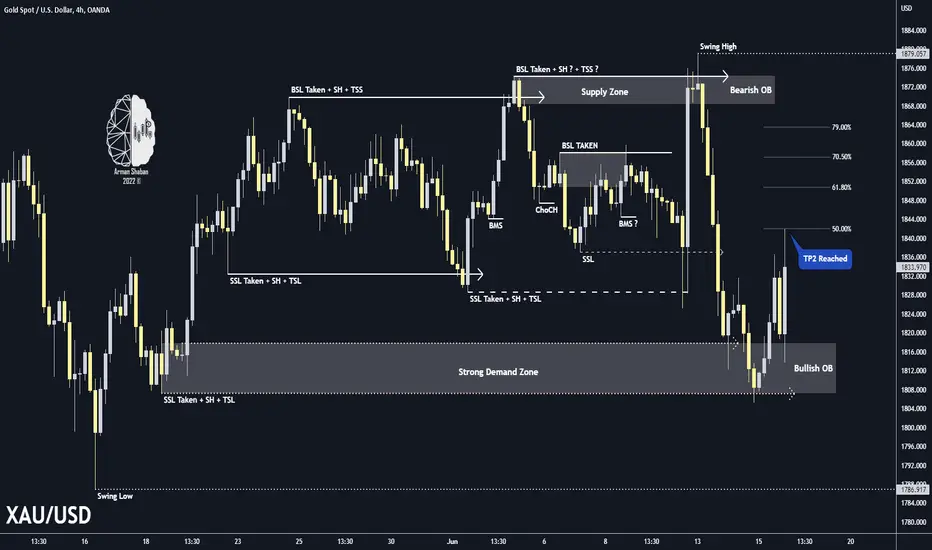
XAUUSD 2nd TP Reached : +170 Pips ✅✅ TP1 Reached ✅ ~ $ 1831
✅ TP2 Reached ✅ ~ $ 1842
Last analysis : As you can see, after collecting liquidity below $ 1807, the price faced demand and increased by $ 20, now trading in the range of $ 1827, the first scenario is to rise to the levels indicated on the chart, respectively: $ 1831, 1842, $ 1851, $ 1857 and $ 1863 ...! The second scenario is rejecting from $ 1824 to $ 1831 zone and moving to the $ 1804 and $ 1787 targets.
Follow us for more analysis & Feel free to ask any questions you have, we are here to help.
⚠️ This Analysis will be updated ...
👤 Arman Shaban : @ArmanShabanTrading
📅 06.16.2022
⚠️(DYOR)
❤️ If you apperciate my work , Please like and comment , It Keeps me motivated to do better ❤️