INJ Analysis: 300% Profit Potential (1W)AI Sector Symbol Analysis: 300% Potential
The AI sector symbol is currently undergoing a significant correction, and it seems to be forming a diametric pattern, with the price now in Wave D. This wave could potentially end within the green buy zone, after which we expect the price to transition into Wave E.
It's important to note that this analysis is based on a weekly timeframe, meaning it will take time to unfold. Additionally, the entry zone is quite large, so a gradual REBUY strategy is recommended to manage risk effectively.
Target Levels are clearly marked on the chart, offering clear points of interest for traders.
However, be cautious: A weekly candle close below the invalidation level will invalidate this setup, so always monitor closely.
For risk management, please don't forget stop loss and capital management
When we reach the first target, save some profit and then change the stop to entry
Comment if you have any questions
Thank You
Inusd

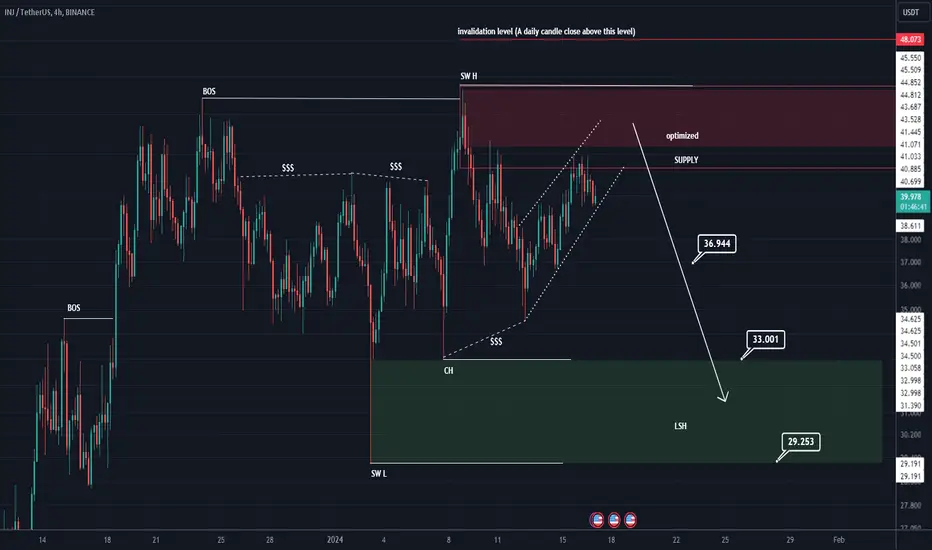
INJ will have a drop aheadinj has momentum weakness and has recently accumulated two cash pools and has a high chance of dropping.
A liquidity pool can be seen at the bottom of the chart, and below this liquidity pool is the LSH (long shadow) range, which is a good indicator.
I specified the targets on the chart.
Closing a daily candle above the invalidation level will violate the analysis
For risk management, please don't forget stop loss and capital management
When we reach the first target, save some profit and then change the stop to entry
Comment if you have any questions
Thank You