Shiba inu triggering inv h&sMeasured move should take price action above the 1day 200ma. I think it will ultimately hold candle body resistance at first but if it does something similar to what quant did it may flip it to support sooner than later. *not financial advice*
Inverse Head and Shoulders

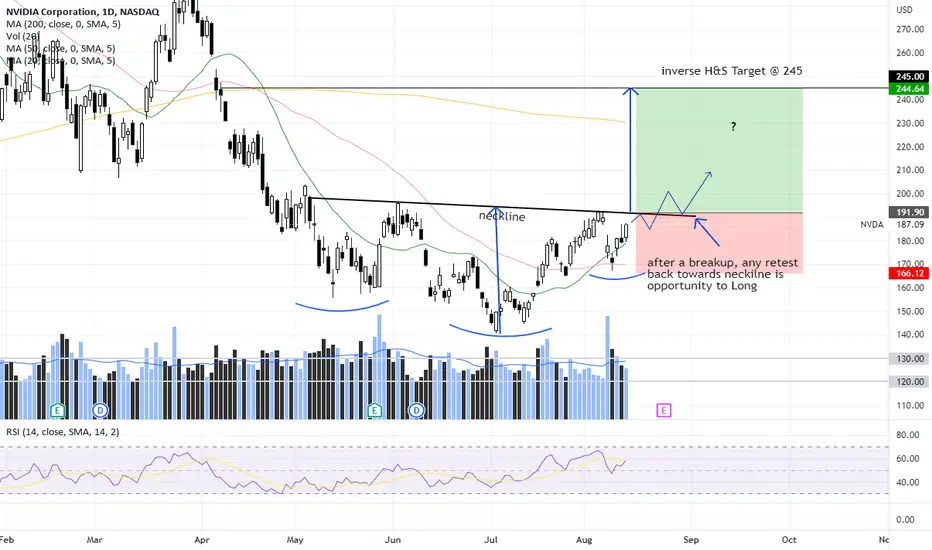
NVDA - inverse H&S (breakup soon?)Breakup looks likely looking at overall market momentum. Earning expected on 24th Aug after market close but could breakup before that.
Should it break up, any near term retest back towards neckline will be an opportunity to stake/add.
Manage positions with trailing stops.
Disclaimer: Just my 2 cents and not a trade advice. Kindly do your own due diligence and trade according to your own risk tolerance and don't forget that money management is important! Take care and Good Luck!
Link may be ready to breakout here.If it confirms the breakout here the target is $12.50. *not financial advice*

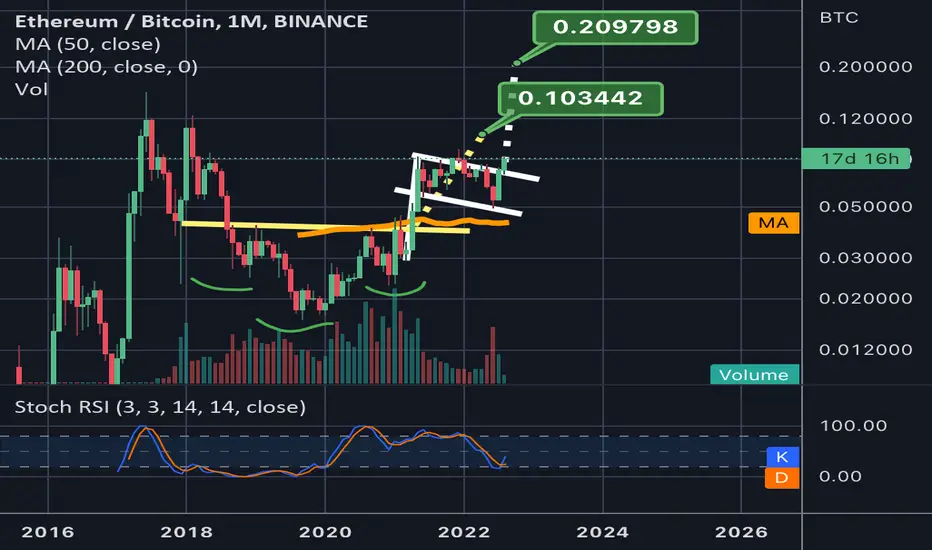
ETHBTC days away from 1day chart goldencross.Here we see the monthly logarithmic chart for the ethbtc pair so the impending golden cross is not shown here. It is only a few days at most away from crossing and we can see here on the log chart that the ethbtc chart’s priceaction is well above an inv h&s pattern and likely has validated the breakout of this pattern even though we haven’t reached its full measured move target just yet. We can also see how price action is now poking a monthly candle above this monthly bullflag in white here. I think it is very possible for ethbtc to continue pumping past the 1day golden cross on its way to hitting both of these chart pattern’s (bullflag and invh&s) targets. However there is such huge anticipation for Ethereum switching over to proof of stake that there is a high probability since the date for it has been announced so far in the future, that it will be a buy the rumor sell the news type of event that pumps up until the event then dumps the week or day of. The one possibility that could keep this from being a sell the news event however is If enough people post predictions that it will be a sell the news event…in which case if everyone in the herd is expecting a sell the news dump it could even continue to pump day of. For now though, it seems the overall sentiment believes the switch will lead to a pump so sell the news has a higher probability at the moment. That could change the closer we get if more and more analysts and youtube personalities start warning of a sell the news event. Quite the paradox really lol. In the short term however I think continued upside after the golden cross is likely, but if we dump on the day it switched to proof of stake the golden cross can still easily be a fake out that flips back into a death cross soon after, so it’s wise to stay vigilant. *not financial advice*
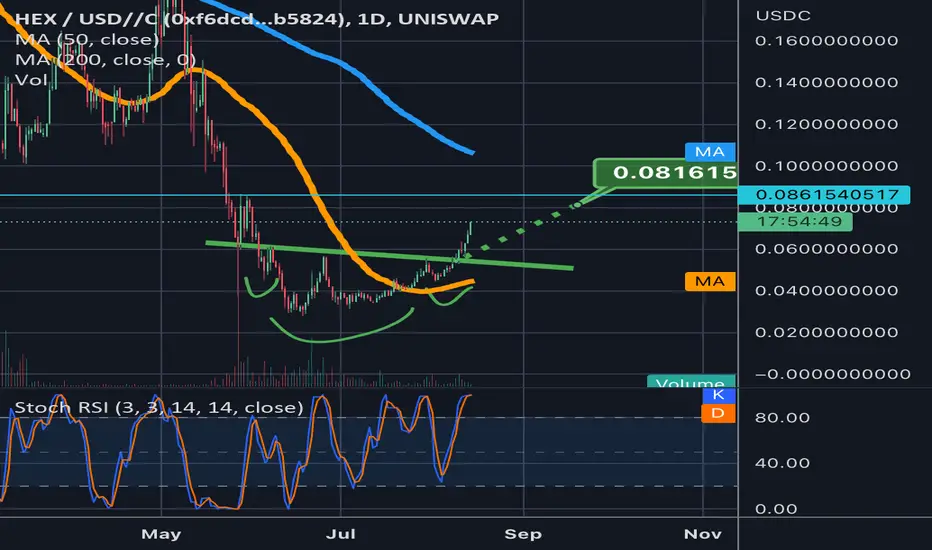
HEXUSDC pair appears to be confirming inv h&S breakoutI don’t own any Hex. It’s not on any exchanges I typically use and have not used anything like uniswap before so its unlikely I will ever own some. Knowing Richard Heart, it wouldn’t surprise me if this thing eventually became some sort of Ponzi scheme. However also knowing Richard Heart’s resilience, it wouldn’t surprise me if the previous ath it had will be its final ath. I wouldn’t be surprised if it found a way on the next big bull impulse to even double that ATH or higher. So if it did happen to appear upon an exchange I used at these current price levels I would probably grab a small amount just in case it were to retest its ath or surpass it. It already is going to make a 50% gain just by hitting the current inv h&s measured move breakout target. From there I could see it inching a little higher to test the teal horizontal or just correct right at the target. Either way once it corrects it will start forming the right shoulder to an even bigger inv h&s pattern which will have an even bigger measured move breakout target. This is not a crypto I’d ever consider buying at the prices it was at during the previous top but right now could be an opportune risk/reward ratio to roll the dice on Richard Heart being able to milk this project at least one last uptrend. *not financial advice*
Is Solana ready to confirm its inv h&s breakout?We can see Solana has successfully retested the bottom green neckline as support and is seeing a nice green cancel bouncing up after the retest greatly increasing the probability that it will confirm it’s inv h&s breakout and head to the mid $50s for it’s breakout target. On the way to that price target, we will clear the neckline of a slightly bigger inv h&s pattern and if we can maintain that neckline as solidified support as well then we should continue to head to its even higher breakout target not long after reaching the first one…we could see a correction after going above the higher neckline that takes us back to retest that neckline as support just as we have the lower neckline. *not financial advice*

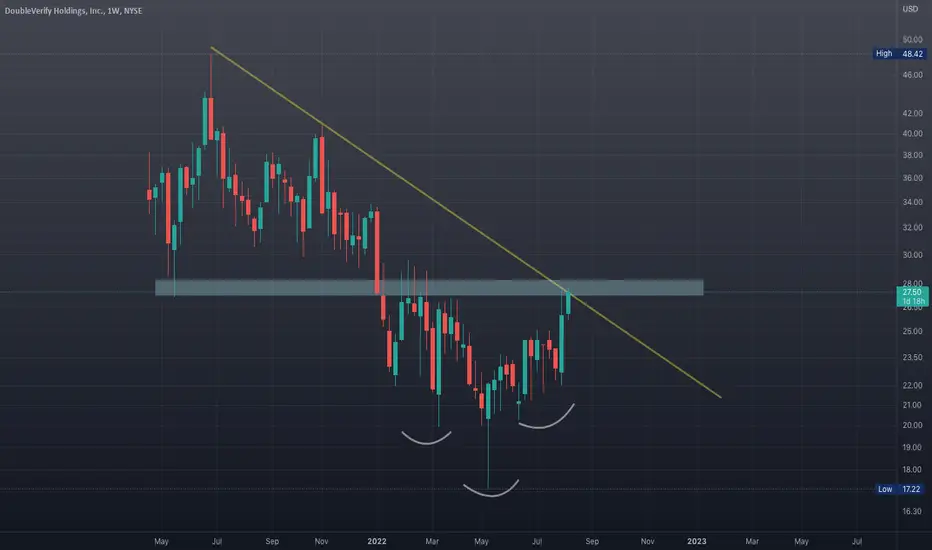
WATCH $DVBullish
- Pending to break downward trend line
- Forming Inverse head and shoulders
- Building base
- Positive FCF
- Positive Income
- Funds accumulating
Entry idea
- For members
Stop loss depending on entry and risk appetite. But always set meaningful stops.
“The successful warrior is the average man with laser-like focus”
Cheers and happy trading!
Keep Tata motors stock in watchlist.Tata motors stock has been in bull run since last 2 years.
Observing the weekly chart shows a clear formation of Inverted Head & shoulders pattern in the stock.
It can test the neckline definitely in near future which is around 500-520 which is almost 7-8% from CMP.
A weekly closing above 520 levels or above 52 week high of 537 can make the stock move to its ATH levels of 600 and above.

Basic Attention BAT - Huge breakout soon! + Head and Shoulders
BAT successfully completed an ABC correction from the last impulse wave and is potentially prepared for another massive impulse wave to the upside!
The chart is printing a local inverse head and shoulders, bullish reversal pattern, and we are really close to a breakout.
This can be a good breakout trade above the head and shoulders + trendline (channel).
The first profit target is below the all-time high, because I think we will need more time for a possible consolidation here, and then we can go much higher.
The price is still below the key level of 0.444 USDT, so we still need a confirmation from the bulls.
I recommend buying a breakout at a new swing high (0.4595 USDT).
I expect tremendous gains for selected altcoins. You can find them in the related section down below.
For more ideas, please hit "Like" and "Follow"!

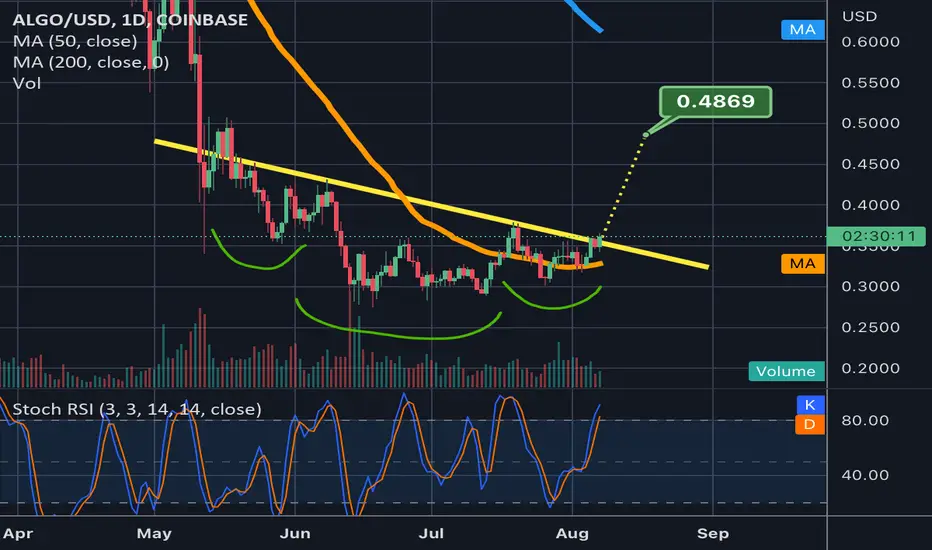
Algorand finally poking above the inv h&s neckline.For now we won’t know exactly where the measured move target will be until we know clearly where we officially break above the neckline as well as flip it to solid support. Will update this idea once it happens. *not financial advice*
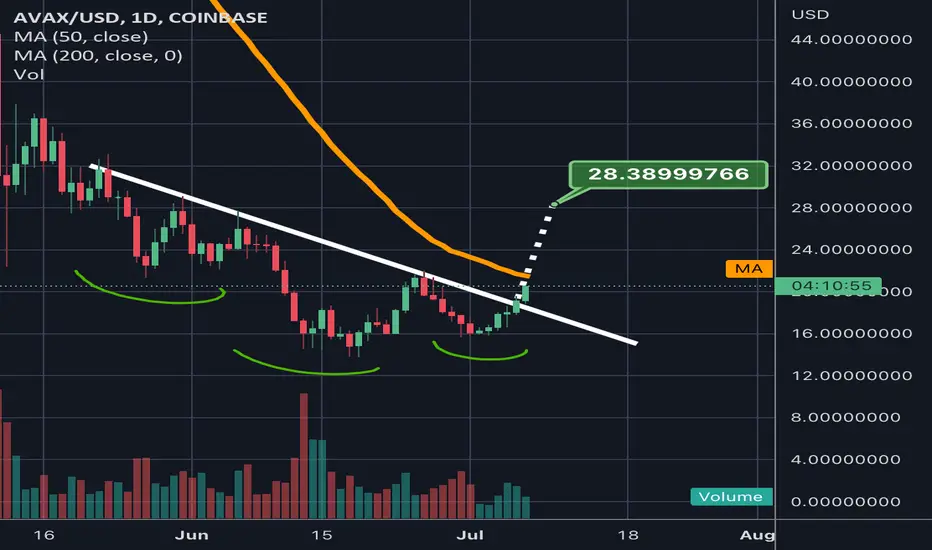
Avalanche teasing an inverse head and shoulder breakoutWaiting to see where the current candle closes. Seeing priceaction flip the 1day 50ma (in orange) to support would make me more confident of the breakout. If breakout confirms target should be around $28.
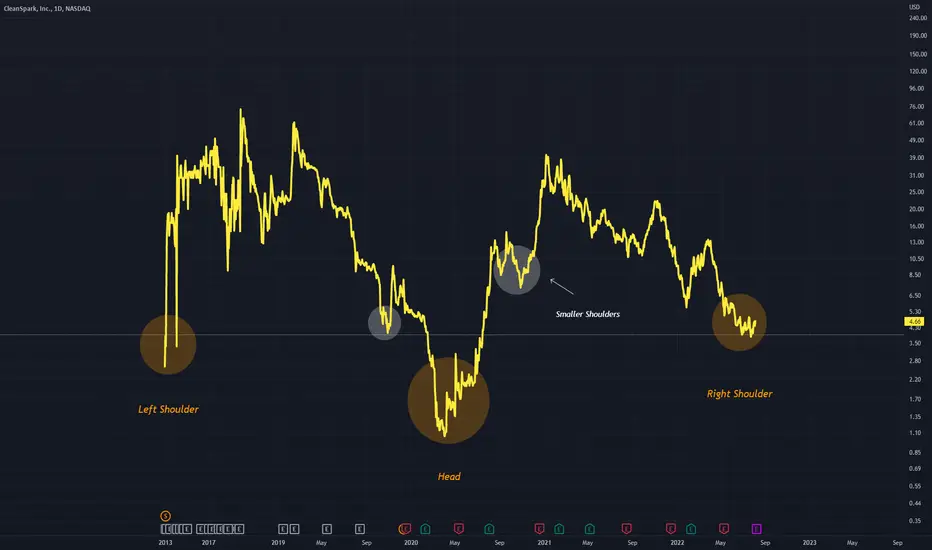
Patterns Within Patterns (Head and Shoulders) Larger head and shoulders in orange
The head constitutes both the larger Head and shoulders and also the smaller one, which contains the white shoulders
Interesting Inverted H&S Pattern
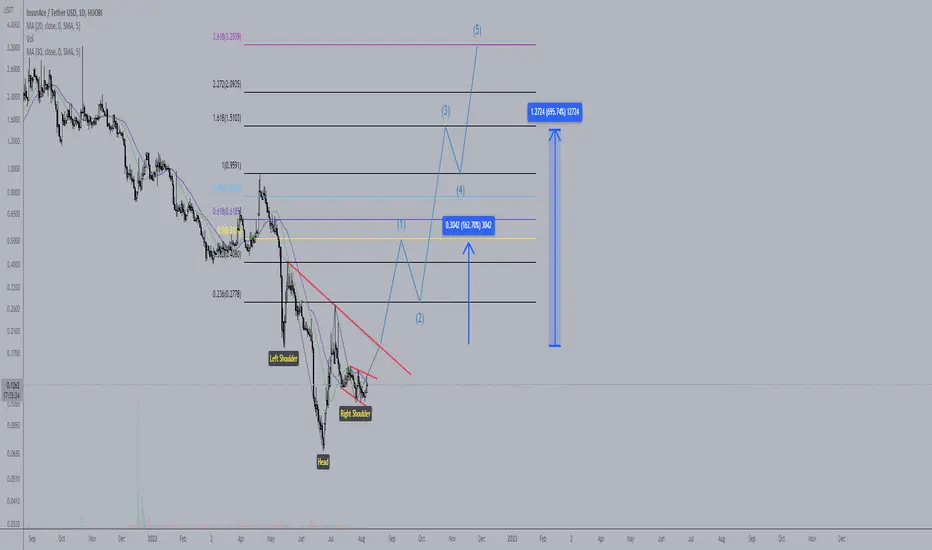
INSUR/USDTBy breaking the inverted head and shoulder pattern and breakout this wedge, we can have great possibilities of gains, in the short, medium and long term, stay tuned
After the incidents with TERRa, Hacks and exploits, the concern about capital has increased, but the demand for insurance will increase the demand for it.
InsurAce !
Entry point at: 0.19 (for study with Inverted Head and Shoulder)
Agressive entry point is 0.12-0.14 demand zone
Stop loss at 0.0978 or 0.10
THIS IS NOT A FINANCIAL ADVICE !
THIS IS NOT A FINANCIAL ADVICE !
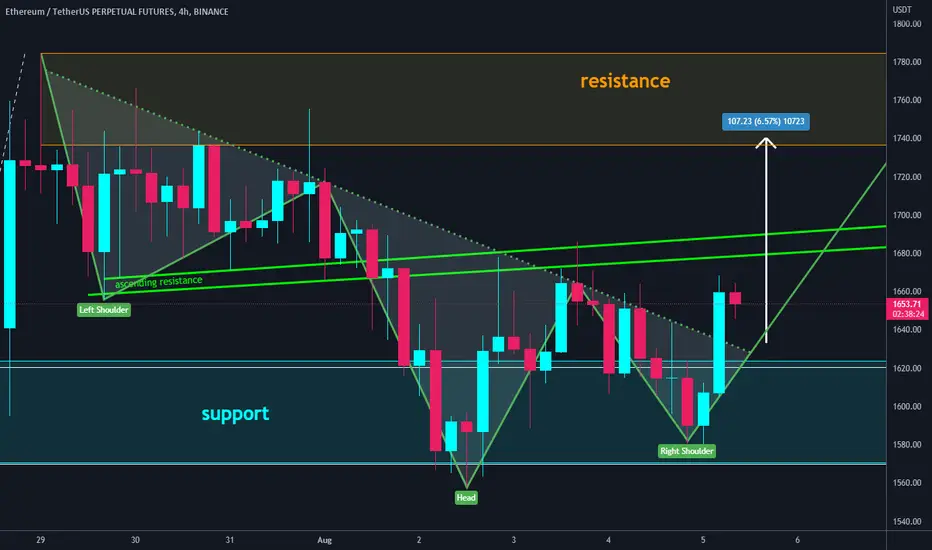
ETH inverted head and shoulders#ETH/USDT
#update
$ETH in a short time frame shaped an inverted head and shoulders pattern and broke out from the neckline.
🐮 after a pullback to the broken neckline, we can expect price increase toward the resistance zone between $1740 and $1780.
🐻as we are in a boring sideways move, so price may reject from ascending resistance zone and drop to the support zone.
Weekly Candles Strong Enough to hold reversal?As to the previous post, what are the chances that Shib will flip resistance to support? Look at the RSI and the MACD indicators. Notice anything interesting. comment below!

Shib has been forming an Inverse Head and ShouldersI’ve been reading the inverse head and shoulders forming since July. If Shib breaks through the next resistance then the thesis is still valid. Let’s see where Shib goes after that Shib Infinite game. Anyone want have any input for a dialogue?

OG Fan Token! 2020 trendline is breaking out! Head and Shoulders
OG looks very promising on the daily/weekly chart!
As you can see, the main trendline (falling wedge) has been destroyed by the bulls, and currently the price is forming an inverse head and shoulders pattern.
We can also spot a descending triangle from 2020–2022. The price went below the triangle, but immediately pumped back up, which is a pretty solid sign of strength.
The ABC correction has been completed and I think we can retest the previous all-time high or at least a previous swing high.
If we take a look at the volume indicator, we can see a massive bullish spike, which is another great sign of strength.
Look at my ideas about interesting altcoins in the related section down below.
For more ideas, please hit "Like" and "Follow"!

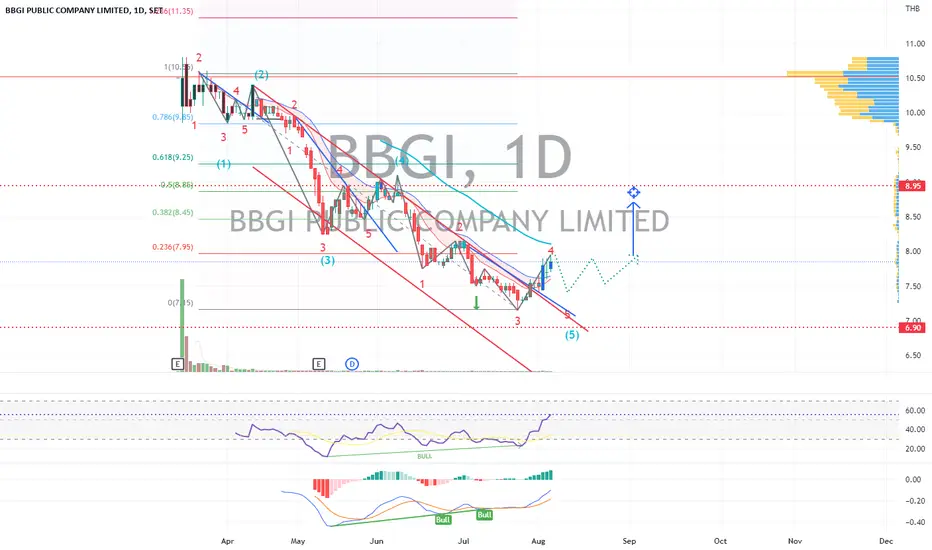
BBGI | Wave Projection | Upcoming Inverse Head & ShouldersPrice action and chart pattern trading setup:
> Possible upcoming ending diagonal of intermediate 5-wave downtrend with inverse head & shoulders
> Entry @ breakout neckline
> Target @ approximately the height of the head 9 baht
> Stoploss @ upcoming right shoulder minor 5-wave
> Risk reward ratio: 2:1 with downside -6%
Indicator:
> RSI +50 cross MA and MACD bullish divergence
Always trade with affordable risk and respect your stoploss
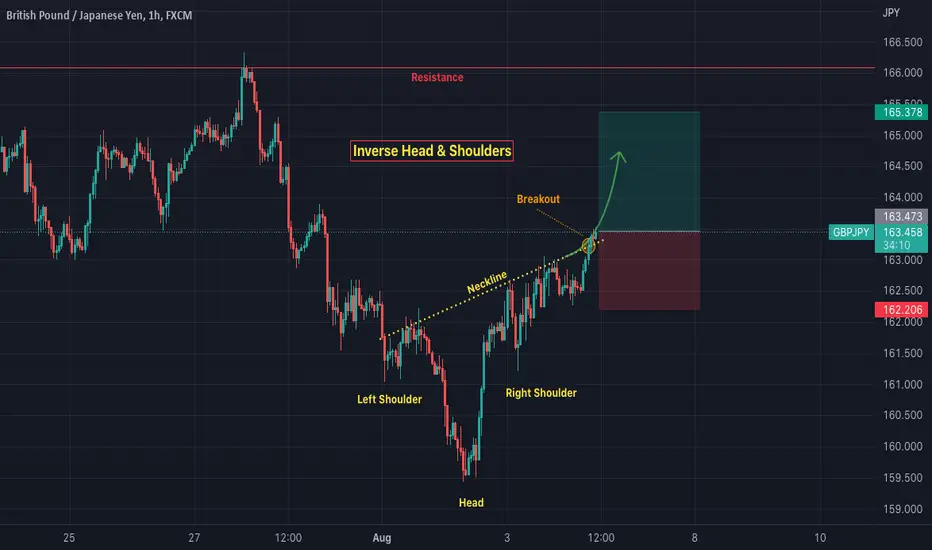
GBP/JPY - 1H - Inverse Head & ShouldersGBP/JPY is in a bullish trend . The price action just formed an inverse head & shoulders chart pattern and broke out of its neckline . Expecting bulls to push prices higher towards resistance .
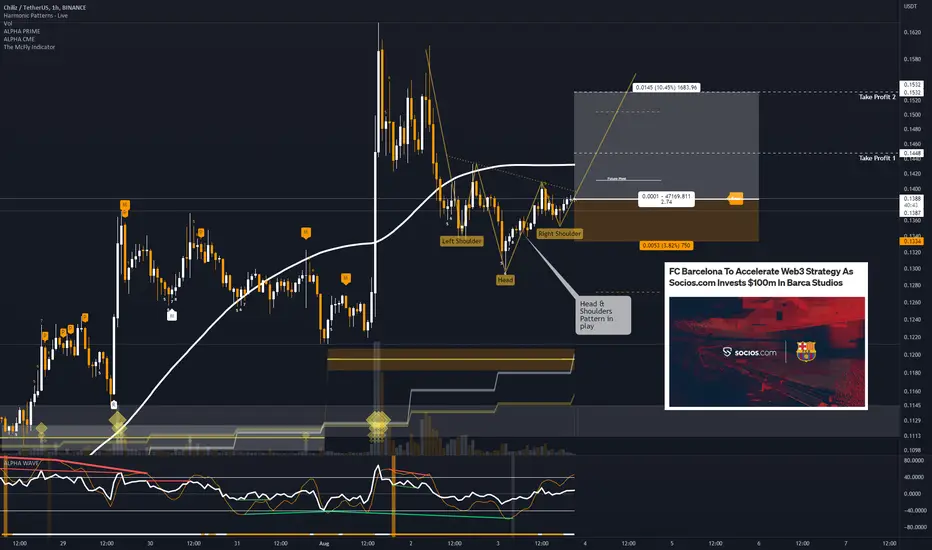
⚡️ #CHZ/USDT - LONG - #SCALP #IDEA⚡️⚡️ #CHZ/USDT - LONG - #SCALP #IDEA⚡️
Risk
- Medium-Low
Entry Conditions:
- Inverse Head & Shoulders Pattern in play
- FC Barcelona To Accelerate Web3 Strategy As Socios.com Invests $100m In Barca Studios
News Source:
- medium.com
Entry: $0.1387
Take Profit 1: $0.1447
Take Profit 2: $0.1532
Stop-Loss: $ 0.1334

Inv h&s on xrpeth pair on the weekly chart.We can see price action on the weekly xrpeth chart is peeking above the neckline of an inverse head and shoulder pattern here. If we can close this weekly candle above it and see a bullish volume impulse on next weeks candle we should be able to confirm this breakout which has a target that would lead to xrp gaining 59% in value against ethereum. For now this isn’t confirmed, however you may have noticed I posted a chart a few weeks ago that showed xrp should be making even bigger gains on ethereum than that based on the triangle pattern it had broken above. So with that in mind, it doesn’t surprise me that we’ve seen this many daily green candles on the xrpeth chart and increases the probability of this inverse head and shoulders pattern getting validated. For now we must await the pattern validation *not financial advice*

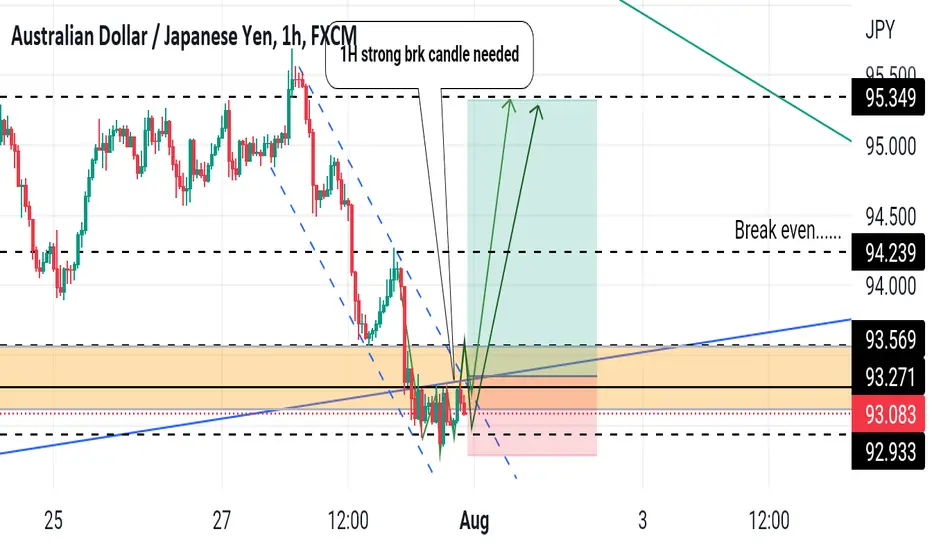
Audjpy inverse HEAD & SHOULDERS BRK?I am noticing a potential CONFLUENCE breakout of both a falling channel and an inverse head and shoulders.
Am entering long on break and retest.... For a quick 3.48R.....
Like and Subscribe.