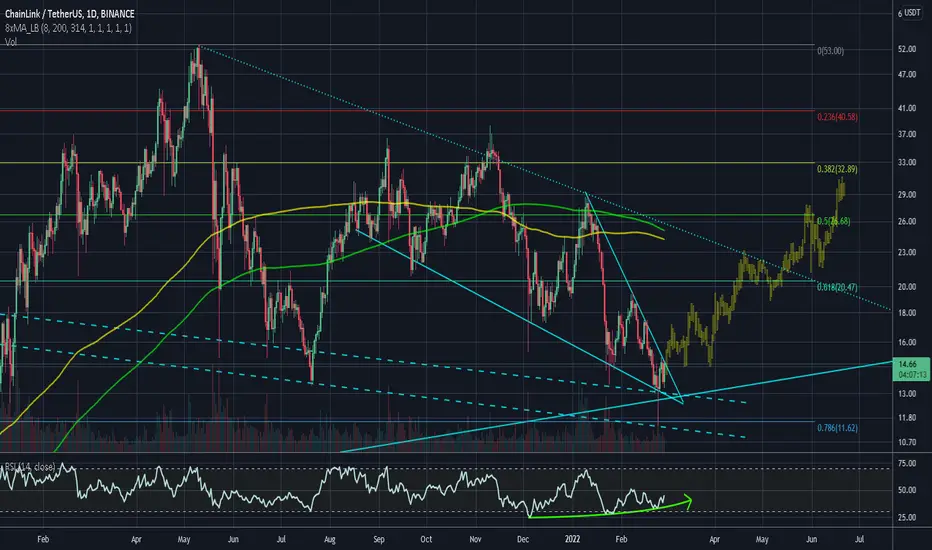
EURCHF: Inverse H & S Complete! Price Likely To Climb Further.With the risk off markets that highly affected the EUR against the safehaven CHF a couple of weeks ago, the price plummeted near the parity! At the moment the price seems to be recovering slightly and likely looks to be headed over to the next psychological resistance found at 1.05000 area.
The Swiss National Bank is likely handing a helping hand to the EUR here by intervening in the market. On the technical basis, the inverse head and shoulders formation was completed and the price is likely to test the neckline before heading higher. All the complete trade details can be found on the main chart.
Cheers, I hope you find this insight helpful. Please LIKE & FOLLOW for more insights on other major currency pairs.
Inverse Head and Shoulders
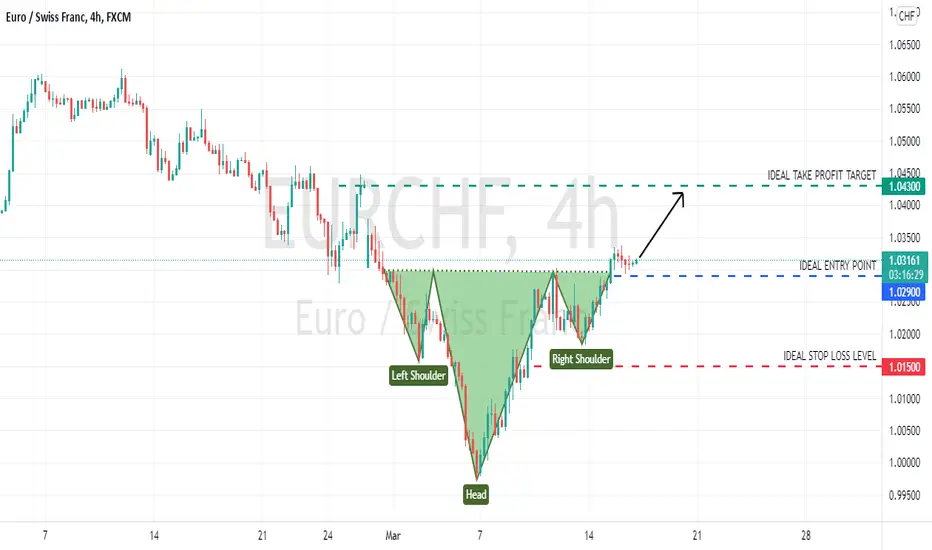
Bitcoin - NOT LOOKING GOOD!Keep it plain, simple and minimize the noise!
Here we see on the inverted Bitcoin chart, a very large inverse head & shoulders pattern formed that started in August 2021.
If this inverse head & shoulders plays out, expect huge dumps - have marked rough levels of support.
BEST case scenario for the bulls is if we completely reject the neckline and shoot for the stars...
At the moment - the market is sideways, choppy and RISKY.
I have various different set-ups I'm watching and always waiting for confirmations of each one BEFORE entering a trade.
Bearish 2022?
What do you think?
Comment your ideas below : )
APLLTDAPL made inverted head n shoulder on daily & hourly charts with decent volumes.
Could be bought with mentioned stoploss & targets.

LauruslabsLauruslabs made inverted head n shoulders on daily charts & broke out of neckline with very good volumes.
Could be bought with mentioned stoploss & targets.

US30 BUY ANALYSISLooking at US30 on 30M timeframe
We looking for potential long position
Inverse H&S has been formed

US30 long. US30 is a bullish market. But trade cautiously. Price just formed an inverted head and shoulder.


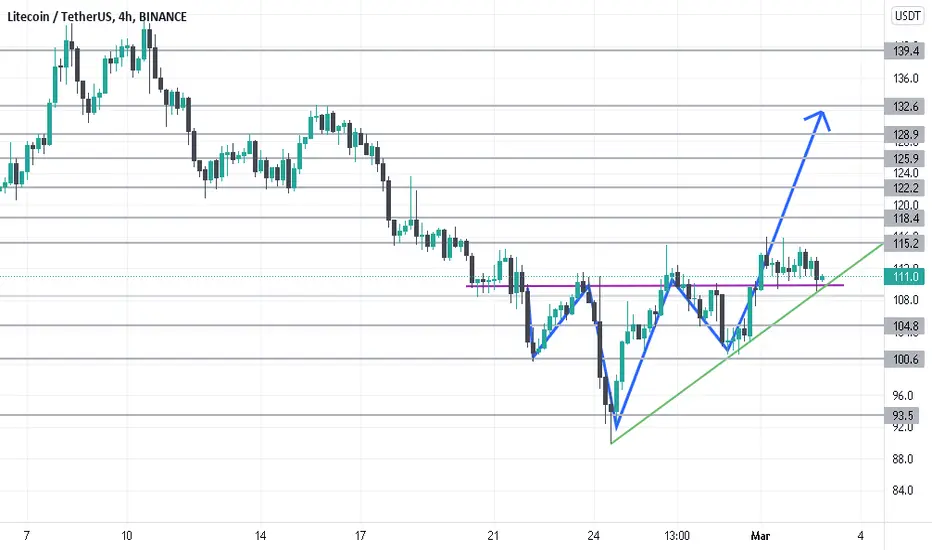
Potential Inverse Head and Shoulders Could Take Us Near $100If we can Begin to bounce from here that will be a confirmed right shoulder that if market conditions become Bullish could take us between the levels of $97 and $100 if it wins we get over 10% if it fails then we simply lose 3 percent which is fine risk to reward.

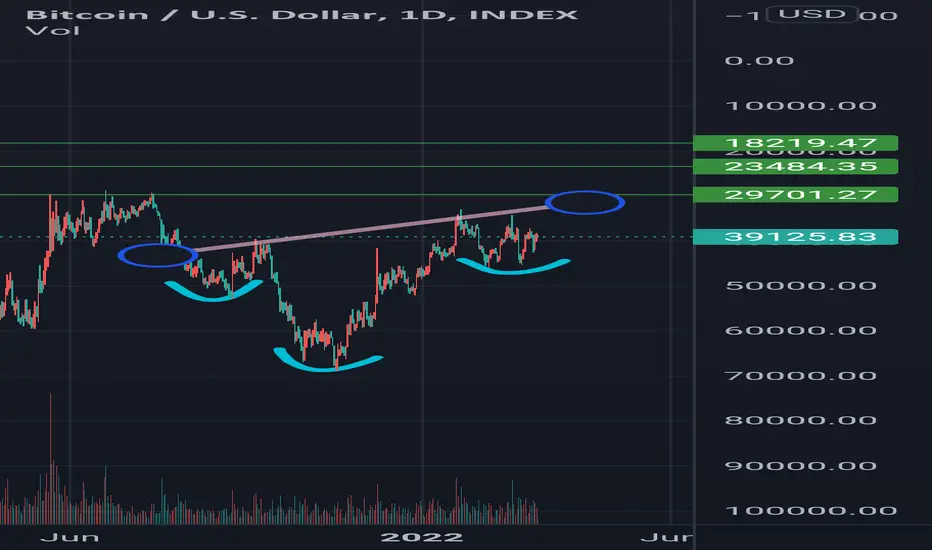
GC1! Gold to retest 24 Feb swing high?By the looks of it, we are working on a right shoulder of the inverse head-and-shoulders pattern.
Projected move will take gold's price up to the high we achieved 24 Feb when Ukraine was invaded.
This is a bullish development in the price of gold as simultaniously the DXY is also moving higher.
#gold
NEARUSDT is creating an inverse head and shouldersThe price bounced on the monthly support on 8$ after a false breakout from the weekly dynamic support.
On the daily timeframe, the price had a breakout from the dynamic resistance and from the weekly resistance, and now the price is testing the 0.618 Fibonacci level as resistance
On 5h timeframe, the price is creating an inverse head and shoulders above the weekly resistance
How to approach?
If the price is going to have a breakout from its neckline and retest as new support, we can apply our rules for a new long position.
Be aware of the weekly structure on 13$
According to Plancton's strategy , we can set a nice order
–––––
Keep in mind.
🟣 Purple structure -> Monthly structure.
🔴 Red structure -> Weekly structure.
🔵 Blue structure -> Daily structure.
🟡 Yellow structure -> 4h structure.
–––––
Follow the Shrimp 🦐

Inverse Head & Shoulder Pattern formationIf price comes down to the grey box area look for buy entries set stop loss below head or wait for a break of the neckline for bullish confirmation . Trade cautiouy

ALGO is looking bullishALGO is making an inverse H&S pattern in a 4-hour time frame. In order to achieve our target, it needs to break above this trendline which is now a strong resistance.

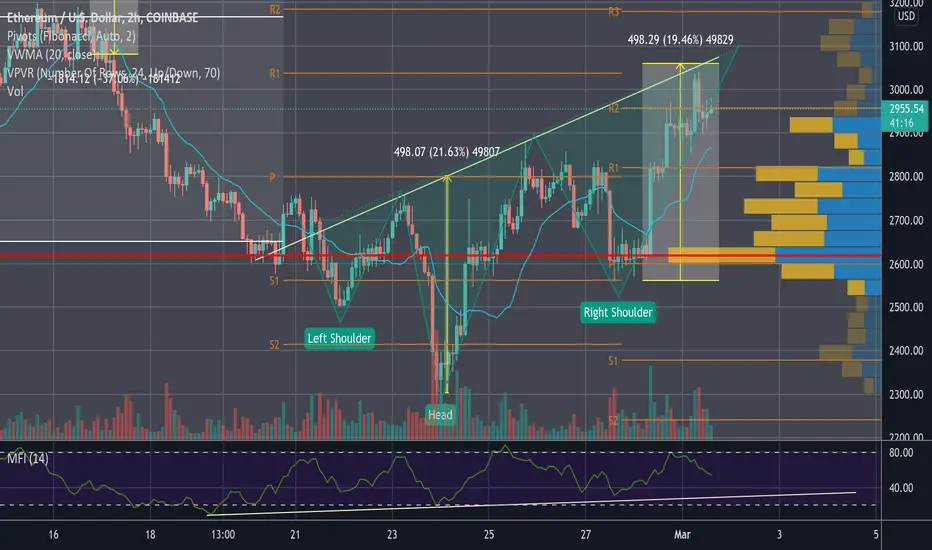
ETH is extended short termEthereum is ripe for a pullback on the 2hr timeframe per completion of a bullish inverse head and shoulders pattern. I would be a strong buyer at 2380 if RSI/ MFI support holds but generally I don't believe the ultimate bottom is in until new lows are not made for over a month or so.
ADA the bulls are back! Hello everyone,
Our inverse H&S patter was right and now the price went up to resistance level.
Soon we are going to have another high before the price goes back on the neckline.
Make sure you take your profit !
Have a nice trading week.

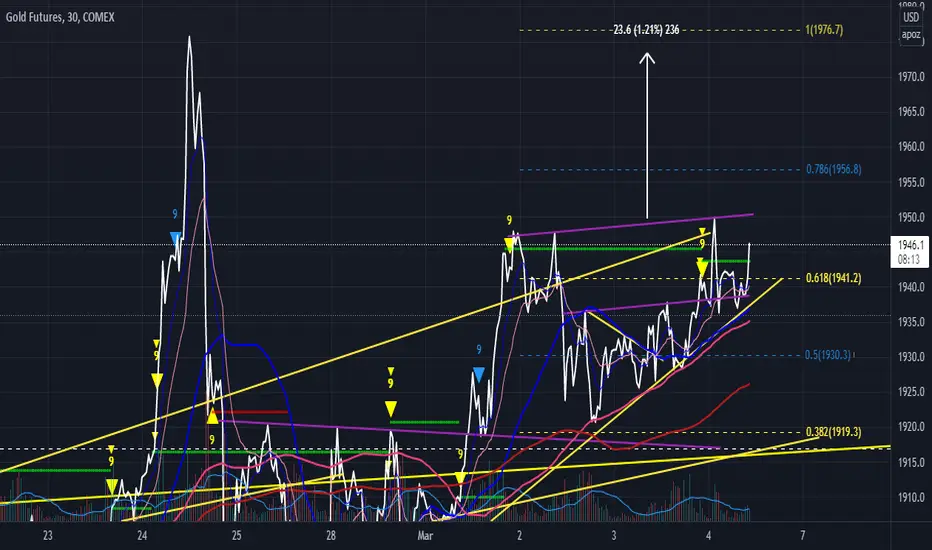
LINK/USDT - bullish reversal pattern close to breakoutLINK/USDT is currently right at the tip of a falling wedge after having quickly pinged the macro 0.786 fib level which makes me very optimistic about this being the bottom and seeing a successful reversal. In addition to that we can also see significant bullish divergence on the daily which ranges back to December and further increases the odds of a textbook breakout which LINK tends to have especially with falling wedges (examples can be seen in my earlier charts linked below in the related ideas section).
On shorter time frames LINK is currently forming an inverse H&S which combined with the falling wedge makes for a great reversal pattern which produces consistent results and is close to completion.
LINK/USDT 1hr:
Since LINK is a long-term hold for me I usually don't use stop losses and mainly look for prices to accumulate more but for a swing trade I'd consider one slightly below the last 0.786 ping since losing that level would render it a descending triangle breakout and likely lead to a longer bear trend.
Please note that the price projection is just that and should only guide as a visual aid for the direction I expect it to go.
With staking said to release this year this looks like a great opportunity to stock up on some LINK at a discount before the action starts.
Best of luck with your trades and let me know what you think!