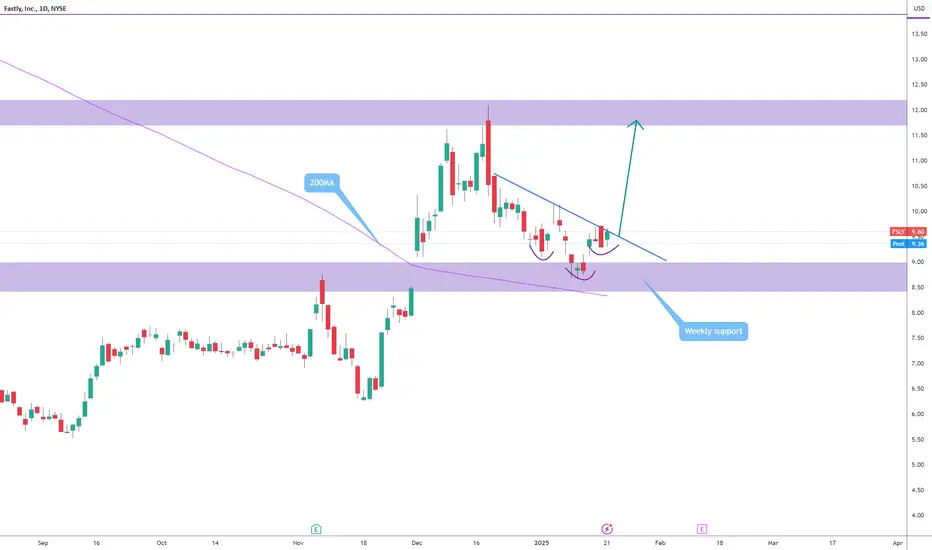
I like this setupPrice is doing an inverse HA over the 200MA that happens to cross through an important support level. First target 12, but I think is goin to 13.5. SL if the support is broken down with a daily candle.
Inverse Head and Shoulders
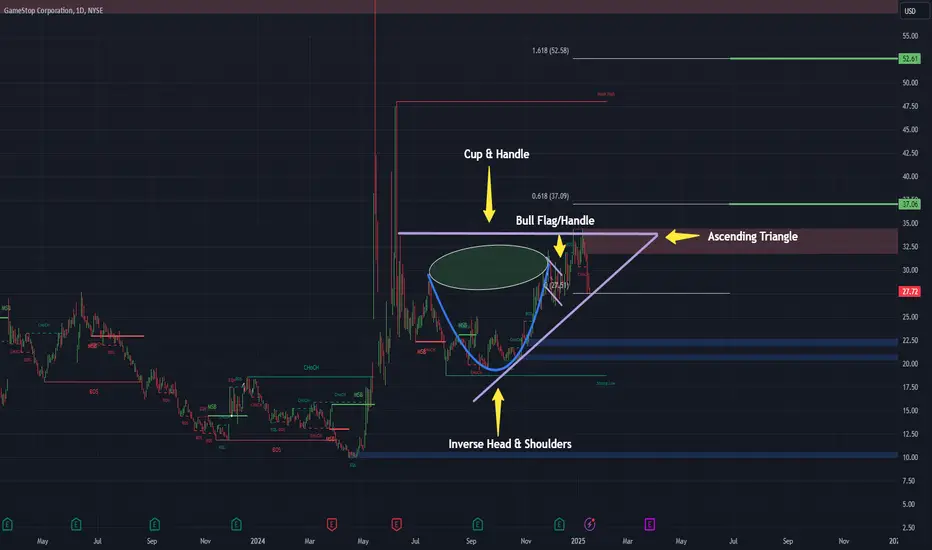
Ascending Triangle on the Daily for GME!Alright folks, brace yourselves for another electrifying update on the saga of GME! Since our last rendezvous, we've witnessed the impressive cup and handle pattern and the striking inverse head and shoulders breakout. But that was just the beginning. After our latest dip, in tune with the broader market's downturn, we've now sculpted an absolute monster of an Ascending Triangle on the daily chart, also visible even on the 4-hour.
Using the trend-based Fibonacci extension, the golden pocket awaits us at $37.09, with the next pocket above that at $52.58. Adding to the excitement, we've got the Bull Flag breaking out on the weekly chart and the golden cross appearing on both the weekly and daily charts. Not to forget the substantial cup and handle formation on the hourly chart.
Hourly Chart : Cup and Handle: This pattern is setting the stage for potential bullish movement.
4-Hour Chart: Ascending Triangle: Reinforces the pattern seen on the daily chart, confirming the bullish setup.
Daily Chart: Ascending Triangle: Visible on both the daily and 4-hour charts, suggesting an imminent breakout.
Weekly: Golden Cross: This crossover indicates long-term bullish momentum.
Bull Flag: This continuation pattern indicates that the existing uptrend is likely to continue.
All signs point to an explosive few months ahead for GME, with multiple breakouts on the horizon. Stay tuned, because the next chapter of this epic journey is about to unfold
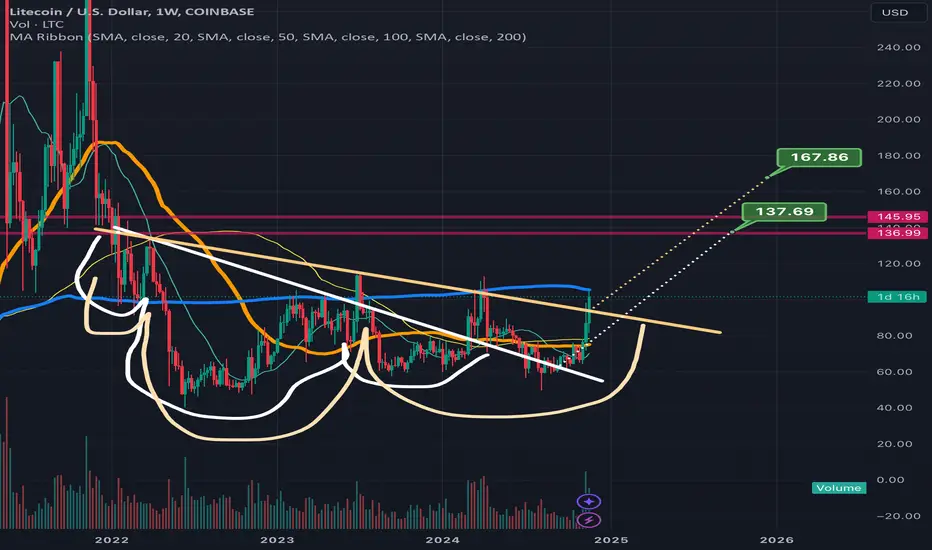
LTC Breaking above tan invh&s neckline, right on goldencrossI have the weekly chart timeframe selected here simply because I needed to expand the timeframe on the chart to be able to fit both inverse head and shoulders patterns and their respective breakout targets in the frame. Wanted to put the timeframe on the daily chart so. Could show once again how these recent crypto pumps have all being launching on the exact day that the Daly golden cross occurs. I will post. Daily chart version of this as well that zooms in on the golden cross and subsequent priceaction and link it below. Anyways it looks like on this 2nd breach above the tan neckline that Litecoin is likely to finally trigger a breakout ths go around. If so the highest measured move target is in the $170s here, and reaching it will obviously also allow us to hit the white inverse head and shoulders breakout target too on the way there. In order to ensure that price acton doesn’t dip back below the tan neckline for a second time, it will need to flip the weekly 200ma(blue line) to solidified support once that happens I think it will definitely confirm the breakout at that point. Alt season has officially began! *not financial advice*
LTC about to complete right shoulder right @ the golden crossIf Litecoin’s price action reacts the same to its golden cross as many other crypto charts have recently, we will likely see Litecoin rise above the invh&s neckline i the coming days. A confirmed breakout from the invh&s has a breakout target of around $173. *not financial advice*

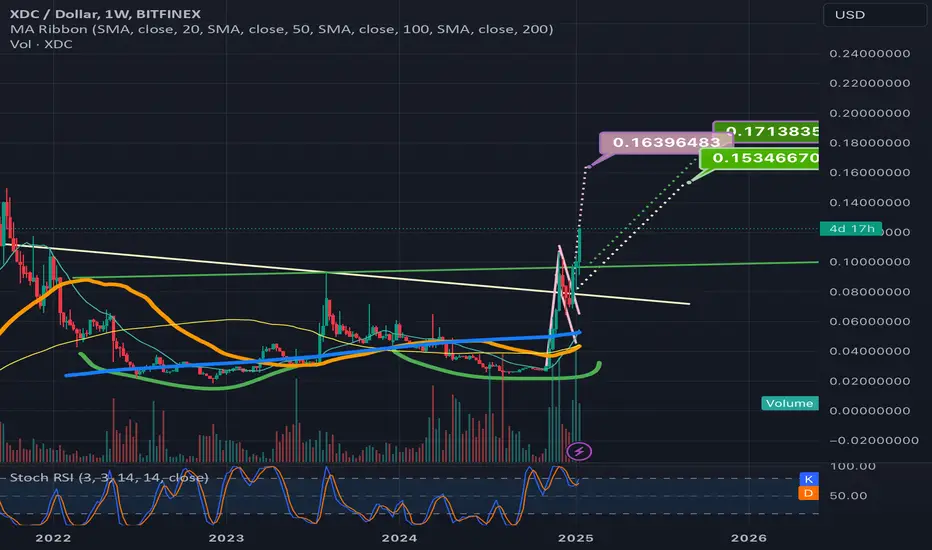
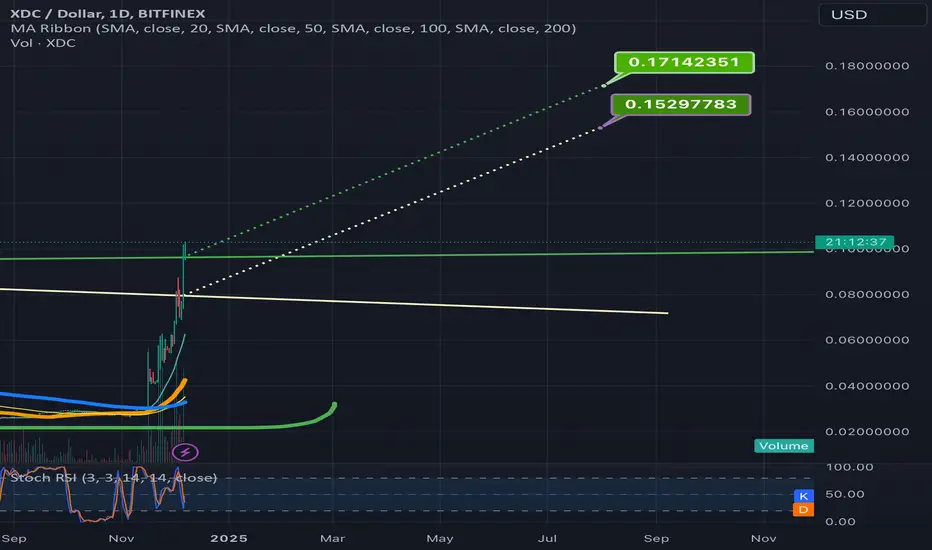
XDC breaking up from 3 different bull patterns at the same timeI had to use the weekly time frame instead of the daily to fit all 3 patterns in the frame here. As you can see we have a double bottom(green neckline), an inverse head and shoulders (tan neckline), and a pink bullflag that price action is currently breaking above each of. Their full measured move targets are all relatively close to eachother too which creates some bullish confluence. *not financial advice*
Bitcoin is breaking down right now! (lifetime opportunity)Bitcoin is currently breaking down out of the head and shoulders pattern, as I expected in past weeks. The next support is 85k, and we can hit this support pretty quickly. Bitcoin is known for its huge volatility.
After we hit 85k, I expect Bitcoin to go up and retest the previous neckline of the HaS pattern, which is at around 91k! So you can make 2 trades in the short term. If you watch my posts, you know that 85k is a significant support level. It's the start of the FVG on the daily chart. Between 85k and 77k there is pretty much no price action. That means we can experience a huge flash crash. But let's be realistic: 85k is also a 20% correction from the ATH. Statistically, a 20% crash is when you want to put your buy orders.
1:1 FIB extension corresponds to the ABC correction. We are in Wave C of a corrective pattern.
Write a comment with your altcoin, and I will make an analysis for you in response. Also, please hit boost and follow for more ideas. Trading is not hard if you have a good coach! This is not a trade setup, as there is no stop-loss or profit target. I share my trades privately. Thank you, and I wish you successful trades!

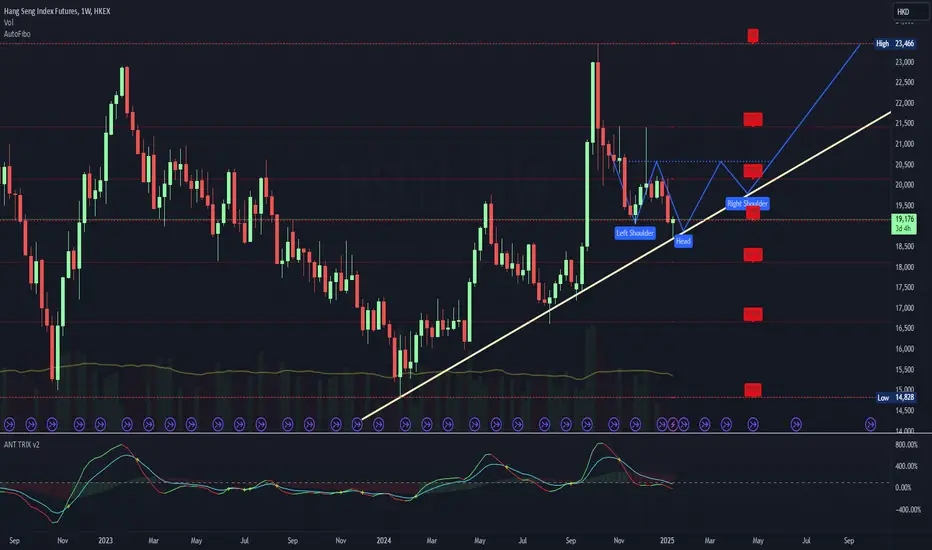
$HSI/China clear long bullish play here$HS_F Bullish china trade here, can basically go long on anything china related imo, should be good :)
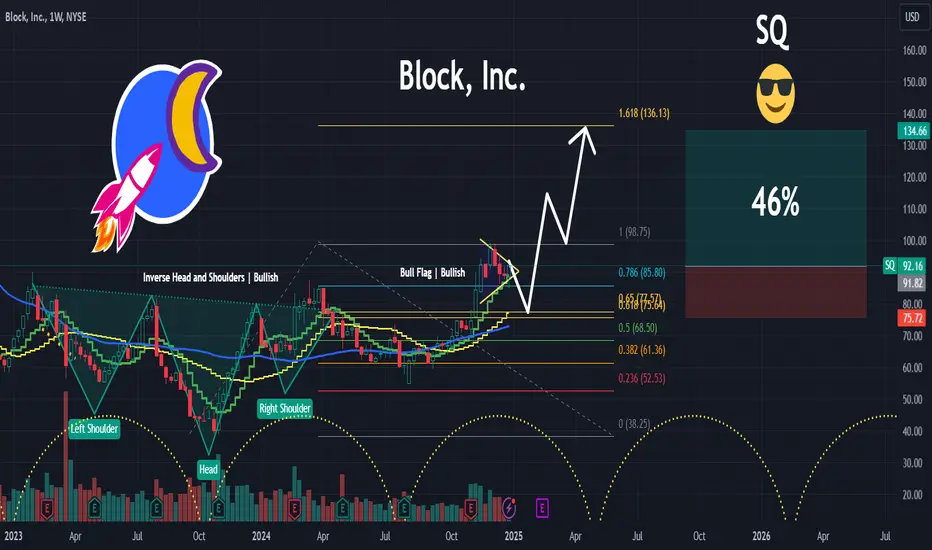
SQ | Why Wallstreet is Bullish | LONGBlock, Inc. engages in creating ecosystems for distinct customer audiences. It operates through the Square and Cash App segments. The Square segment provides businesses the ability to accept card payments. The Cash App segment offers an ecosystem of financial products and services to help consumers manage their money. The company was founded by Jack Patrick Dorsey and James Morgan McKelvey in February 2009 and is headquartered in Oakland, CA.
Bullish Cases for ENA/USDT#Bull_Insights #014
Coin Ticker : #ENA
Market : Binance
Time Frame : 1 Week.
This report analyzes the bullish indicators for ENA/USDT as depicted in the provided chart, highlighting potential upward trends and investment opportunities based on technical analysis.
Key Observations:
Volume Surge : There's a noticeable increase in trading volume at the end of 2024, which often precedes significant price movements. High volume can indicate strong buying interest, suggesting a potential bullish trend.
Price Consolidation : The price has been consolidating within a tight range, marked by the red dashed lines (approximately $1.2 - $1.4 USDT). Consolidation after a downtrend and rebound can lead to a breakout, often upwards if accompanied by increasing volume.
Support and Resistance: The consolidation area acts as a strong support level. If ENA breaks above the resistance with significant volume, it could signal the start of a new uptrend.
Moving Average Cross: Although not explicitly shown, the price action near what appears to be a moving average specifically on the daily time frame confirms a golden cross (short-term MA crossing above long-term MA), a bullish signal.
Relative Strength Index (RSI) : The RSI, if considered, rebound from the oversold area and currently showing bullish sentiment with a divergence in the formation (not visible in the chart). An RSI moving upwards from an oversold condition or showing bullish divergence could confirm buying momentum.
Pattern Formation : The price action seems to be forming a potential double bottom or and in some particular cases inverse head and shoulders pattern, both of which are bullish reversal patterns. Confirmation of these patterns with a breakout above the neckline or the red rectangle resistance area would be a strong bullish signal.
Fibonacci Retracement: The price is currently near the 1.68 Fibonacci extension level. A bounce from these levels could indicate the resumption of the forming uptrend.
🔼Bullish Cases:
Breakout Scenario: A breakout above the current resistance with high volume could lead to a target price calculated by the height of the consolidation range, potentially pushing ENA towards $1.6 - $1.8 USDT in the short term and will pave a way for the long term ATH move for the coin.
Pattern Confirmation : If the patterns mentioned (double bottom or inverse head and shoulders) are confirmed, this could lead to significant price appreciation, targeting levels beyond the previous highs.
Volume Confirmation: Continued increase in volume alongside price movement will validate the bullish case, suggesting strong market interest and potential for sustained growth.
Fundamental View on the future of MIL:ENA :
▶️ Sector: DeFi
▶️ MC: $3.73B
▶️ FDV: $18.58B
▶️ Unlocked supply: 20.22%
- Ethena is a synthetic dollar protocol built on Ethereum.
- It offers a crypto-native solution for money that doesn't rely on traditional banking infrastructure.
- Additionally, it provides a globally accessible, dollar-denominated savings instrument — the "Internet Bond."
Conclusion:
The current technical setup for ENA/USDT shows several bullish indicators. However, investors should watch for confirmation through volume and price action before making investment decisions. Always consider broader market conditions and news related to ENA that could affect its price independently of technical indicators.
Recommendation:
Monitor ENA/USDT closely for breakout signals above the current resistance. If confirmed with volume, consider entering long positions with stops below the consolidation area for risk management.

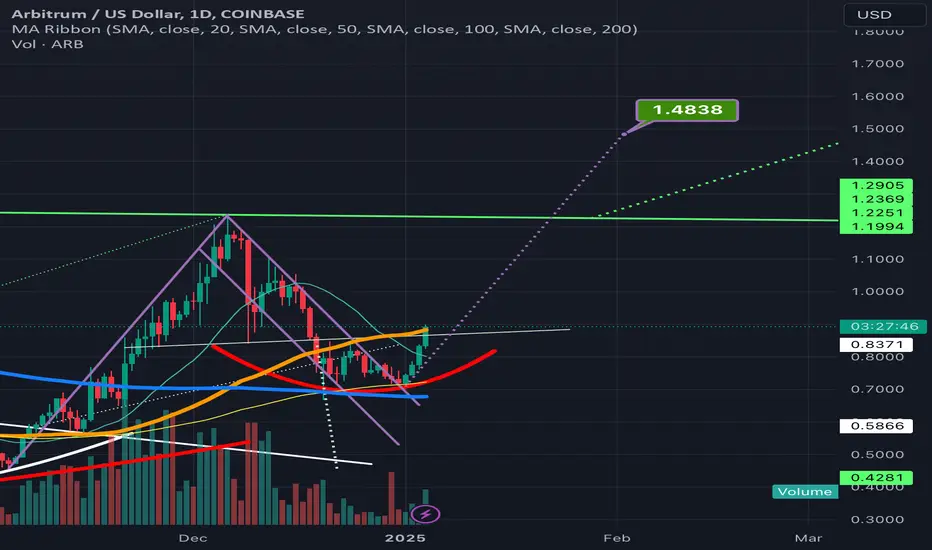
ARB breaking up from a bullflag that can take it above necklineArbitrum looks like it has probably founded the lowest depth of the right shoulder of it’s inverse head and shoulders here as it has now broken upward from this purple bullflag here and is now back above the 1 day 50ma(in orange). The breakout target of this flag will take price action above the neckline of the inverse head and shoulders pattern if it hit its full breakout target. We can also see that the bearish h&s that we were under the neckline of for several daily candle closes never progressed into getting validated as is often the case with bearish patterns in this phase of the bull market. I suppose there’s still a chance we could head bck under that light colored tannish neckline again but probability favor the upside at this point. *not financial advice*
TSM LOOKING BULLISH|READ NOTES|24DEC 2024TSM is looking bullish to breakout but if it does not then $180 is very much a possibility. In nutshell Iam just explaining you what I am getting into. Always know the risk.
I am expecting a green candle in TSM so i am long here

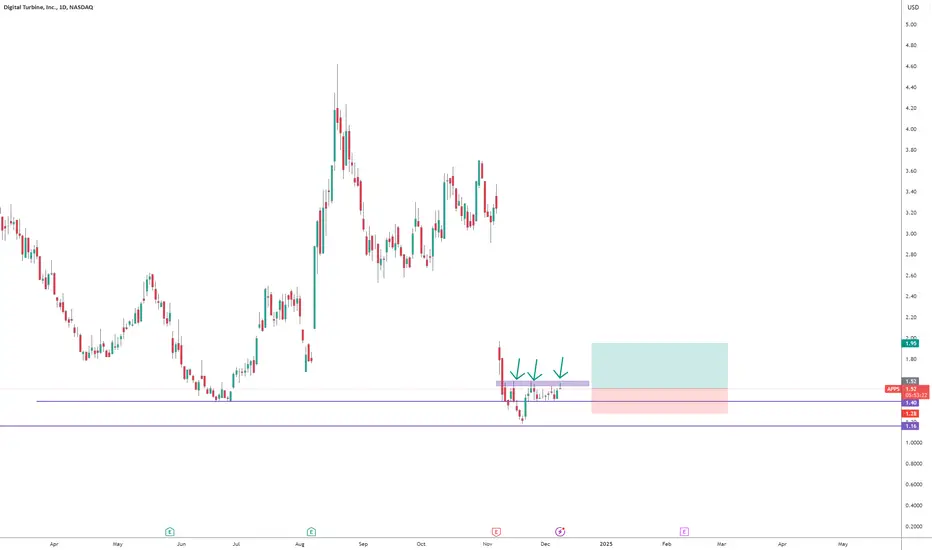
Is trying and is going to make itPrice has tried many tome to break that resistance. Eventually is going to make it. Also looks liken an inverse HS. I opened a long position. Is a very volatile stock so hang tight. SL triggers is a daily candle closes at the level shown. But it has to close.
Inverse Head & Shoulder Tutorial An inverse head and shoulders pattern is the opposite of the head and shoulders pattern and signals a potential bullish reversal from a downtrend to an uptrend. Here's a breakdown of its key components:
Left Shoulder: The price falls to a trough and then rises back to a resistance level.
Head: The price falls again to a lower trough and then rises back to the same resistance level.
Right Shoulder: The price falls again but only to the level of the first trough, then rises once more.
The pattern gets its name because it resembles an upside-down head with shoulders on either side. The neckline is the resistance level connecting the highest points of each peak.
Types of Inverse Head and Shoulders Patterns
Inverse Head and Shoulders Bottom: This pattern signals a potential reversal from a bearish trend to a bullish trend.
How to Trade It
Breakout Confirmation: The pattern is confirmed when the price breaks above the neckline in an inverse head and shoulders bottom.
Entry Point: Traders often enter a long position when the neckline is broken in an inverse head and shoulders bottom.

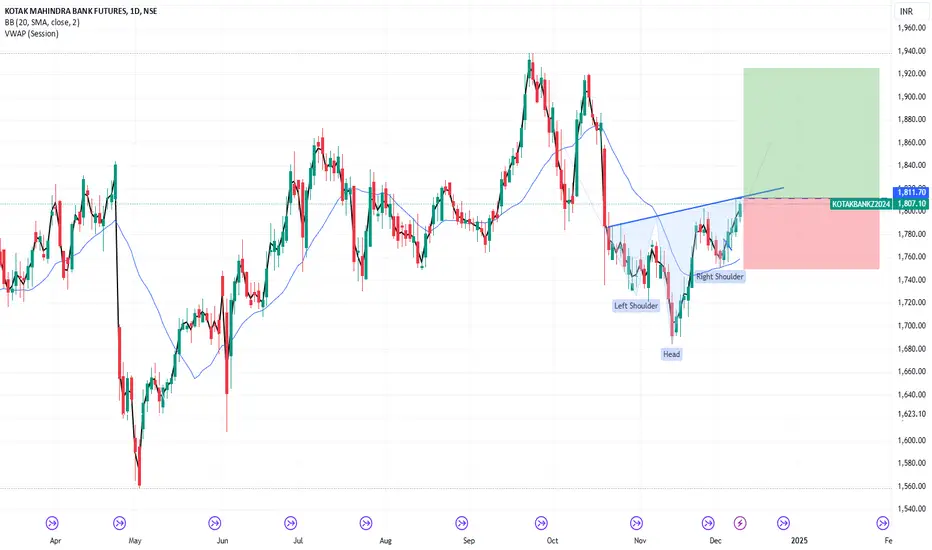
JACKPOTKotakbank Fut is on the verge of breaking out of inverted head & shoulder pattern on DAILY charts with decent OI addition.
Risk:Reward = 1:2
Conditionally buy above 1812 with menioned stoploss & target.
$BTC #Bitcoin Just Gonna Leave This Here (Hmmmm..Maybe?) 😝This is just adding onto my logarithmic regression-inversion theory and how I personally believe the $BTC price movements may specifically play out. The general theory is that the logarithmic regression of $BTC will invert at a certain point in the next 1-3 years, changing the price suppression $BTC has had for its whole life into exponential support. I personally believe this is very possible, with exponential adoption of #Bitcoin for things like sovereign wealth funds, countries' legal tender and possibly even a world reserve asset. If those things (plus other possible variables) occur then this is how I see that possibly playing out.
Here is a detailed explanation of what I personally believe is happening/going to happen here.
Phase 1:
There would be a breakdown of price like we have now (possibly) completed. This would be in order to accomplish a few things for global institutions. Some of those things are:
1) Get Bitcoin out of the hands of the "common man". It would not be possible to acquire the amount of $BTC needed with so many people holding.
2) Cause liquidity issues for exchanges, making it more difficult for just anyone to purchase. (We have already seen this. ex: Voyager, Celsius, etc.)
3)Allow large accounts to be created at more feasible prices, while also providing a good (high) enough entry price to sustain value for the overall asset in the eyes of the public. (To keep people from losing interest)
There are obviously more reasons, but that's another post.
Phase 2:
A relief rally back up to the median range. This will obviously be a very volatile range, as 50% of investors sell (expecting a sharp move downward) and others (possibly the central financial institutions and/or sovereign wealth funds, who will not initially disclose their acquisitions) accumulating within this range.
Because of this volatility, the likely range it will be in, the immediate supports/resistances, and the typical movement of the $BTC price; My current prediction is that $BTC will move upward, after flipping the top of the recent range into support, and break above the main down-trend of a massive flag that $BTC has been forming for over a year. Then after a retest of that upper trend, price will attempt to break the new-found resistance as traders long from that trend line. Believing that this is the last upward movement, traders will then short the resistance level, and other holders may sell out of fear (or just simply because they will be at a break-even price, since a lot of volume was transacted in that range). This range will then prove to be the median range, previously mentioned. $BTC will then make a lower low, again at the upper trend of the flag. This will seem like a "bear-signal" but will actually be a second confirmation of support off of the upper-resistance trend of the flag, which will "fake-out" traders, causing a short squeeze. Then more traders will continue to short as others switch to a long stance. All of these movements will print an inverse-head-and-shoulders, the break-out of which will give $BTC price the momentum needed to make it back up to the $60K-$70K range.
Phase 3:
After making it back to the "all-time-high" range, there will undoubtedly be heavy volatility, as some call for a triple-top and others "FOMO" into #Bitcoin. This volatility, bouncing between the upper regression curve and the inversion curve, will begin to print a "rising-wedge" pattern. The break-out of this wedge will be the ultimate inversion of regression into exponential growth.
This is all pure speculation, however it is based on both, strong fundamental data as well as technical data. I personally believe in this theory, and it could also play out in other ways, but this scenario seems to make the most sense to me at the moment.
**This is my own opinion based on data observed. This is not financial advice.**

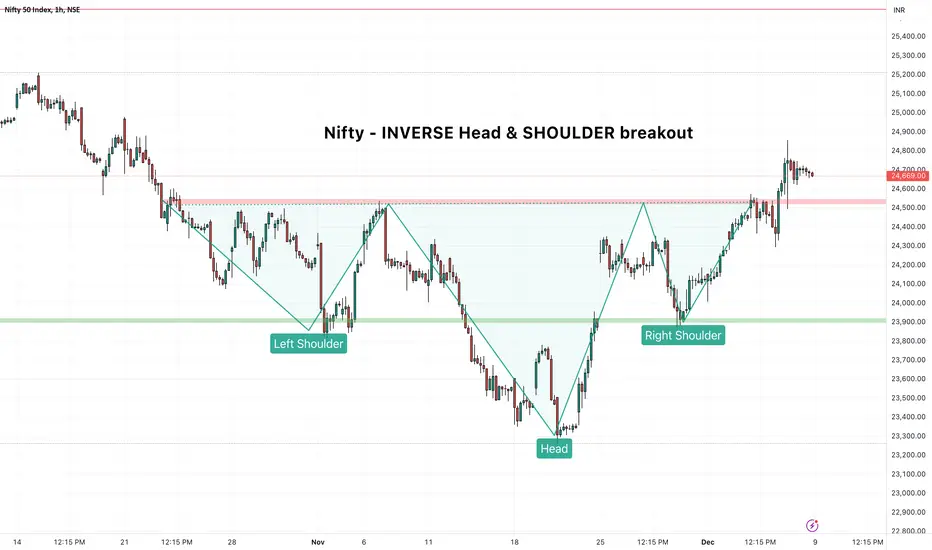
Nifty - Inverse Head & Shoulder breakout The target could be calculated based on the depth of the head and that is giving us the number around 25500.
Given the current momentum after the breakaway, market is starting to tell the bullish story.
Keep an eye in coming day.
BNB/USDT: Weekly Breakout! Massive Rally Ahead – Are You Ready?🚀 Hey everyone! 👋
If you’re finding value in this analysis, don’t forget to smash that 👍 and hit follow for premium setups that actually deliver results! 💹
🔍 Technical Breakdown:
BNB is looking primed for a massive rally! 💥 Breaking out of a textbook inverse head and shoulders pattern on the weekly time frame, BNB is flashing a strong bullish signal. The retest looks solid, and the setup suggests significant upside potential from here. 🟢
📈 Entry Range: $675-$735
🎯 Targets:
1️⃣ $980
2️⃣ $1,370
3️⃣ $1,660
4️⃣ $2,280
❌ Stop Loss: $480
⚖️ Leverage: Use low leverage for a safer trade (max 5x).
💬 What’s your take on BNB’s breakout potential? Are you spotting the same bullish momentum, or do you see it playing out differently? Let’s discuss in the comments below! Share your thoughts and analysis, and let’s make the most of this opportunity together. 🚀💰

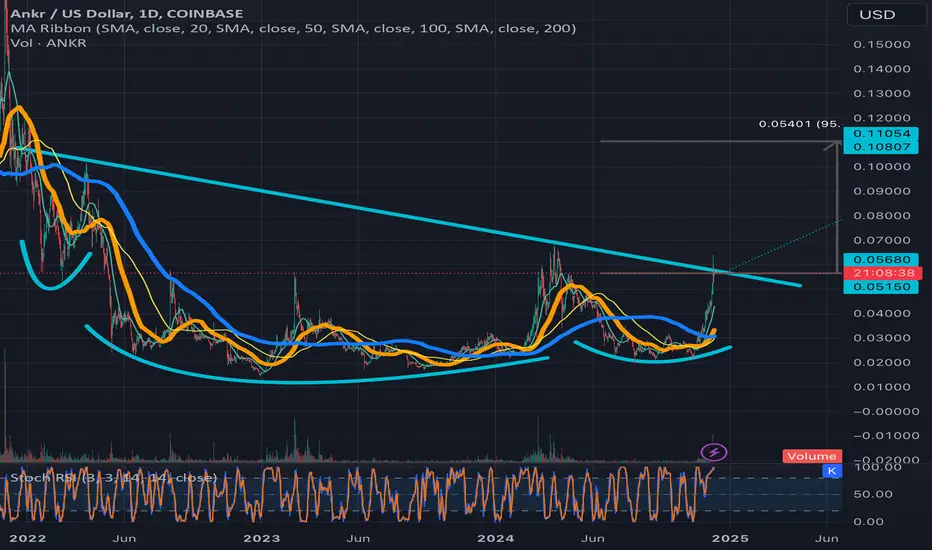
Ankr’s breakout target from invh&s can bring 95% gains if soonAnkr is very close to completing its right shoulder on this fairly thicc inverse head and shoulders pattern it has formed. Hard to tell exactly when it will breach the neckline but one would assume that it’s probable for it to happen soon. *not financial advice*
XDC beginning to head to its bullish breakout targetsPosting an update this chart so I can show a zoomed in look at the daily price action with the measured move lines readjusted to the exact breakout points of the two chart patterns to provide ore accurate breakout targets. I will link the original chart idea i posted of these 2 patterns below. *not financial advice*
MSTR - Inverse H&S Pattern with Clear Breakout TargetThis is an Inverse Head and Shoulders pattern on MSTR 1-hour
Risk/Reward Analysis:
Entry Price: $440
Stop Loss: $400
Target Price: $520
Risk/Reward Ratio: 1R:2R
Details
Clear neckline breakout level around $440
Downside risk zone marked in red (-$40 from entry)
Upside potential marked in green (+$80 from entry)
The setup presents a favorable technical structure with a strong risk-reward ratio above 1:2.

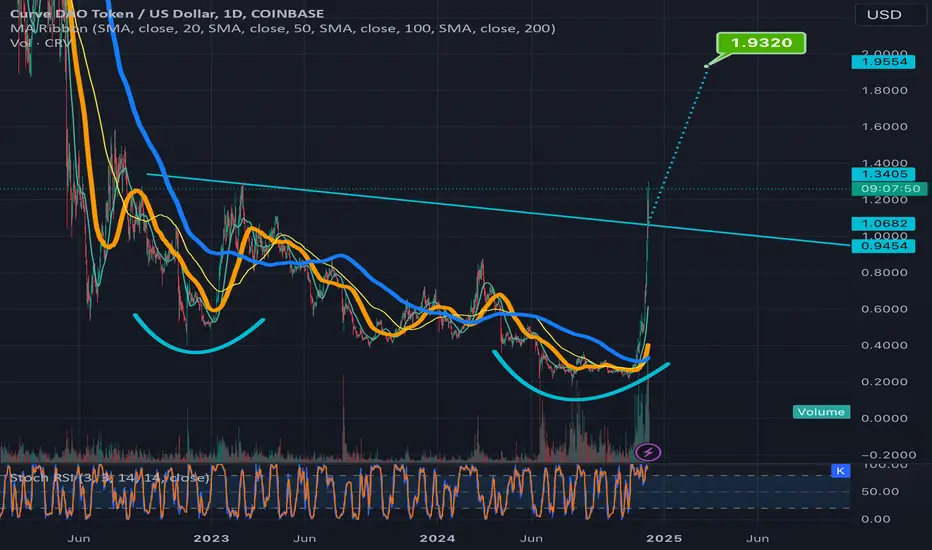
CRV appears to breaking up from double bottom necklineIf you zoom in you can see the previous daily candle closed on the neckline with exact body support and now the current candle is having a nice bullish impulse, which suggests that it could validate the double bottom relatively soon. If it has a few days of correction n this zone it will also form a right shoulder to an inv h&s pattern that would then materialize with a neckline slightly above this double bottom neckline as I hypothesized my previous curve idea which I will provide a link to below. That inv h&s pattern would then have a slightly higher breakout target than this double bottom will should it materialize. For now the double bottom is the one to focus on as it seems very close to validating. Curve is likely overextended at this point so it could easily go back and forth on the neckline here before the real lift off. *not financial advice*
Aerousd breaking upwards from ascending inverse head & shouldersStill has about 41 percent of gains left to make between here and its full breakout targer. Will net a new all time high in the process. Not sure where it will go from there. could always overshoot or undershoot the target as well but most alts lately have been either hitting the target precisely or overshooting then. I like this particular unconventional inverse head and shoulders because it has 2 necklines both with the same breakout target. *not financial advice*

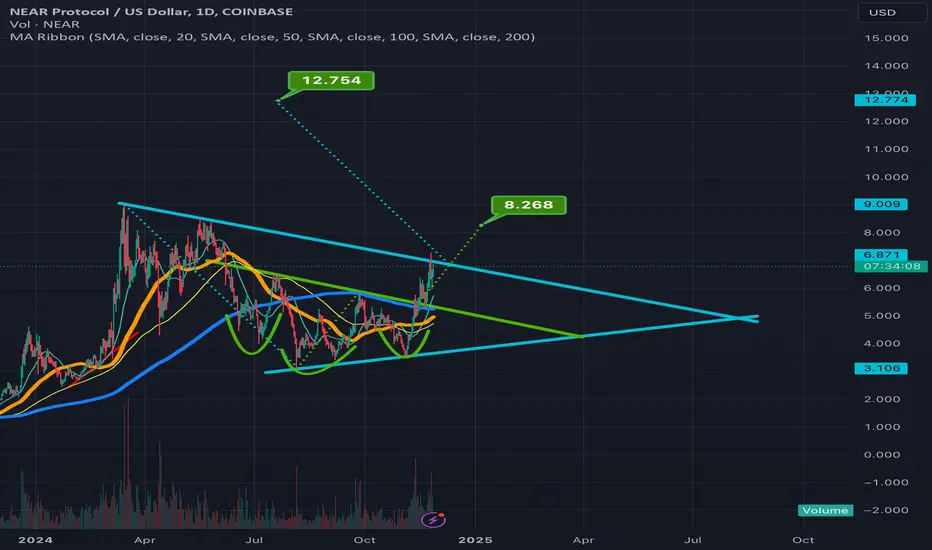
NEAR breaking up from invh&s and soon from symmetrical triangleIn order to reach the full inverse head and shoulder breakout target, NEAR will have to send price action well above the top trendline of this turquoise symmetrical triangle, in the process likely validating the breakout of that pattern too. *not financial advice*