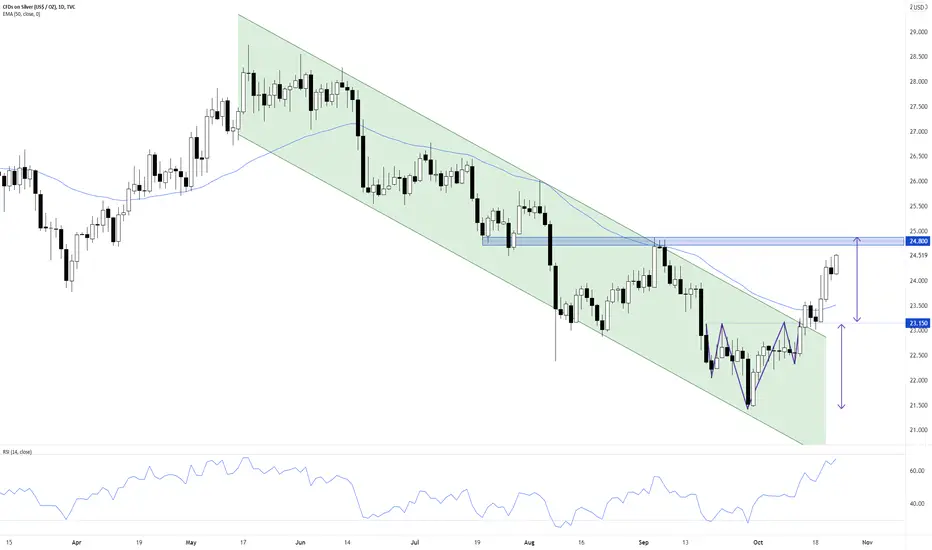
Is silver’s counter-trend rally nearly done?Silver has rallied an impressive 14% in less than a month off its late September low, more the tripling the corresponding gain in gold, but the rally may soon peter out as the metal approaches a key area of resistance near 24.80.
As our analyst Matt Simpson has been noting on twitter (@cLeverEdge) throughout the week, silver formed a well-defined “inverted head-and-shoulders” pattern in the latter half of September and first half of October. For the uninitiated, this pattern shows a shift from a downtrend (lower lows and lower highs) and an uptrend (higher highs and higher lows) and often marks a significant bottom in the chart.
The pattern was confirmed by last week’s break above the “neckline” at 23.15. The textbook interpretation of this pattern then points to a measured move objective equal to the height of the pattern, or roughly $1.70, up at $24.85 . Interestingly, this target area corresponds with the metal’s early September highs at $24.80.
Now, with the daily RSI indicator approaching overbought territory (70) and a key confluence of resistance levels in the upper-$24.00s, the odds are shifting toward at least profit-taking pullback to below $24.00 and potentially a resumption of the medium-term downtrend.
Only a confirmed break above the $24.80 would shift the medium-term bearish bias as the downtrend is called into question. Until then, the (medium-term) trend is the friend of silver traders, the recent sharp rally notwithstanding.
Invertedheadandshoulders
NVDA: I warned you about the "Gap Reversal Ritual"!Hello traders and investors! As crazy as this sounds, but after almost one month, NVDA did exactly what we expected.
It confirmed our theory about the “ Gap Reversal Ritual ” which we talked about in our last analysis ( link below), and now, it filled all its previous gaps, as we thought (I told you, I’ve never seen this structure failing). It only did one more gap after my previous analysis, which is something acceptable and this didn’t ruin the thesis at all – it just reinforced it .
The reversal pattern that triggered the Gap Reversal Ritual was this Inverted Head and Shoulders , which worked as a confirmation . Now, we are close to the previous resistance at $ 225, and we see a Trap Zone , as the 21 ema is going up, squeezing the price against the resistance. If we are going to lose the 21 ema, or break the resistance, we don’t know yet, but we can work with scenarios in the daily chart.
If we break the resistance, NVDA will probably seek the ATH again, as the momentum would be very strong. If we lose the 21 ema in the 1h chart, we'll probably seek the 21 ema in the daily chart.
Now the situation on NVDA is not as easy to read as it was last month, but we can still work with targets.
If you liked this analysis, remember to follow me to keep in touch with my daily studies on stocks and indices.
Have a good day.

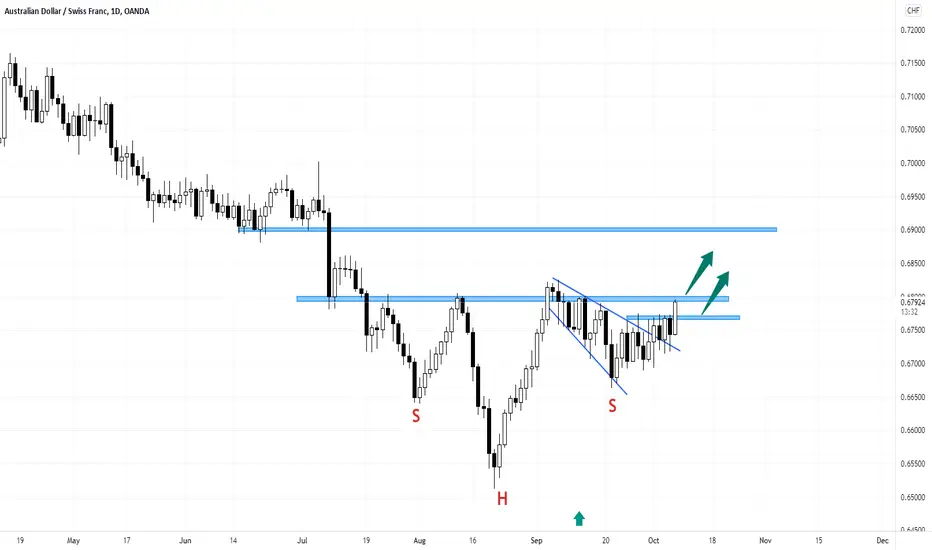
aussie swiss, kangaroos will be eating emmentalinverted H&S spotted, it broke the neckline. i think that it will retest the neckline and the uptrend structure that at this point are very close. this level coincides with a 61% fib correction of the move too.
target is the projection of the "head", that coincides with the 161%fib extension.
i will place my order at 0.683, the sl right below the 38% fib retracement at 0.674, targeting 0.709, just bellow the 161% extention.
i guess that this is not financial advice bla bla bla, it's just what i'm gonna do.
trade safe and risk mannage like if your life depended on it.

SCGP | Inverted Head & Shoulders | Buy signal - TP 68.50 (+11%)Thailand SET | SCGP | Target Price 68.50 | Resistance 64.00 EMA50 POC VA | Stop Loss 59.00
> Inverted Head & Shoulders showing Buy Signal after recent Smart Money and Banker Chips strong signals
> Main Elliott Wave Position 4 with positive banker chip signal

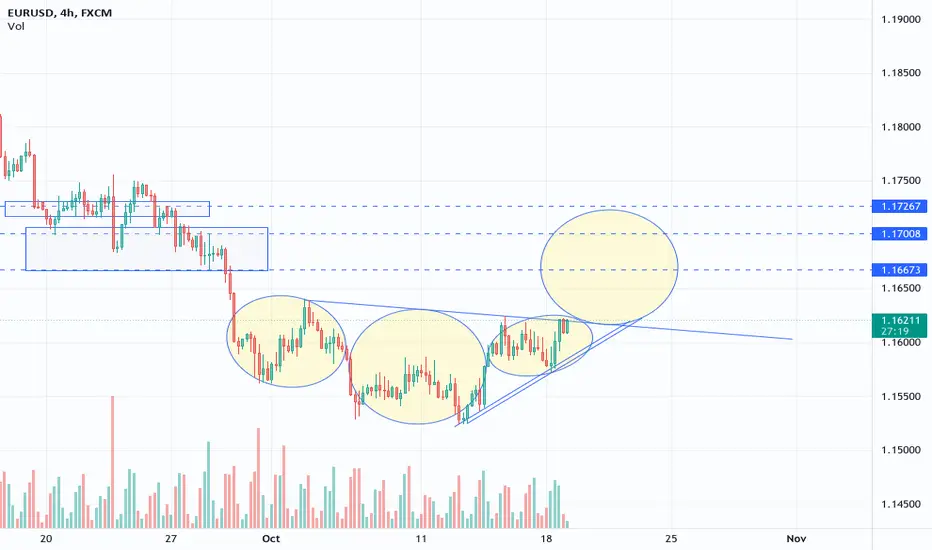
Guess i'm the head and shoulder guyi like head and shoulders, i find them the easiest pattern to trade, spotted this one on EU
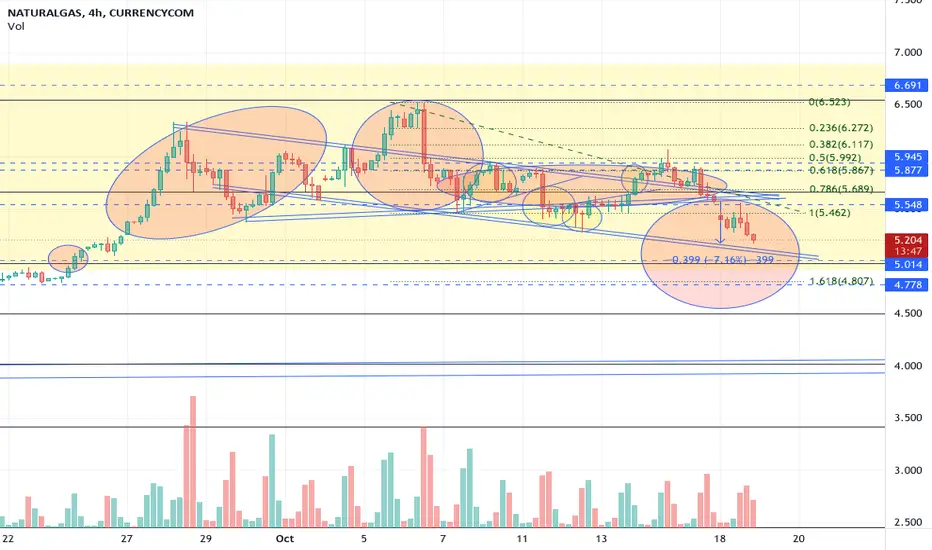
i'm (as always) so stupidi have this shit circles(H&S) on my chart since a wile, yesterday i set a sell order at 5.55, and 10 min later i canceled it because of lack of confidence. i think ti will retrace to 5.46, but at this point it's just too risky entering, the perfect entry was yesterday.
will look for buy opportunities AFTER the bounce, could find floor at 4.80ish
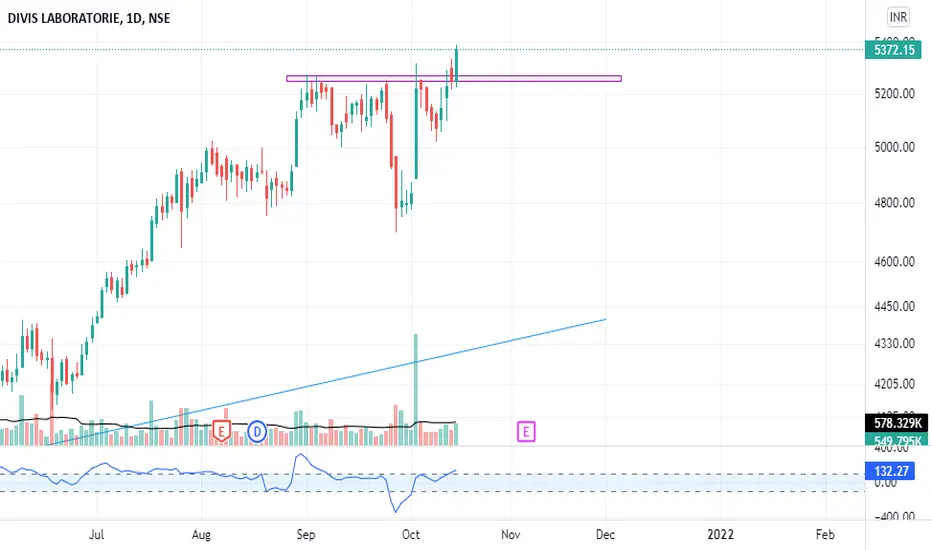
DIVISLAB BreakoutInverted Head and shoulder breakout
SL- around 6 percent (below right shoulder)
Entry at CMP
I don't think anymore explanation is required -chart is Self-explanatory
#LearnInPublic
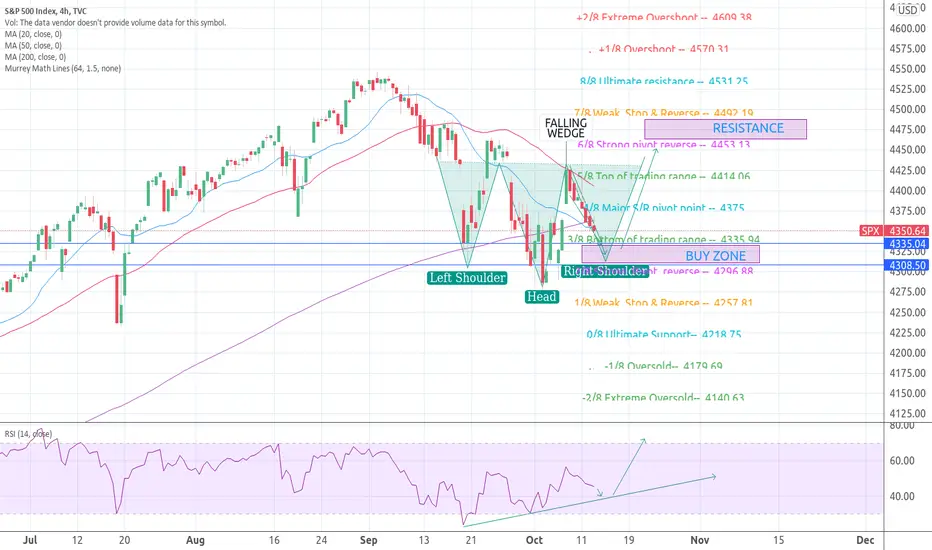
EQUITIES NEAR MURREY MATH PIVOT: TRIPLE WITCHING FRIDAYPrice entering Buy Zone. Expect pivot within 3-5 trading days IMO. Falling Wedge formation, inverted H&S on Right Shoulder.
Friday will be daunting and may well mark the LOTM. September Triple Witch was ferocious, expect more same. Pivot likely Mon 18 Oct IMO.
This ain't investing advice, Do Due Diligence, GLTA!!
EURCAD LONG IDEAHey guys, this pair is currently trading on the daily support. There's a double bottom on the daily time frame. On H1, we see an inverted head and shoulder pattern which is a reversal pattern. I'm long on this pair. My bias will be invalidated incase that daily support zone is broken.
Happy trading
Prince Pipes - Inverse H&SFundamentally Strong Share along with very good fundamentals.
Good for both long term and short term.

AUDCHF Idea 10/10/2021Idea for AUDCHF. Beautiful daily inverted head and shoulders. Currently waiting for price to break through and retest the neckline.
Super easy price action...
Trade responsibly

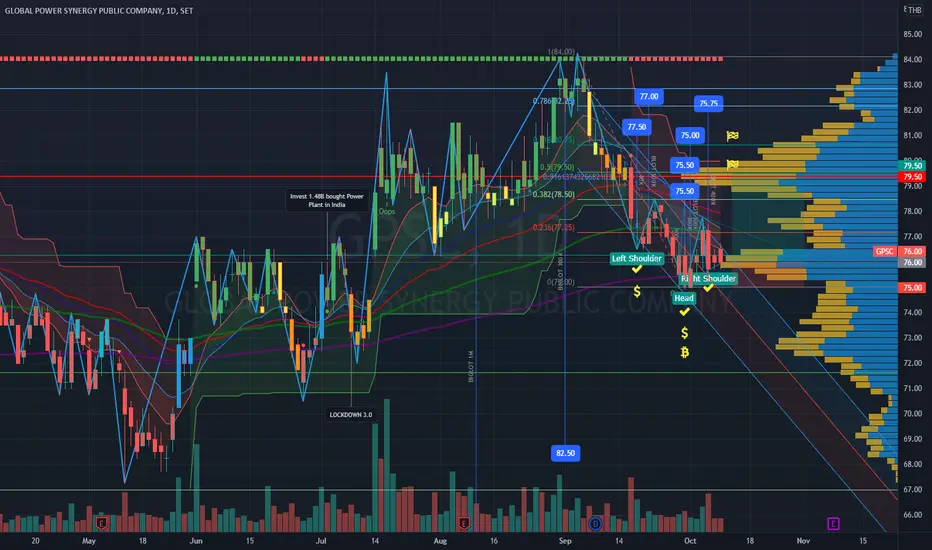
GPSC | Buy Signal-Inverted Head & Shoulders TP 80 (+5%) SL 75GPSC Buy Signal Position | Smart Money | Big Lots | Banker Chips | Inversed Head & Shoulders Target Price 1: 80 +5%, stop loss 75.
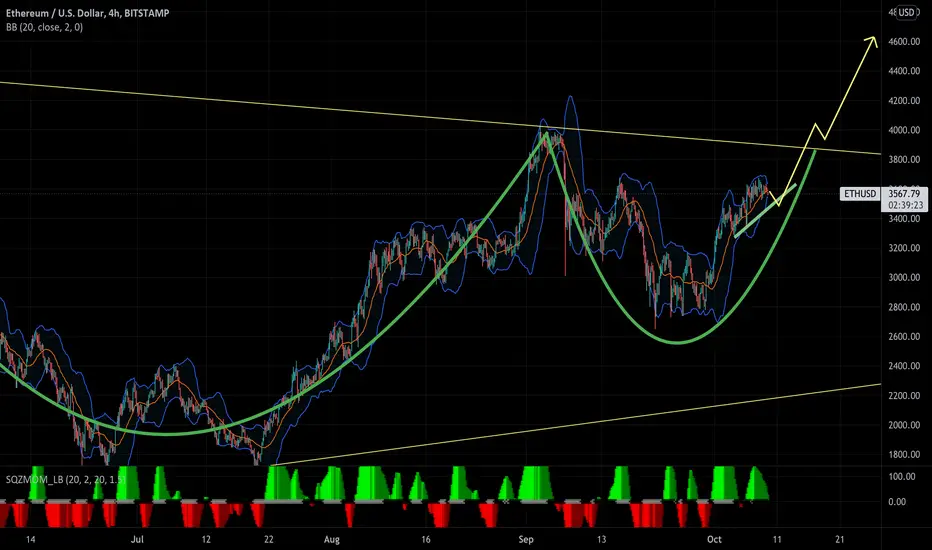
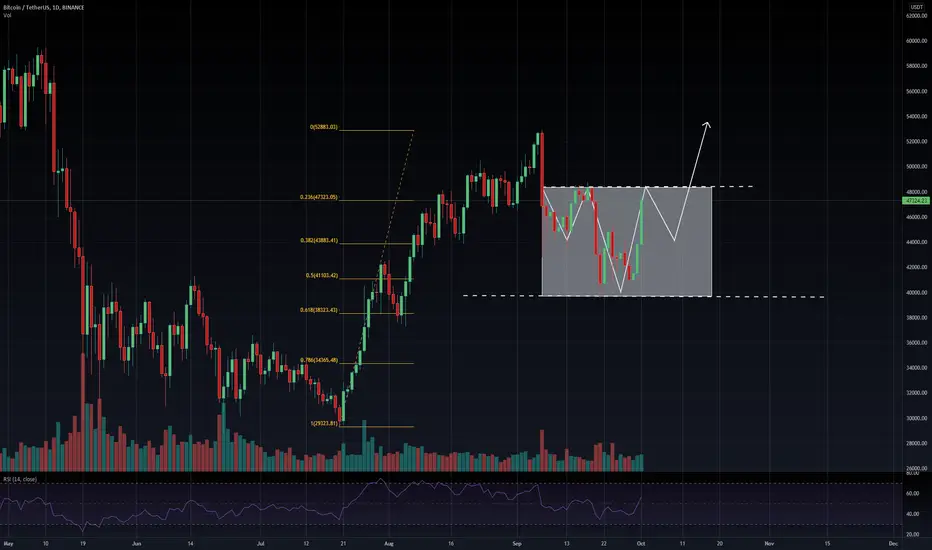
Don't be fooled, we won't see that big of a correction short trmToo many people see the cup and handle, if you're waiting to enter for a dip, I think you will be frontrun .
Don't try waiting to buy in the 5,400's too many people will open leveraged longs. Really? Do you think you're the only one with that idea? Everyone wants to long there for the f***cking mega-giga-pump cup and handle that is clear as day to all of these noob traders who have read one TA book in their life.
DONT GET FRONTRUN.
LITHUSDT - Accumulation phase.. Watch for bullish momentum!Watching for a change in Market Structure.
Sideway accumulation, Confirmation of bullish momentum is key here before making a move.
Break and retest of 0.03c area = Entry
Invalidation - Break of current support

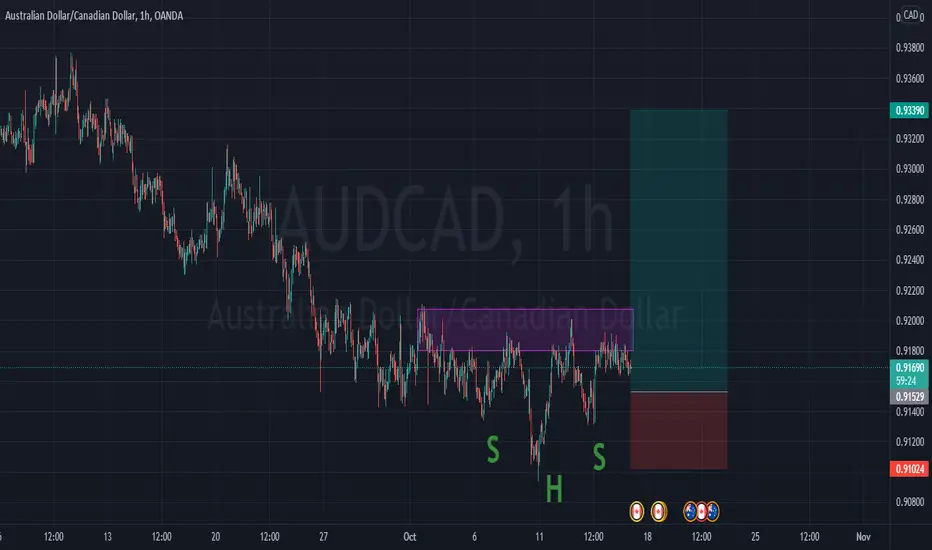
AUDUSD LONG IDEAHey guys, on the h4 timeframe, this pair broke out on the upper side. i expect a retest for it to continue with the upward movement. There's also an inverted head and shoulder pattern which also supports my bullish bias.
Happy trading.

AUDCHF, D1 - inverted HSH pattern should bring some move upHead and shoulders pattern. Breakout of neckline is needed as confirmation. Target is next resistance level
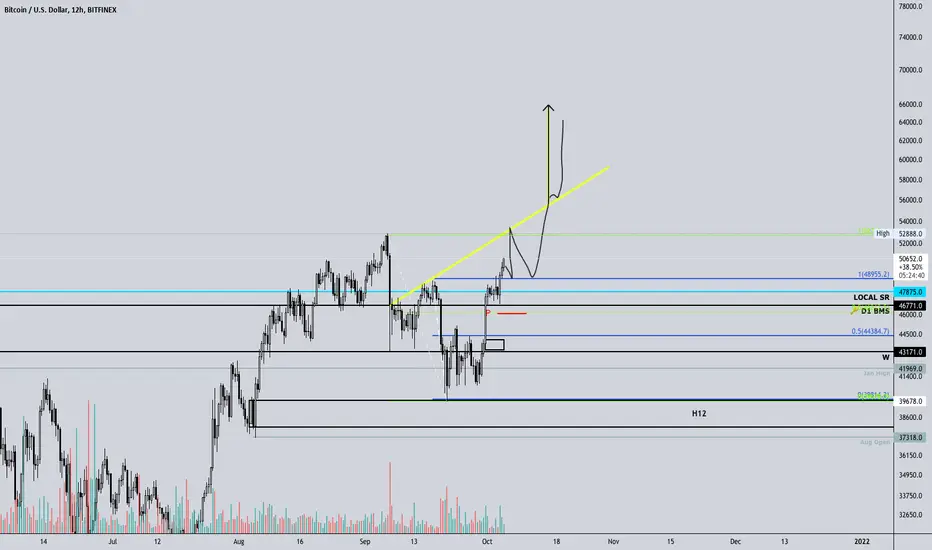
BTC/USD - Inverted H&S Forming? Everyone is calling for a 45k retrace...BTC probably won't give it to us. What about a retrace to 48k..we shall see!
AU inverted head & shouldersForming inverted head&shoulders on 4H timeframe. Look for a strong bull market.

AAVEUSDT Inverted Head and Shoulders!/Trading StrategyBYBIT:AAVEUSDT
Notice in chart---Red: rise; Green: fall.
1H trend chart
-
Obvious Inverted head and shoulders is building
Once the neckline of this H and S is broken out, which is previous resistance zone, trading strategy as below.
-
Profit Targets:
a) 328~334.6----Fib(1.272~1.382)
b) 348.75-----Fib(1.618)
c) 371.65-----Fib(2)
-
Trading is a reflection of yourself, sometimes you need to take a step back to see more.
Learn more daily and Be ready for any opportunities daily.
Have a nice trading day guys!

My prediction on BTCUSDT hope you guys like it :)I believe we can see forming inverted head and shoulder on a daily chart, so i think the price will go up.
AUDCHF🤑Head and shoulders 📉At this point, the price is finishing drawing the inverted head and shoulders pattern. It can be seen very well on the daily chart, it was expected that the price will reach the resistance level, but when the channel is broken through, the sellers pushed the price. So in connection with a false channel breakout, I expect a local fall right up to the center of the descending channel, but the general priority for now is to buy.
Have a nice trade!

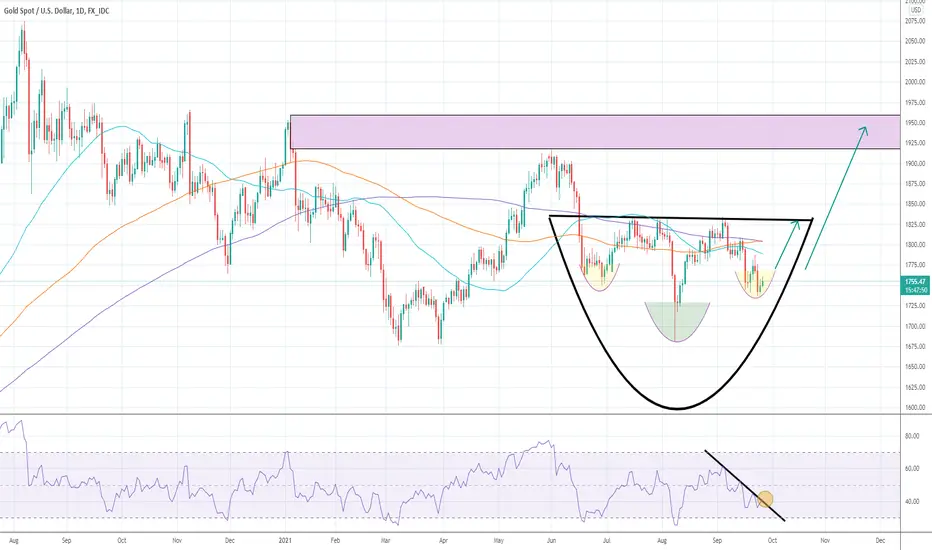
GOLD - Smiley Face for Bulls ?Gold seems to form a "smiley face pattern" (inverted head & shoulders pattern) on the chart. This is a classic bullish reversal pattern.
Though sentiments do not support bullishness due to fundamental news but we think gold price is mostly priced in for any monetary changes ahead.
There are two levels of support that gold needs to hold: 1740-1760 and 1680-1700.
Daily candle might form an inside day pattern. RSI seems to break small downtrend.
It is good to long gold at 1st support level: 1740/1760 with tight stop-loss. We can targets 1820/1840 on the upside.
A futher target at 1920 only resistance at 1835 is taken out. Under 1675 then this assumption is invalid.
Monthly IHNS Looking to Continue off a Double Bottom BreakoutThis is a weekly continuation entry to a much longer term bullish trade on the monthly for this pair that can be found in the related ideas tab
