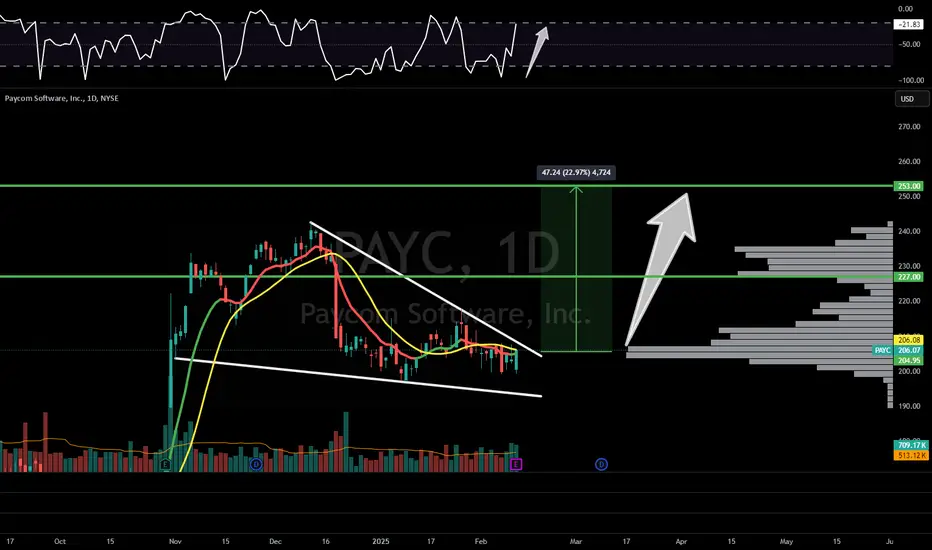
$PAYC: Can we hit another earnings LOTTO?!NYSE:PAYC : Can we hit another earnings LOTTO?!
Bought some March calls here.
Tech Services/ SaaS has been hot
🎯$227🎯$253
Not financial advice
Investing
$RBRK - Laying out the Rubrik for youNYSE:RBRK - Laying out the Rubrik for you
- Bull Flag Breakout
- Tech Services name
- Green H5 Indicator
- Volume shelf and GAP fill
$88 Inbound!
Not financial advice

$SMCI (SUPER MICRO COMPUTER): AI-DRIVEN GROWTH AMID GOVERNANCESMCI (SUPER MICRO COMPUTER): AI-DRIVEN GROWTH AMID GOVERNANCE WOES
1/8
Super Micro Computer ( NASDAQ:SMCI ) just revealed prelim Q2 FY2025 sales of $5.6–5.7B (+54% YoY), riding AI’s wave. But delayed filings & margin pressure spark caution. Let’s dig in! 💻⚡️
2/8 – REVENUE & EARNINGS SNAPSHOT
• Q2 sales: $5.7B (vs. $5.9B est.), EPS: ~$0.59 (est. $0.64)
• Full-year outlook trimmed to $23.5–25B (was $26–30B)
• Non-GAAP gross margin: ~11.9%; operating margin: ~7.9%—still under pressure 🏭
3/8 – KEY FINANCIAL EVENTS
• $700M in 2.25% convertible senior notes → fueling AI server growth
• Filing delays (10-K, 10-Qs) → must meet Feb 25, 2025 to avoid Nasdaq delisting
• New auditor BDO checks the books—no fraud found, but concerns linger about governance 🧐
4/8 – GOVERNANCE & INVESTIGATIONS
• Ongoing SEC & DOJ probes after Hindenburg’s short-seller report
• CEO says they’ll meet filing deadline, but trust is still shaky
• Market watchers: “No fraud found” is good, but the uncertainty stings 🤔
5/8 – SECTOR CONTEXT
• Competes with Dell ( NYSE:DELL ), HPE ( NYSE:HPE )—both see AI demand, but SMCI more focused
• SMCI trades at ~11x 2025 earnings (vs. Dell at 15x, HPE at 12x)
• Could be undervalued—but only if governance issues don’t overshadow the AI growth story 🚀
6/8 – RISKS
• Margin Pressure: R&D + product mix + potential GPU shipment delays (Nvidia Blackwell)
• Debt Load: Total debt now ~$1.9B, plus $700M in convertible notes
• Regulatory Overhang: Missing that Feb 25 deadline = serious delisting risk ⚠️
7/8 Is SMCI worth the gamble?
1️⃣ Bullish—AI potential outweighs the risks
2️⃣ Neutral—Need clarity on filings & margins
3️⃣ Bearish—Governance red flags trump growth
Vote below! 🗳️👇
8/8 – STRATEGIC OUTLOOK
• 70%+ revenue from AI platforms → big edge if servers remain hot
• Partnerships w/ Nvidia & push into liquid-cooled data centers
• Delaying or messing up compliance could sabotage all that potential 🌐

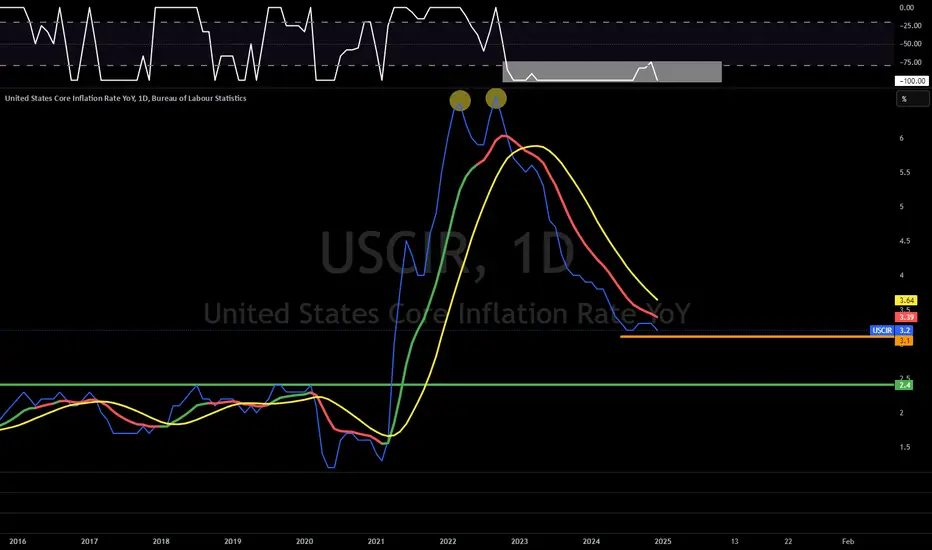
My CPI/ Inflation PredictionECONOMICS:USCIR NASDAQ:QQQ AMEX:SPY AMEX:IWM
We are just 15 minutes away from some very important inflation data coming out.
Here is my prediction: 3.1 YoY CPI or Lower
- Double top to drop continues
- Had a small lower high form and deflect off the 9ema
- Curling over and pointed down again
- Bearish WCB is still thriving
- The trend is your friend and the trend says we are going to continue to fall lower
Not financial advice
Sideways Markets? Heres why Im still getting paidSideways Market? Here’s Why I’m Still Getting Paid | SPX Market Analysis 12 Feb 2025
The markets may be moving like molasses, but that’s no problem when you’re getting paid to wait. While others are watching charts in frustration, our Theta decay is quietly dripping profits into our accounts. No rush, no panic—just letting the market do its thing while we collect.
Let’s break it down…
---
SPX Deeper Dive Analysis:
📉 Markets Are Moving Sideways—And That’s OK
SPX is stuck in a range, drifting aimlessly while traders wait for direction. But unlike those who need a big breakout to make money, we’re already profiting while standing still.
💰 Theta Decay – The Power of Getting Paid to Wait
While the market meanders, options lose value
That lost value turns into profits for our income trades
Instead of hoping for a massive move, we collect steady gains
📌 The Current Market View
We still anticipate a move from the upper range to the lower range 📉
No need to force trades—our edge is patience
If SPX moves, great. If not, we still win
🔑 Why Income Trading Wins in a Sideways Market
Unlike traditional trading methods where:
❌ You need a strong directional move to profit
❌ You rely on timing the market perfectly
❌ You risk getting stopped out too soon
We simply:
✅ Let Theta decay work in our favour
✅ Profit even when the market goes nowhere
✅ Have time on our side—no need for constant action
📌 Final Takeaway?
The market may be stuck, but profits aren’t. Theta is working, our positions are intact, and there’s no stress—just steady gains.
---
Fun Fact:
📢 Did you know? The S&P 500 has spent nearly 80% of its time trading sideways rather than trending up or down.
💡 The Lesson? The market isn’t always moving—but smart traders don’t need it to. That’s why income trading thrives when others struggle.
$GOLD EASES FROM RECORD HIGHS AHEAD OF U.S. INFLATION DATAGOLD EASES FROM RECORD HIGHS AHEAD OF U.S. INFLATION DATA
1/7
Gold hit a record high of $2,942.70/oz on Feb 11, fueled by safe-haven demand amid fresh U.S. tariffs. Today, it’s dipped 0.2% to $2,892.50 as investors take profits and watch U.S. inflation data. Let’s dig in! 💰⚖️
2/7 – RECENT PRICE ACTION
• All-time high at $2,942.70/oz—sparked by President Trump’s 25% tariffs on steel & aluminum
• Spot gold now at $2,892.50 (↓0.2%), with futures at $2,931.40 (↓0.1%)
• The rally’s paused—are we in for a short breather or a bigger correction? 🤔
3/7 – TARIFF TENSIONS
• 25% tariffs raise global trade war fears, boosting gold’s safe-haven appeal
• Markets worried about inflation, as import costs could climb
• Gold remains a hedge against economic uncertainty and currency devaluation 🌐⛔️
4/7 – MACROECONOMIC DRIVERS
• Fed Chair Powell’s hawkish comments on rate policy sent gold lower—higher rates often weigh on non-yielding assets
• U.S. inflation data (due soon) could shape the Fed’s next move—any upside surprise might strengthen the dollar, pressuring gold further
5/7 – INVESTOR SENTIMENT
• Profit-taking: After a massive run-up, traders might lock in gains
• Safe Haven: Still an underlying bullish sentiment if tariffs escalate
• The $2,900–$2,950 range is in focus—will gold consolidate or stage another breakout?
6/7 Where’s gold heading next?
1️⃣ Above $3,000—safe haven demand remains strong ✨
2️⃣ Sideways around $2,900—pausing for data 🏖️
3️⃣ Back under $2,850—hawkish Fed sinks gold ⬇️
Vote below! 🗳️👇
7/7 – STRATEGY WATCH
• Short-Term: Watch U.S. inflation data & dollar moves—gold typically moves opposite the greenback
• Long-Term: If tariffs stoke inflationary pressure, gold may shine even brighter. Keep an eye on geopolitical developments! 🌎

100% Gains in Walmart! What’s Next at This Key Level?Hello readers,
Back in July 2023, I pointed out a major breakout in Walmart (WMT) after years of struggle around the $150-$154 zone. Fast forward, and here we are – Walmart has doubled in price! 📈
Of course, this isn't the raw $300 we might expect because of the 3-for-1 stock split, but the percentage gain remains a solid 100%+ from our entry.
What Now?
$100 is a round number, and historically, NYSE:WMT has reacted to these psychological levels. The market has started to range in these level, suggesting some hesitation.
Taking partial or full profits could be a smart move – but as always, the choice is yours!
This is just a reminder and a heads-up to stay aware of price action. Trade smart! 💡
Let me know your thoughts – are you holding or booking profits?
Cheers,
Vaido

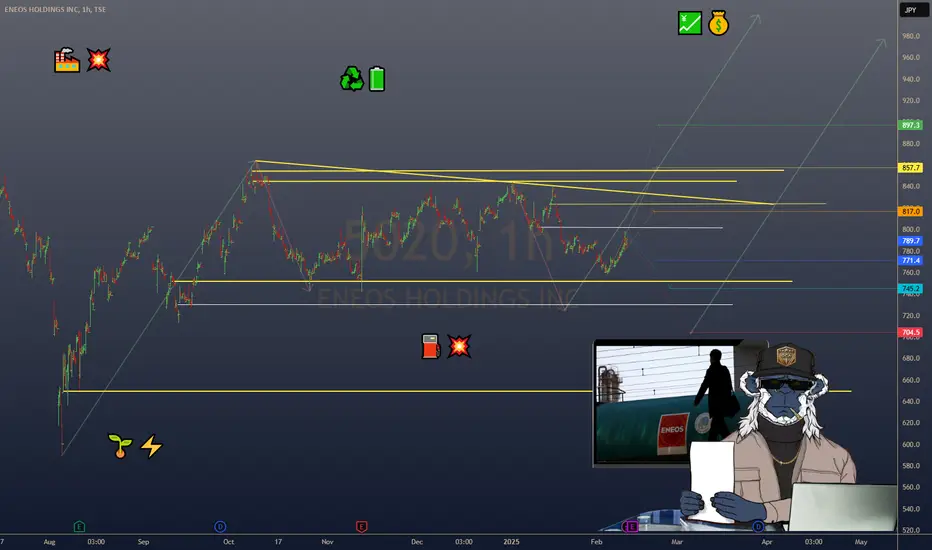
$5020.T ENEOS HOLDINGS: REVENUE GROWTH, MAJOR IPO ENEOS HOLDINGS: REVENUE GROWTH, MAJOR IPO & DECARBONIZATION STRATEGY
1/8
Big News: Eneos Holdings ($5020.T) reported ¥14.97T revenue for FY 2024 (+9.8% YoY) thanks to higher oil prices & solid refining demand. They’ve also announced a massive JX Advanced Metals ($JXAM) IPO worth up to ¥460B—Japan’s largest in 7 years! 🏭💥
2/8 – EARNINGS SNAPSHOT
• FY Net Income: ¥320.5B (↓12% YoY) due to rising costs & green investments 🌱⚡️
• Q3 Net Income: ¥85.4B (+3% QoQ) on cost optimization + refining margin boost
• Dividend: ¥22/share—they’re not skimping on shareholder returns 💹💰
3/8 – SIGNIFICANT FINANCIAL EVENTS
• JXAM IPO coming Mar 19, 2025—selling 50.1–58% stake
• Could raise $2.6– SEED_TVCODER77_ETHBTCDATA:3B —funding Eneos’ decarbonization pivot & fueling shareholder value 🚀
• Market reacted positively (+1% in Eneos stock), while broader Japanese market stayed flat ⚖️
4/8 – SECTOR COMPARISON
• Valuation: P/E ~8.5 vs. global oil refiners (~10.2) & metals (~12.1) 🔎
• Revenue Growth: +9.8% outpacing Shell (6.2%) & ExxonMobil NYSE:XOM (7.8%), but below BHP (12.4%)
• Undervalued? P/B ~0.9 vs. sector avg. 1.3, EV/EBITDA 6.8 vs. peers at 7.5. Looks attractive! 🔥
5/8 – RISK FACTORS
• Oil Price Volatility: Refining margins can flip on a dime ⛽️💥
• Geopolitical Tensions: Japan relies heavily on energy imports 🌏
• Energy Transition Costs: ¥150B budget for renewables—major capex needed ♻️🔋
• JXAM IPO Execution: A poor market reception = potential stock hit ⚠️
6/8 – REGULATORY & DECARBONIZATION
• Japan targets net-zero by 2050—Eneos faces higher compliance costs 🌐
• Carbon capture & hydrogen investments: Could future-proof Eneos, but short-term margins may tighten 🤖⚡️
7/8 – SWOT HIGHLIGHTS
• Strengths: Diversified (refining + metals + renewables), top-tier Japanese refiner 🏆
• Weaknesses: Profit margin (2.1%) lags peers, heavy capex for transition 😬
• Opportunities: JXAM IPO frees capital; renewables & hydrogen for growth 🌱💡
• Threats: Shift away from fossil fuels, market skepticism 🚫⚡️
8/8 Where do you see Eneos in 2025?
1️⃣ Bullish—Decarbonization + IPO = huge upside! 🐂
2️⃣ Cautiously Optimistic—Valuation looks good, but risks are real 🤔
3️⃣ Bearish—Oil refining can’t outrun global transitions 🐻
Vote below! 🗳️👇
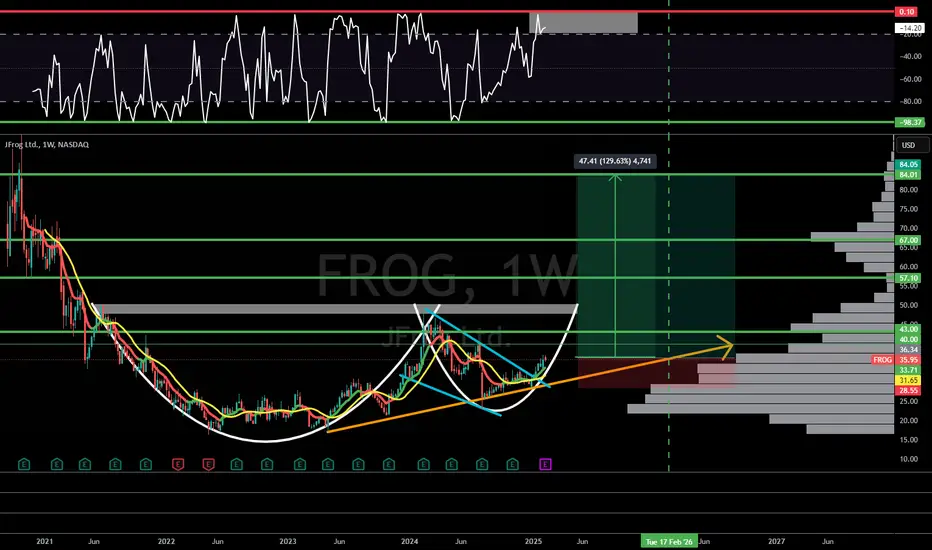
$FROG - About to fly! 129% Upside potentialNASDAQ:FROG
As I've been calling out for the past month Tech Services and SaaS companies are the next phase of Ai and very hot right now based on the massive moves after meh to good earnings from the likes of NASDAQ:TEAM NASDAQ:MNDY NYSE:NET NASDAQ:CFLT
I believe this trend continues and this small 4B Mkt Cap company could really get going after earnings on Thursday!
- CupnHandle forming while Bull Flag breaking out
- Two year trendline is our safety net
- Massive Volume Shelf with GAP
- H5 Indicator made bullish cross and is GREEN
- WCB has formed
PTs: $43/ $57/ $67/ $84
NOT FINANCIAL ADVICE
Mobileye: The GAP is a TrapNASDAQ:MBLY : Calling it again!
The GAP is a Trap!
I'll gladly buy more with my Covered Calls Premium I made after that last POP! 😋
$20+ is coming! 🎯
Recent Lyft Robotaxi partnership news had them ripping to a tune of 18% at one point yesterday.
A massive pullback today, and I believe we will fill this GAP before continuing higher.
Not financial advice

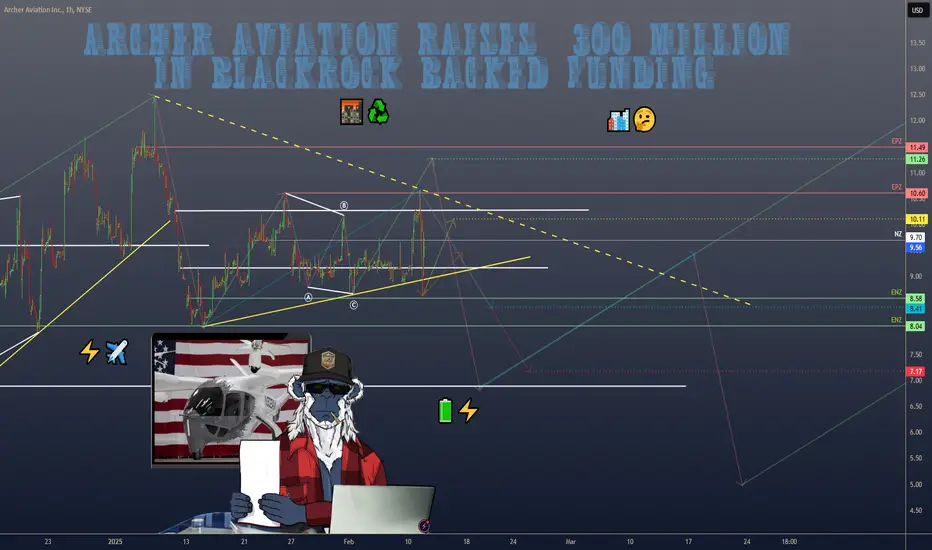
$ACHR ARCHER AVIATION SCORES 300M BOOST BLACKROCK JOINS THE RIDEARCHER AVIATION SCORES $300M BOOST—BLACKROCK JOINS THE RIDE
1/7
🚀 $300M just landed in Archer Aviation’s pocket! Major institutional investors like BlackRock are backing Archer’s quest to dominate the eVTOL game. Ready to see why this funding is a big deal? Let’s go! ⚡️✈️
2/7 – WHAT’S ARCHER BUILDING?
Midnight Aircraft: Designed for short urban flights (~20 miles) with rapid turnarounds.
Targets commercial operations by 2025, battling congestion & pollution. 🌆
Hybrid Approach: Electric + other propulsion to boost range and expedite FAA certification.
3/7 – BLACKROCK’S INVOLVEMENT
Big Vote of Confidence: World’s largest asset manager sees serious potential. 💪
Aligns with green investing—eVTOLs can slash emissions compared to helicopters. ♻️
Could draw more partnerships and capital to Archer’s runway.
4/7 – WHY COMPOSITES & BATTERIES MATTER
Composites: Lighter & stronger materials = extended range & higher efficiency. 🏋️♀️
Batteries: High-energy density is critical for flight duration & payload. 🔋⚡️
Archer’s push here signals they’re tackling the industry’s biggest hurdles head-on.
5/7 – FINANCIAL & STRATEGIC IMPACT
Stronger Balance Sheet: $300M for R&D, testing, manufacturing. 💼
Timing is key: Archer eyes FAA approval soon—this cash could speed up that process. ⏱️
Competing with Joby, Vertical Aerospace, Lilium—the race is on! 🏁
6/7 Are eVTOLs the future of urban travel?
1️⃣ Absolutely—Game-changer for city traffic! 🏙️
2️⃣ Maybe—Need more proof and better tech. 🤔
3️⃣ Nope—I’m still skeptical about costs & safety. ❌
Vote below! 🗳️👇
7/7 – INDUSTRY CONTEXT
Market could hit $1.5T by 2040 (Morgan Stanley). 💰
Key markets: US, UAE, Japan, India—Archer is eyeing them all. 🌏
eVTOLs promise faster, greener commutes, but hurdles remain: regulations, infrastructure, battery tech.
Strengths: Archer’s recent $300 million funding, strategic partnerships, and regulatory progress position it well to compete in the eVTOL market. Its focus on composites and batteries aligns with industry needs.
Weaknesses: High R&D costs, limited manufacturing capacity, and lack of commercial revenue highlight financial and operational challenges.
Opportunities: The growing eVTOL market, international expansion, and defense applications offer significant growth potential.
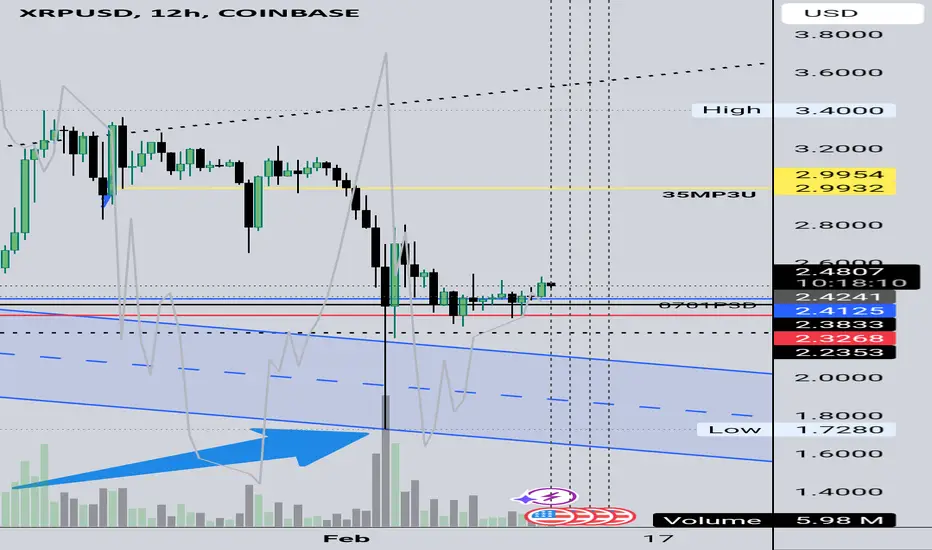
XRP SeekingPips is strictly Technical - XRPUSDT BUYING LONG ONLY⚠️ SeekingPips has ZERO interest in FINANCIAL NEWS.
ℹ️ After years of real market trading 🟢SeekingPips🟢 has defined his TRADING EDGE which DOES NOT require any fundermental study or research.✅️
🌍 For some FUNDERMENTAL ANALYSIS is a key to their TRADING and INVESTING.
🌟The SECRET is to find WHAT WORKS FOR YOU! Absolutely nothing else matters.
⭐️TIME & PRICE⭐️ is 🟢SEEKINGPIPS🟢 SECRET SAUCE
$BP’S COMEBACK? ELLIOTT’S STAKE & UNDERVALUATION BUZZBP’S COMEBACK? ELLIOTT’S STAKE & UNDERVALUATION BUZZ
1/7
BP ( NYSE:BP ) just got a jolt of activist energy ⚡️ as Elliott Management took a significant stake. Shares surged 7% to 464.75 pence—the highest since August. Are we witnessing the start of a big turnaround? Let’s break down the numbers.
2/7 – REVENUE RUNDOWN
• 12-month revenue (ending Sept 2024): $199.1B (↓13.72% YoY)
• Big contrast to 2022’s 51.58% revenue jump
• Post-pandemic swings? The energy rollercoaster keeps rolling. 🎢
3/7 – EARNINGS HIGHLIGHTS
• Q4 2023 net income: $371M vs. $10.8B the previous year 🤯
• Lower refining margins + weaker oil & gas production = big dent
• Still holding a “GOOD” Financial Health score—some resilience under the hood.
4/7 – ELLIOTT’S INVOLVEMENT
• BP’s 2023 performance: -16%—underperforming Shell (-4%) & ExxonMobil (+8%)
• Elliott sees untapped value? Activists typically target companies trading below intrinsic worth
• Market loves it: 7% daily pop signals new optimism. 🚀
5/7 – VALUATION SNAPSHOT
• TTM P/E ratio at 7.89—notably below Shell & Exxon’s multiples
• Some analysts call BP “undervalued” and point to further upside potential
• If Elliott drives restructuring or divestitures, could we see a sustained rally?
6/7 Is BP primed for a major comeback with Elliott on board?
1️⃣ Yes—Activists will unlock hidden value!
2️⃣ No—BP’s challenges run too deep.
3️⃣ Maybe—Need more clarity on strategy.
Vote below! 🗳️👇
7/7 – RISK FACTORS
• Commodity Volatility: Oil & gas prices can swing hard
• Regulatory & ESG Pressure: Green-energy pivot demands big $$
• Debt Levels: ~$20.9B net debt could limit agility
• Competition: Shell, Chevron, & Exxon aren’t standing still. ⛽️

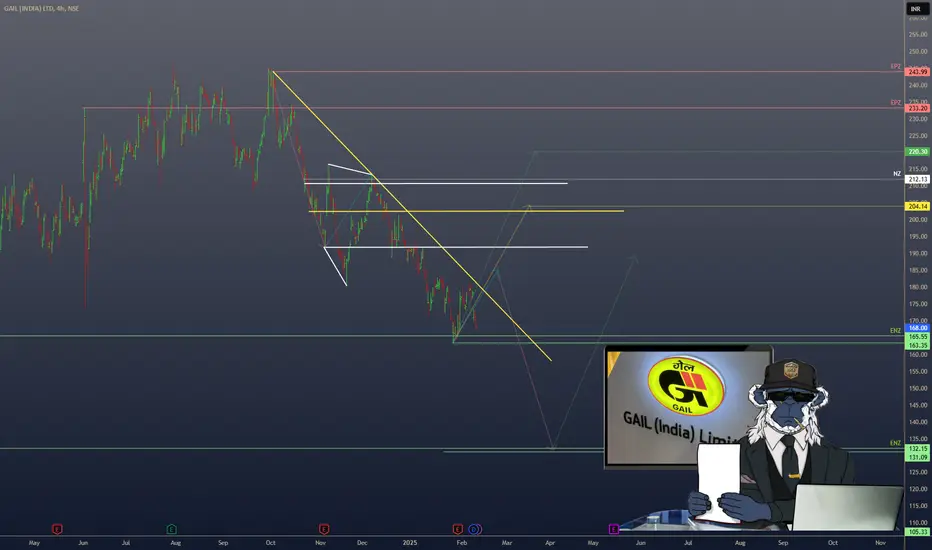
$GAIL REVIVES US LNG PLANS POST-TRUMP BAN LIFTNSE:GAIL REVIVES US LNG PLANS POST-TRUMP BAN LIFT
1/7
Good morning, energy traders! ☀️⚡️
Major shake-up in the LNG world: India’s GAIL is back on the hunt for a US LNG stake or long-term deals. What’s fueling this move? Let’s break it down!
2/7 – THE BACKSTORY
• Trump administration lifts the ban on new LNG export permits.
• GAIL had plans on ice since 2023—now they’re back in action.
• Sandeep Kumar Gupta (GAIL’s chairman) says: “We’re reviving our plans to buy a stake or sign long-term LNG contracts.”
3/7 – WHY IT MATTERS
• LNG Prices: Expected to soften post-2026 as supply ramps up.
• Impact on India: Cheaper energy imports, eye on boosting gas to 15% of energy mix by 2030. ♻️
• US Benefit: Strengthens position as a global LNG exporter—hello, bullish signals for Cheniere Energy (LNG) and Venture Global!
4/7 – MARKET IMPACT
• Prices: More supply could translate to downward pressure on LNG prices.
• Investment Angle: US LNG producers & infrastructure might see capital inflows. Keep an eye on relevant tickers!
• Energy Security: India aims for a cleaner, more reliable energy mix—this is long-term strategy at play.
5/7 – STRATEGIC ANGLE
• Aligns with India’s push to expand natural gas usage from ~6% to 15% by 2030.
• US Gains: Jobs, economic boost, and stronger foothold in global energy markets.
• Trade Partnerships: Could deepen economic ties between US & India.
6/8 What’s your take on GAIL’s US LNG strategy?
1️⃣ Bullish on US LNG exports 🐂
2️⃣ Bearish on LNG prices post-2026 🐻
3️⃣ Waiting for more clarity ↔️
Vote below! 🗳️👇
7/7 – YOUR TRADING PLAYBOOK
• Short-Term: Watch for volatility in LNG stocks (like LNG, Venture Global). GAIL might see a spike on renewed interest.
• Long-Term: Growing LNG supply + India’s energy push = potential contrarian bet on energy stocks before the broader market catches up.
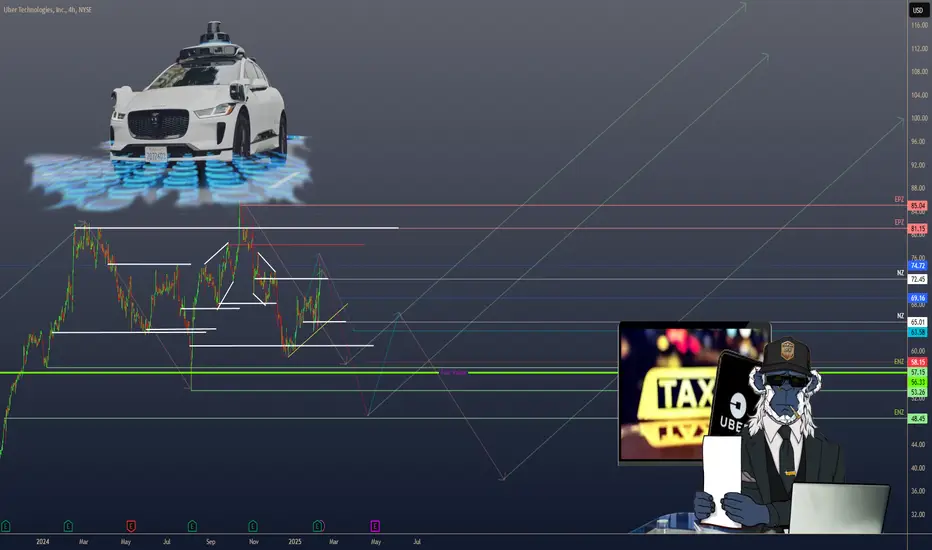
$UBER UBER’S RIDE TO PROFITABILITY & BEYOND?UBER’S RIDE TO PROFITABILITY & BEYOND?
1/8 Uber ( NYSE:UBER ) just keeps on rolling! 🚀🚖
From 20% YoY growth in gross bookings to a SEED_TVCODER77_ETHBTCDATA:7B stock buyback, here’s what you need to know about this market heavyweight.
2/8 – RECENT REVENUE GROWTH
• Q1 FY24: Gross bookings hit $37.7B (+20% YoY)
• Revenue: $10.1B (+15% YoY), beating estimates by FWB:40M
• Uber’s firing on all cylinders—mobility & delivery both on the rise
3/8 – EARNINGS & PROFITABILITY
• Operating margin up from -3% to 2%—that’s a serious pivot to profit
• Adjusted EBITDA soared 82% to $1.4B
• First annual profit since going public in 2019. Party time! 🎉
4/8 – BUYBACKS & BULLISH GUIDANCE
• SEED_TVCODER77_ETHBTCDATA:7B stock buyback → market approves, stock at all-time highs 📈
• Gross bookings outlook: +15–20% for the next 3 years
• EBITDA growth pegged at ~40%—can they keep the momentum?
5/8 – VALUATION SNAPSHOT
• Forward P/E ~35x—a bit high, but consider the growth & dominance
• Market cap ~$140B vs. robust free cash flow projections
• Competition (Lyft, DoorDash) often has higher P/E or shakier growth
6/8 Is Uber undervalued given its trajectory?
1️⃣ Yes—ride (and deliver) the wave!
2️⃣ No—too pricey at 35x forward P/E
3️⃣ Maybe—needs more proof (robotaxi success?)
Vote below! 🗳️👇
7/8 – SWOT/SCOT TAKE
Strengths: Global brand, diverse services, Waymo partnership 🤖
Challenges: Regulations, high op costs, fierce competition
Opportunities: New markets, AI, autonomous tech
Threats: Legal hurdles, changing consumer habits
8/8 – WHAT’S NEXT?
Uber’s aiming for an autonomous future—could that turbocharge margins? ⚡️🏁
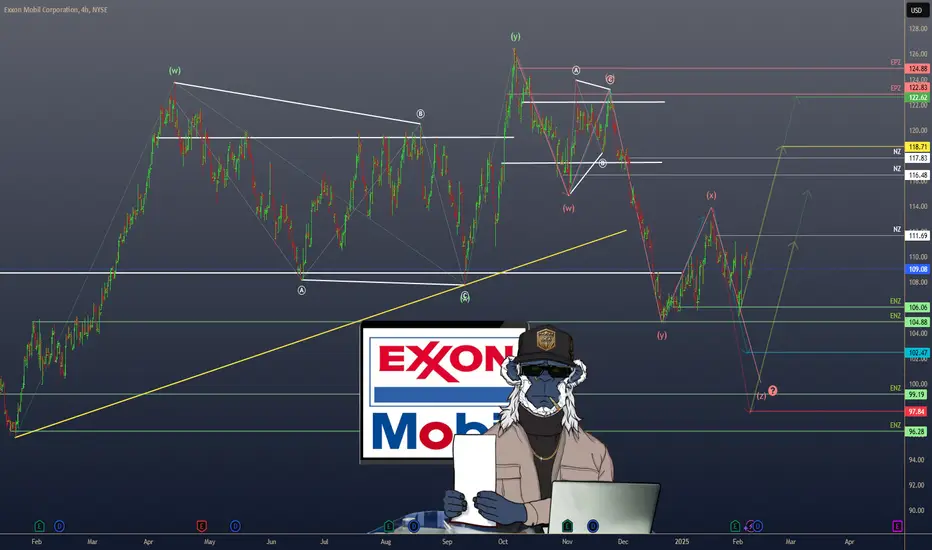
EXXONMOBIL ($XOM) EARNINGS & OUTLOOKEXXONMOBIL ( NYSE:XOM ) EARNINGS & OUTLOOK
1/7
ExxonMobil is back in the spotlight after Q4 2024 earnings. ⚡️💰
From a $59.5B Pioneer merger to record Permian production, there’s plenty to unpack. Let’s dig in!
2/7 – Q4 & FULL-YEAR EARNINGS
• 2024 earnings: $33.7B, down from $36.0B in 2023
• Q4 2024: $7.6B net income (~$1.72/share), with $12.2B in operating cash flow
• Distributed $36B to shareholders in 2024—talk about rewarding loyalty! 💸💥
3/7 – EXPANSION & STRATEGY
• Targeting higher output in Permian Basin & Guyana, despite oil oversupply
• FWB:20B annual share-repurchase program planned for 2025
• Recent Pioneer merger boosts upstream portfolio—long-term production potential just got a big upgrade 🚀
4/7 – VALUATION VS PEERS
• P/E ratio ~13–14, below the industry range (15–18) ✅
• Dividend yield ~3.5%, beating the 3.0% sector average
• Stacks up against Chevron ( NYSE:CVX ) & Shell ( NYSE:SHEL )—but ExxonMobil’s Guyana assets could be the real differentiator 🌍⛽️
5/7 – RISK FACTORS
1️⃣ Oil oversupply + OPEC+ cuts → Price uncertainty 📉
2️⃣ Global economic slowdown → Softens demand
3️⃣ Regulatory scrutiny → Heightened costs
4️⃣ Shifting to renewables → Could reduce big-oil momentum
6/7 Is ExxonMobil truly undervalued given its strong cash flow & dividend?
1️⃣ Yes – Undervalued gem
2️⃣ No – Oil oversupply risk is too high
3️⃣ Maybe – Need more clarity on renewables
Vote below! 🗳️👇
7/7 – SWOT SUMMARY
• Strengths: Advantaged assets (Permian/Guyana), robust cash flow 🏭
• Weaknesses: Reliance on oil price, smaller renewables exposure
• Opportunities: Pioneer merger, carbon capture, high-value chemical products
• Threats: Regulatory, oversupply, economic slowdown
$PYPL PAYPAL’S FINANCIAL LANDSCAPE: VALUATION & OPPORTUNITIESPAYPAL’S FINANCIAL LANDSCAPE: VALUATION & OPPORTUNITIES
1/8
PayPal ( NASDAQ:PYPL ) has been on the move lately—announcing a FWB:15B buyback and posting mixed but intriguing earnings results. Let’s dive into what’s making this fintech giant tick! 💳💡
2/8 – Recent Revenue Growth
PayPal’s revenue soared during the digital payment boom but has moderated recently.
Although the exact figures aren’t in the latest posts, growth since 2017 is substantial.
Stabilization might indicate a new normal in digital payments.
3/8 – Earnings & Guidance
Some quarters saw EPS pop by 61%—pretty impressive! 🚀
Mixed guidance ahead: margin expansion concerns and flat-to-down cash flow.
The FWB:15B buyback suggests management sees long-term potential.
4/8 – Valuation vs. Peers
Forward P/E near 10, PEG ratio of 0.52—that’s cheap compared to Visa/Mastercard.
PayPal straddles fintech + payments, competing with everyone from Square ( SET:SQ ) to Apple Pay.
Lower growth vs. some peers, but strong operating margins help PayPal stay ahead.
5/8 – Risk Factors
1️⃣ Regulatory: New rules could cramp expansion.
2️⃣ Market Saturation: Need emerging markets to fuel next leg of growth.
3️⃣ Competition: Stripe, Apple Pay, & countless fintech upstarts.
4️⃣ Tech Disruption: Blockchain, AI, or next-gen payments could reshape the landscape.
6/8 What’s PayPal’s biggest near-term challenge?
1️⃣ Regulatory Hurdles
2️⃣ Competition
3️⃣ Market Saturation
4️⃣ Tech Disruption
Vote below! 🗳️👇
7/8 – SWOT/SCOT
Strengths: Massive user base, recognizable brand, buyback confidence.
Weaknesses: Slowing user growth, uncertain future margins.
Opportunities: Emerging markets, strategic partnerships, AI integration.
Threats: Fierce competition, cyber risks, evolving payment tech.
8/8 – Your Next Move?
PayPal’s at a pivot—undervalued or a value trap? 💰
Let’s see if NASDAQ:PYPL can keep up the momentum!
#PayPal #Fintech #DigitalPayments #PYPL #Investing #Earnings #Valuation #Finance

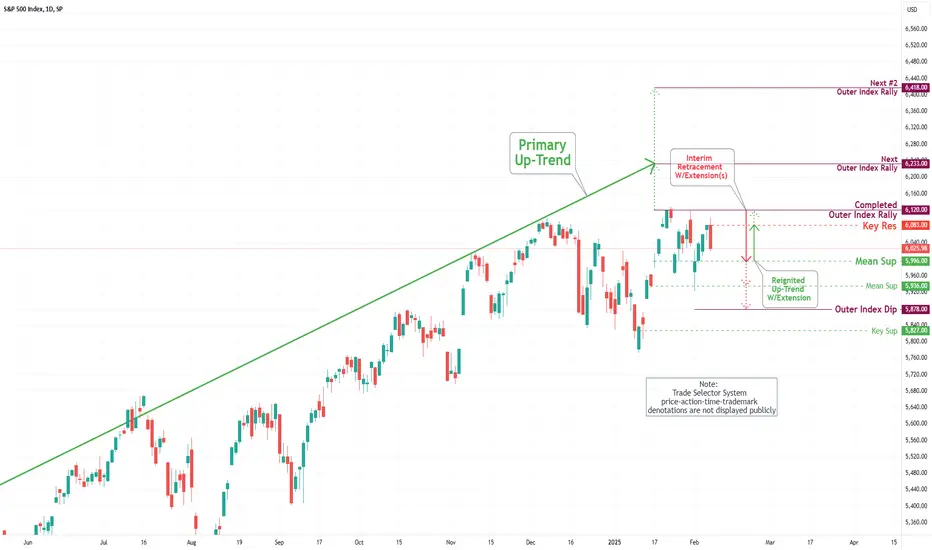
S&P 500 Daily Chart Analysis For Week of Feb 7, 2025Technical Analysis and Outlook:
During the weekly trading session, the S&P 500 effectively hit critical support levels at 5996 and 5936, respectively. A downtrend presently characterizes the market, as bullish momentum is stalled. Current analyses indicate that this downward trajectory will likely persist, with anticipated retesting of the Mean Support levels of 5996, the possibility of trading at Mean Support 5936, and a significant decline to the Outer Index Dip at 5878. Should this scenario not materialize, the market is favorably positioned for the subsequent phase of the bullish trend, with the test of the newly established resistance level at 6083 and revisiting the previously completed Outer Index Rally level of 6120.
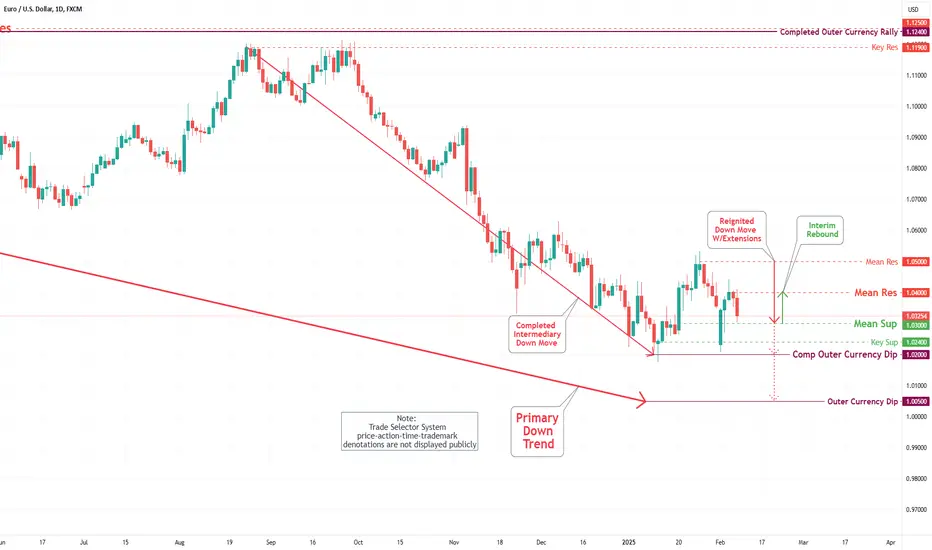
EUR/USD Daily Chart Analysis For Week of Feb 7, 2025Technical Analysis and Outlook:
During the trading session on Monday of the current week, the Euro reached the Key Support level of 1.024 and brushed off the completed outer Currency Dip at 1.020. This movement was followed by a significant rebound, establishing a new Mean Resistance level at 1.040, which is expected to be tested in the forthcoming trading sessions.
Conversely, the prevailing downward movement may prepare the price action for a subsequent decline if the anticipated rebound fails to materialize. This may lead to a revisit of the completed Outer Currency Dip at 1.020, further engaging with the Mean Support level at 1.030 and the Key Support at 1.024, ultimately progressing toward the specified outer Currency Dip target of 1.005.
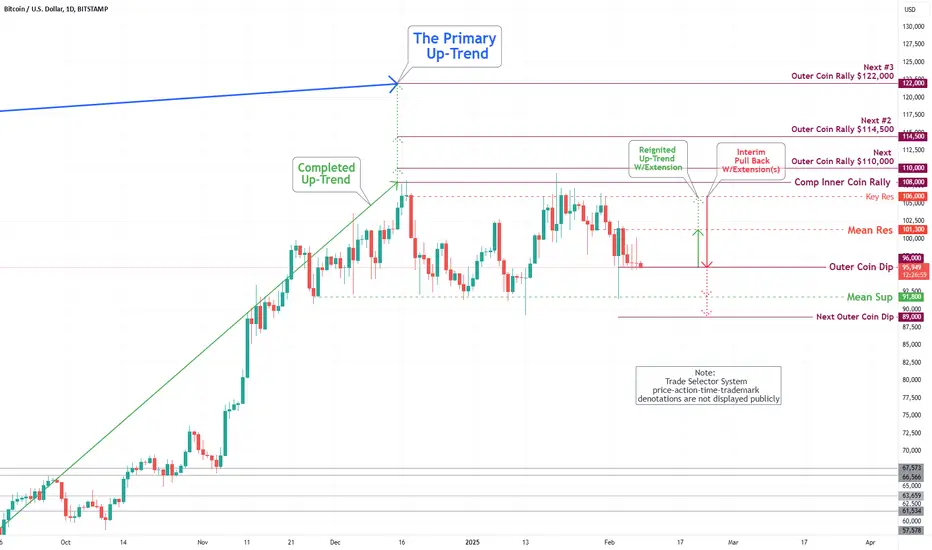
Bitcoin(BTC/USD) Daily Chart Analysis For Week of Feb 7, 2025Technical Analysis and Outlook:
On Monday, during the current week’s trading session, Bitcoin reached the Mean Support level of 91800 and consistently hit the targeted Outer Coin Dip at 96000. This development indicates a likely pullback to retest the Mean Support level of 91800, with the possibility of further decline down to the Outer Coin Dip located at 89000 before a potential resurgence in the bull market.
Conversely, the anticipated pullback does not materialize. In that case, the cryptocurrency may experience upward momentum, retesting the Key Resistance level at 106000 and potentially extending to challenge the completed Outer Coin Rally at 108000 and beyond.
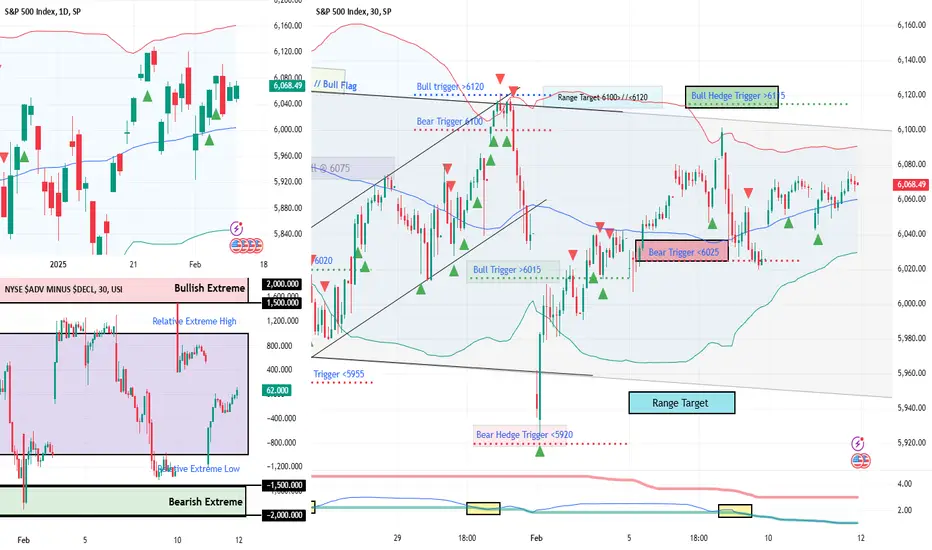
NFP Incoming - Will SPX Smash 6100?NFP Incoming – Will SPX Smash 6100? | SPX Market Analysis 7 Feb 2025
The bulls keep charging as SPX edges closer to 6100. But with the NFP report dropping pre-market, things could get lively.
Will we blast through resistance or bounce back down? Expect some whipsaw chaos before the market settles – but with a bullish trend already in play, we should at least get one more push toward target exits before the dust settles.
---
SPX Deeper Dive Analysis:
📈 Bullish Move On Track
SPX has ridden the momentum train all the way from the range lows to the range highs. Now, we’re staring at 6100, the key level where decisions will be made.
🚀 NFP Report – A Market Mover
Today’s Non-Farm Payroll (NFP) data drops just before the opening bell. This is one of the bigger monthly catalysts, meaning we could see:
A breakout past 6100 if the market likes the numbers.
A sharp rejection back into the range if traders get spooked.
A whipsaw shakeout, with wild swings before settling.
🔄 Short-Term Expectation? A Push Higher
Even if volatility kicks in, the existing bullish momentum should at least give us a final nudge up toward target exits. Whether we smash through 6100 or stall out, we’re in prime position to lock in profits.
⏳ The Good Kind of Waiting
Once again, we’re in a holding pattern, waiting for the market to tip its hand. But this is strategic patience – the kind where we’ve done the hard work and now simply let the market do its thing. The setups are in place – now, we sit back and watch the magic unfold.
---
Fun Fact:
📢 Did you know? In 2010, a trader accidentally caused a $1 trillion stock market crash in just 36 minutes – all because of a fat-finger trade.
💡 The Lesson? One typo, one misclick, or one overleveraged position can cause chaos. Always double-check your trades, because even the pros have hit the wrong button before.

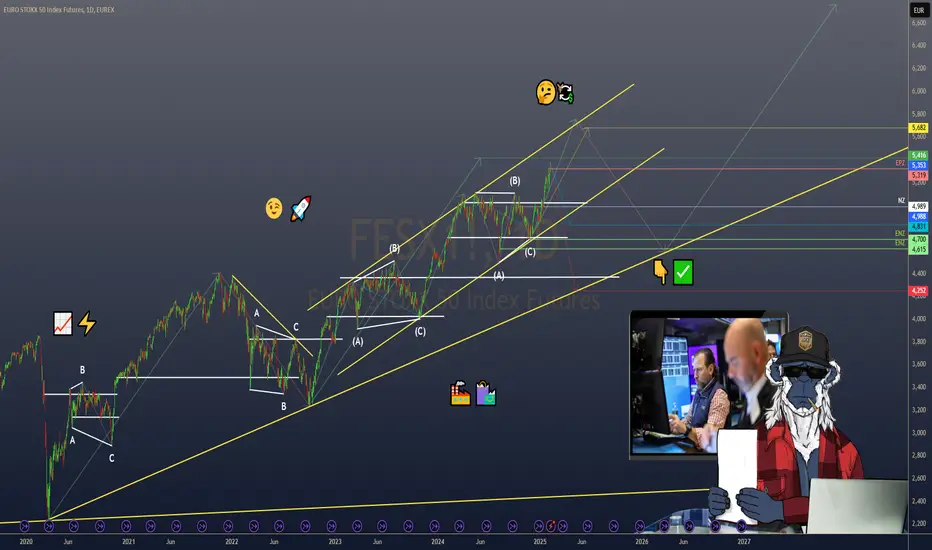
$FESX1! EURO STOXX 50: 7 WEEKS OF GAINSEUREX:FESX1! EURO STOXX 50: 7 WEEKS OF GAINS
1/7
The EURO STOXX 50 is on track for its seventh consecutive weekly gain! 📈⚡️
This winning streak continues despite global trade war jitters and shifting market sentiment.
2/7
Why the optimism? 🤔
Investors appear cautiously confident about U.S. trade policy developments, with Europe seen as a more stable option amidst American economic uncertainties.
3/7
Key influences to watch:
• U.S. Jobs Data: Friday’s payroll numbers may affect overall risk sentiment.
• Trade War: Trump’s tariff talk + a one-month reprieve for Mexico & Canada = a temporary sigh of relief?
4/7
Currency factors also play a role. 💱
The Yen’s strength due to expected BoJ rate hikes could affect export-related optimism if the Euro shifts in tandem.
5/7
Commodities?
Gold remains steady near record peaks, signaling some investors are still seeking safe havens—even as equities rally.
6/7 What’s driving the EURO STOXX 50’s resilience?
1️⃣ Diversified European economy
2️⃣ Stable/dovish monetary policy
3️⃣ Shift to Europe as a “safer” bet
4️⃣ Combination of factors
Vote below! 👇✅
7/7
Market watchers see Europe’s diverse economic base 🏭🛍️ shielding stocks from U.S. volatility. Plus, the possibility of more accommodative European monetary policy adds extra support.
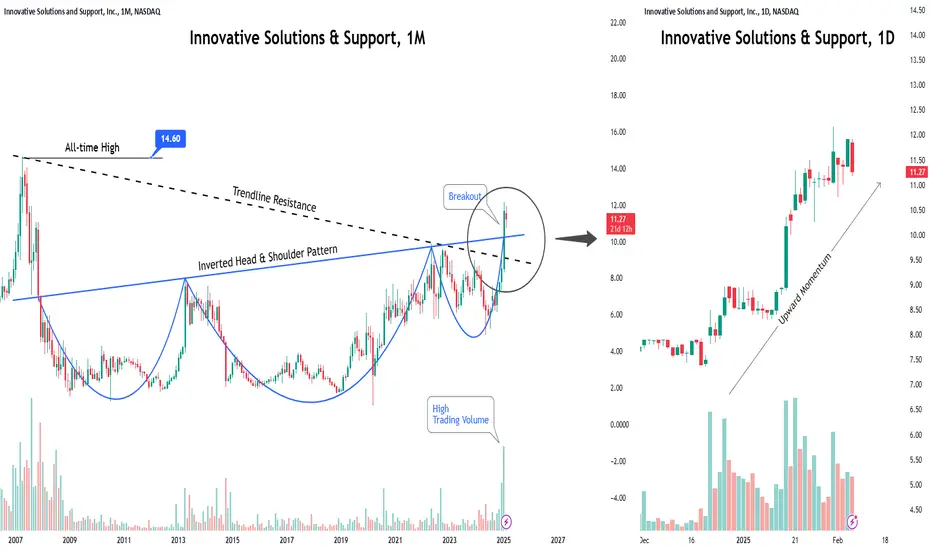
ISSC: A Key Investment Opportunity in Aerospace and Defense◉ Investment Advice
💡 Buy Innovative Solutions and Support NASDAQ:ISSC
● Buy Range - 11.5 - 11.8
● Sell Target - 14.6 - 15
● Potential Return - 25% - 30%
● Approx Holding Period - 08-12 months
◉ Company Overview
Innovative Solutions and Support, Inc., founded in 1988 and based in Exton, Pennsylvania, is a systems integrator specializing in aviation technology. The company designs, manufactures, and services flight guidance systems, autothrottles, cockpit displays, and related products, including air data computing devices, flight management systems, GPS units, and inertial reference systems. It also provides magnetic variation software and operates manufacturer system software. Serving commercial airlines, corporate aviation, the U.S. Department of Defense, government agencies, foreign militaries, and OEMs, the company delivers advanced solutions for aviation and defense sectors globally.
◉ Market Capitalization - $207 M
◉ Other Key Players in the Same Industry
1. GE Aerospace NYSE:GE - $219.6 B
GE Aerospace is a leading global provider of commercial and military aircraft engines, systems, and services. The company is a subsidiary of General Electric (GE) and has a rich history dating back to 1917.
2. Honeywell International NASDAQ:HON - $144.8 B
Honeywell is a multinational conglomerate that produces a wide range of products, including aerospace systems, industrial control systems, and consumer products. The company's aerospace division is a leading provider of avionics, engines, and other aircraft systems.
◉ Key Drivers of Future Revenue and Profit Growth
1. Growth in Military Programs: New contracts, like the U.S. Army's adoption of the ThrustSense Autothrottle and multifunction displays for foreign military platforms, signal strong future revenue potential in defense markets.
2. ISSC Next Strategy: Focused on commercial growth, this strategy includes new OEM and retrofit programs, product acquisitions, and launches like UMS2, aiming to accelerate revenue growth and improve operating margins.
3. Manufacturing Expansion: Increased in-house production and capacity enhancements are expected to boost operating margins and EBITDA by reducing reliance on external suppliers and improving scale efficiencies.
4. Strategic Acquisitions: Acquisitions, particularly from Honeywell, provide revenue synergies and cross-selling opportunities, diversifying offerings and expanding customer bases to drive profitability.
5. Investment in Advanced Technologies: Innovations like AI-integrated cockpit automation position the company to meet future demand in both commercial and military sectors, supporting long-term earnings growth.
◉ Key Risks to Consider
1. Margin Pressure from Military Sales: The company's reliance on military contracts, which typically have lower gross margins than commercial contracts, may negatively impact overall profitability.
2. Integration Challenges from Acquisitions: The integration of recent acquisitions, such as those from Honeywell, is uncertain and may prove difficult, potentially affecting revenue growth and operating margins.
3. Debt-Related Financial Risks: The significant debt incurred from the Honeywell acquisitions poses a financial risk, which could lead to cash flow constraints or higher interest expenses, impacting net income.
4. Operating Expense Pressures: The planned increase in manufacturing capacity and R&D investment may add pressure on operating expenses. If not managed effectively, this may not translate to proportionate revenue growth, impacting net margins.
5. Revenue Realization Risks: The long sales cycle and complexities associated with military contracts may delay revenue realization. If anticipated backlogs do not convert as scheduled, this could affect short- to mid-term revenue expectations.
◉ Technical Analysis
➖ Following a record high of $14.6, the stock plummeted by nearly 90% and entered a prolonged period of consolidation.
➖ However, a bullish reversal pattern, known as an Inverted Head & Shoulder, has formed during this phase.
➖ With a decisive breakout, the stock has also cleared its long-term trendline resistance, indicating a potential trend reversal.
➖ We expect this upward momentum to persist, driving the stock price higher.
◉ Revenue and Profit Analysis
● Year-on-year
➖ FY24 sales soared 36% to $47.2 million, up from $27.7 million in FY23.
➖ EBITDA jumped to $12.6 million, a significant increase from $8.5 million in FY22.
➖ EBITDA margin expanded to 26.7%, up from 24.32% in the same period.
● Quarter-on-quarter
➖ Q4 sales reached a record high of $15.4 million, surging 30% from $11.8 million in Q3 and 18% from $13 million in Q4 2023.
➖ Q4 EBITDA climbed to $5.9 million, up from $2.6 million in Q3.
➖ Q4 diluted EPS rose to $0.40 (LTM) from $0.37 (LTM) in Q3 2024.
◉ Valuation
● P/E Ratio
➖ ISSC's P/E ratio stands at 29.8x, which is relatively in line with the industry average of 33.7x, indicating fair valuation.
● P/B Ratio
➖ With a P/B ratio of 3.3x, ISSC appears undervalued compared to the industry average of 4.5x.
● PEG Ratio
➖ ISSC's PEG ratio of 1.83 suggests the stock is fairly valued, considering its anticipated earnings growth.
◉ Cash Flow Analysis
➖ ISSC achieves remarkable growth in operational cash flow, rising 176% to $5.8 million in FY24 from $2.1 million in FY23.
◉ Debt Analysis
➖ ISSC's debt-to-equity ratio stands at 0.60, signalling that debt is not a significant concern for the company.
◉ Top Shareholders
➖ The Vanguard Group holds a significant 3% stake in the company, indicating institutional confidence in its growth prospects.
◉ Conclusion
The U.S. aerospace and defense market is projected to grow significantly, reaching an estimated $694.86 billion by 2030, with a compound annual growth rate (CAGR) of 5.76%. This growth is fueled by rapid technological advancements, including innovations in artificial intelligence (AI), advanced materials, 3D printing, and autonomous systems, which are reshaping the industry landscape.
Innovative Solutions and Support, Inc. (ISSC) is strategically positioned to capitalize on this expanding market, leveraging its expertise in advanced aviation systems, strong military and commercial contracts, and ongoing investments in cutting-edge technologies.
For investors seeking exposure to the aerospace and defense industry, ISSC represents a compelling opportunity, supported by its solid financial performance, favorable valuation metrics, and alignment with long-term market trends.