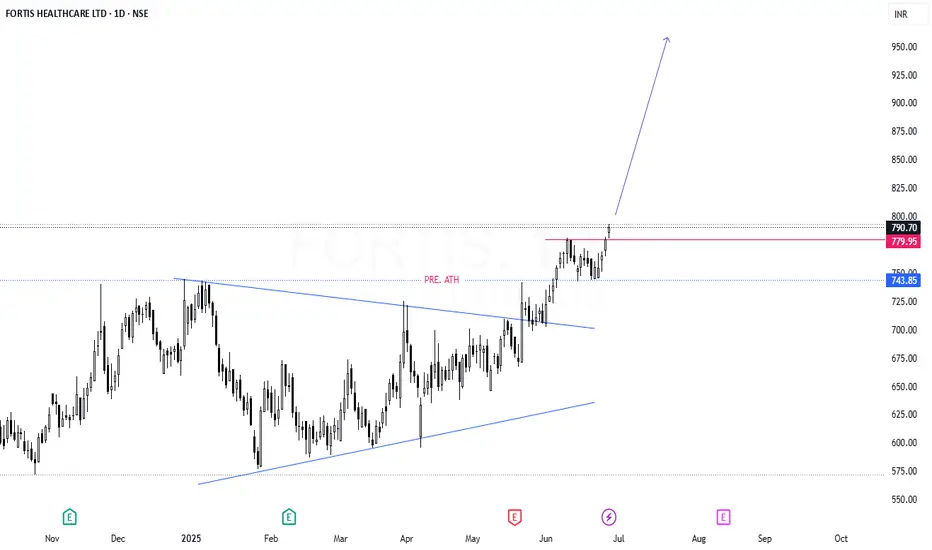
#FORTIS Today this stock brooked ATH level with strong volume. Through It can be predicted here that this will be a good investment option for the short term and long term.
CMP - 790
Key level:-
1) triangle pattern breakout
2) high volume
3) stock sustaining previous high
4) retest like formation
Investing
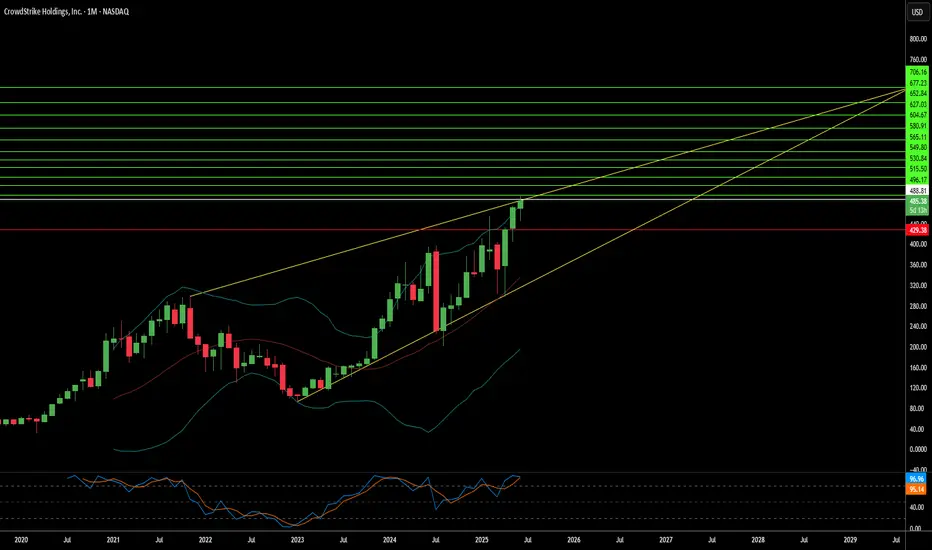
Why Is CrowdStrike's Stock Soaring Amidst Cyber Chaos?The digital landscape is increasingly fraught with sophisticated cyber threats, transforming cybersecurity from a mere IT expense into an indispensable business imperative. With global cybercrime costs projected to reach $10.5 trillion annually by 2025, organizations face severe financial penalties, operational disruptions, and reputational damage from data breaches and ransomware attacks. This escalating threat environment has created an urgent and inelastic demand for robust digital defenses, positioning leading cybersecurity firms like CrowdStrike as critical enablers of economic stability and growth.
CrowdStrike's remarkable ascent is directly tied to this surging demand, fueled by pervasive trends such as widespread digital transformation, extensive cloud adoption, and the proliferation of hybrid work models. These shifts have vastly expanded attack surfaces, necessitating comprehensive, cloud-native security solutions that can protect diverse endpoints and cloud workloads. Organizations are increasingly prioritizing cyber resilience, seeking integrated platforms that offer proactive detection and rapid response capabilities. CrowdStrike's Falcon platform, with its AI-native, single-agent architecture, effectively addresses these needs, providing real-time threat intelligence and enabling seamless expansion across various security modules, which drives high customer retention and significant upsell opportunities.
The company's strong financial performance underscores its market leadership and operational efficiency. CrowdStrike consistently reports impressive Annual Recurring Revenue (ARR) growth, healthy non-GAAP operating margins, and robust free cash flow generation, demonstrating a sustainable and profitable business model. This financial strength, combined with its continuous innovation and strategic partnerships, positions CrowdStrike for sustained long-term growth. As enterprises seek to consolidate security vendors and simplify complex operations, CrowdStrike's comprehensive platform is ideally situated to capture a larger share of global cybersecurity spending, solidifying its role as a cornerstone of the digital economy and a compelling investment in a high-stakes environment.
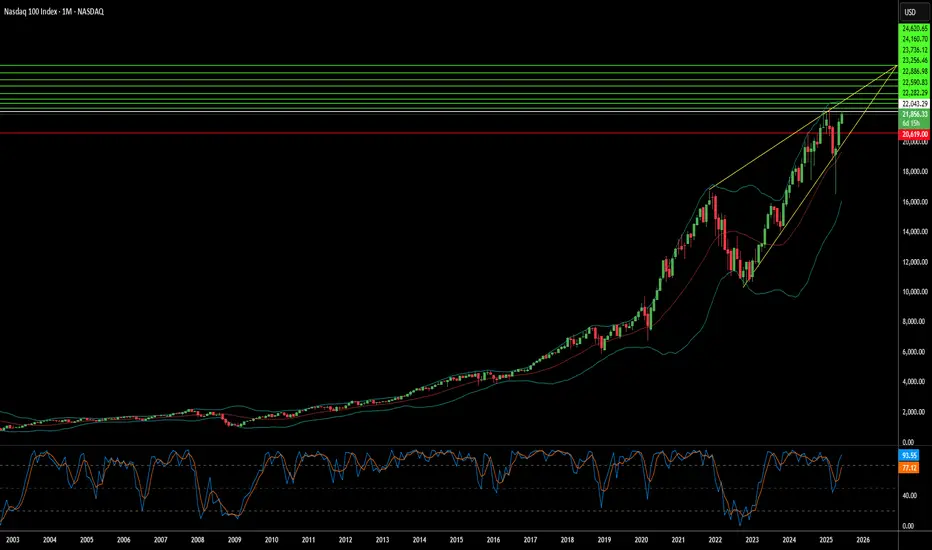
Can Geopolitics Power Tech's Ascent?The Nasdaq index recently experienced a significant surge, driven largely by an unexpected de-escalation of tensions between Israel and Iran. Following a weekend where U.S. forces reportedly attacked Iranian nuclear sites, investors braced for a volatile Monday. However, Iran's measured response - a missile strike on a U.S. base in Qatar, notably without casualties or significant damage - signaled a clear intent to avoid wider conflict. This pivotal moment culminated in President Trump's announcement of a "Complete and Total CEASEFIRE" on Truth Social, which immediately sent U.S. stock futures, including the Nasdaq, soaring. This rapid shift from geopolitical brinkmanship to a declared truce fundamentally altered risk perceptions, alleviating immediate concerns that had weighed on global markets.
This geopolitical calm proved particularly beneficial for the Nasdaq, an index heavily weighted towards technology and growth stocks. These companies, often characterized by global supply chains and reliance on stable international markets, thrive in environments of reduced uncertainty. Unlike sectors tied to commodity prices, tech firms derive their value from innovation, data, and software assets, which are less susceptible to direct geopolitical disruptions when tensions ease. The perceived de-escalation of conflict not only boosted investor confidence in these growth-oriented companies but also potentially reduced pressure on the Federal Reserve regarding future monetary policy, a factor that profoundly impacts the borrowing costs and valuations of high-growth technology firms.
Beyond the immediate geopolitical relief, other crucial factors are shaping the market's trajectory. Federal Reserve Chair Jerome Powell's upcoming testimony before the House Financial Services Committee, where he will discuss monetary policy, remains a key focus. Investors are closely scrutinizing his remarks for any indications regarding future interest rate adjustments, particularly given current expectations for potential rate cuts in 2025. Additionally, significant corporate earnings reports from major companies like Carnival Corporation (CCL), FedEx (FDX), and BlackBerry (BB) are due. These reports will offer vital insights into various sectors' health, providing a more granular understanding of consumer spending, global logistics, and software security, thereby influencing overall market sentiment and the Nasdaq's continued performance.
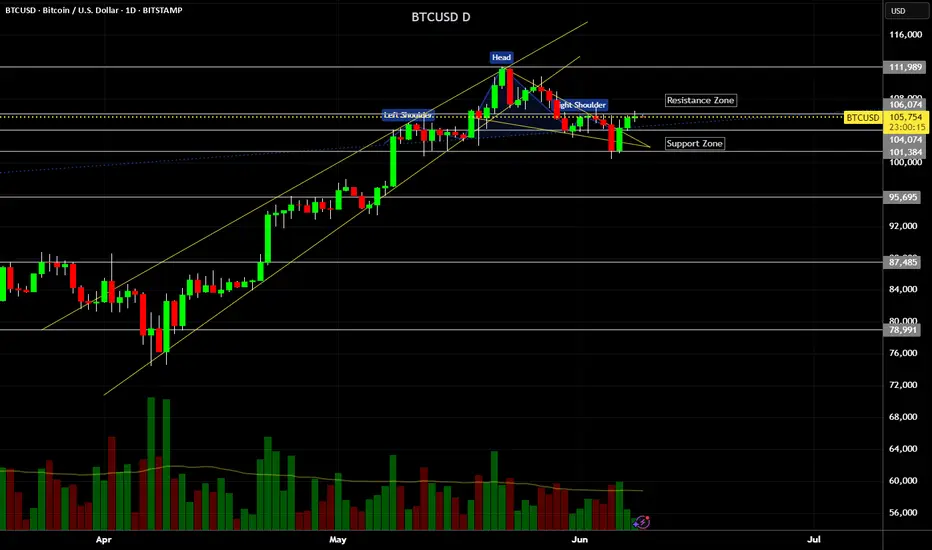
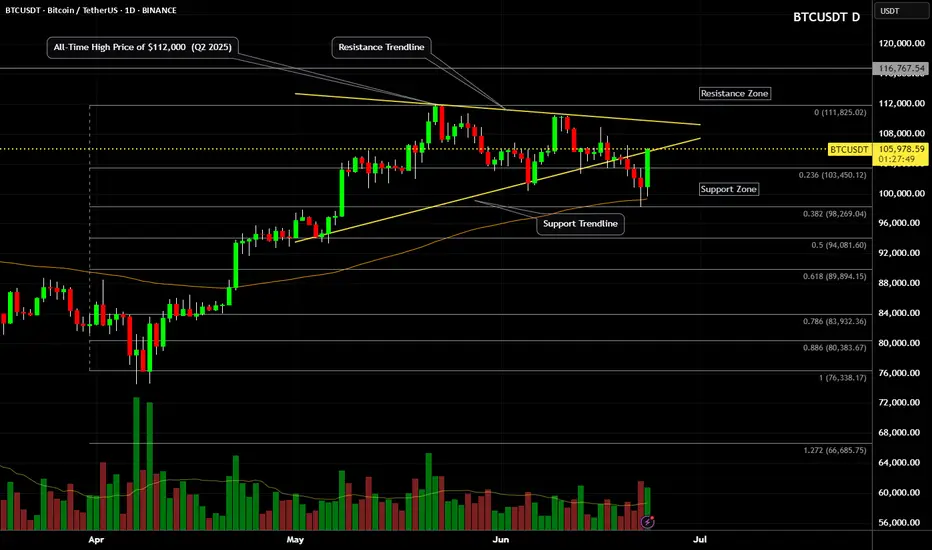
Bitcoin (BTCUSDT) - Price Testing Resistance after Morning StarBitcoin (BTCUSDT) price is currently testing the resistance zone of $105,000 to $110,000 (yellow lines).
A morning star candle pattern has formed above the 100 ema (orange line), which is also $100,000 price support.
Some bullish momentum is forming on the MACD Histogram, however, Bitcoin is still technically in a short-term downtrend for the past 30 days.
Bitcoin price needs to create a new uptrend on the daily chart, a series of higher-highs and higher-lows in the price, which could take several months.
At this time, Bitcoin is still reacting to global news and stock market correlations.
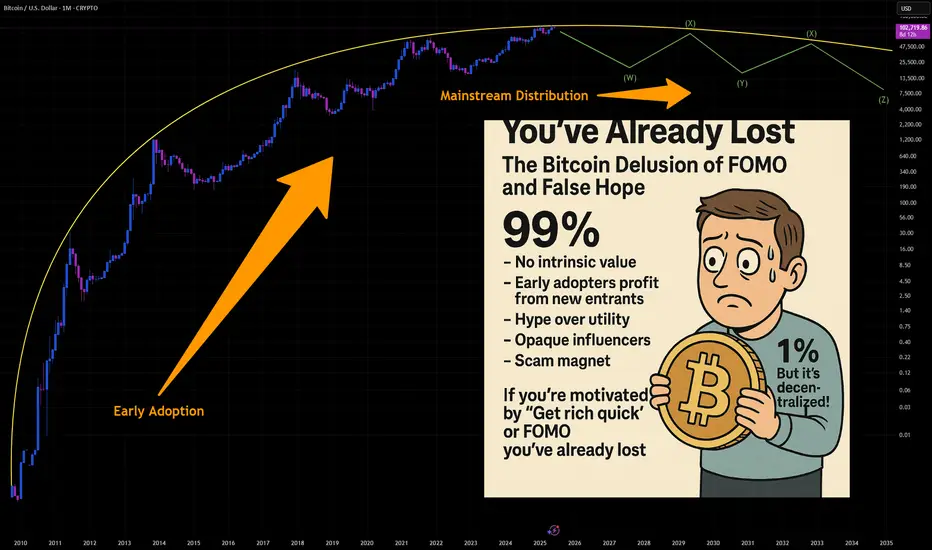
You've Already Lost: The Bitcoin Delusion of FOMO and False HopeLet’s get one thing straight: if you’re staring at Bitcoin, squinting past the red flags, and convincing yourself it’s not a Ponzi scheme because of that one shiny feature that screams “legit,” you’re not investing—you’re auditioning for the role of “next victim.” And if your motivation is the fear of missing out (FOMO) or the fantasy of getting rich quick, well... congratulations. You’ve already lost.
The 99%: Red Flags Waving Like It’s a Parade
Let’s talk about the indicators—the ones that make Bitcoin look suspiciously like a Ponzi scheme. No, it’s not technically one, but the resemblance is uncanny:
- No intrinsic value: Bitcoin isn’t backed by assets, cash flow, or a government. It’s worth what the next person is willing to pay. That’s not investing. That’s speculative hot potato.
- Early adopters profit from new entrants: The people who got in early? They’re cashing out while newcomers buy in at inflated prices. That’s the classic Ponzi dynamic: old money out, new money in.
- Hype over utility: Bitcoin’s actual use as a currency is minimal. It’s slow, expensive to transact, and volatile. But hey, who needs functionality when you’ve got memes and moon emojis?
- Opaque influencers: From anonymous creators (hello, Satoshi) to crypto bros promising Lambos, the ecosystem thrives on charisma, not accountability.
- Scam magnet: Bitcoin has been the currency of choice for over 1,700 Ponzi schemes and scams, according to a University of New Mexico study cs.unm.edu . That’s not a coincidence. That’s a pattern.
The 1%: The “But It’s Decentralized!” Defense
Ah yes, the one redeeming quality that Bitcoin evangelists cling to like a life raft: decentralization. No central authority! No government control! It’s the financial revolution!
Except… decentralization doesn’t magically make something a good investment. It just means no one’s in charge when things go wrong. And when the market crashes (again), you can’t call customer service. You can tweet into the void, though.
FOMO: The Real Engine Behind the Madness
Let’s be honest. Most people aren’t buying Bitcoin because they believe in the tech. They’re buying because they saw someone on TikTok turn $500 into a Tesla. FOMO is the fuel, and social media is the match.
Bitcoin’s meteoric rises are often driven by hype cycles, not fundamentals. Tesla buys in? Price spikes. El Salvador adopts it? Price spikes. Your cousin’s dog walker says it’s going to $1 million? Price spikes. Then it crashes. Rinse, repeat.
This isn’t investing. It’s gambling with a tech-savvy twist.
The Punchline: You’ve Already Lost
If you’re ignoring the overwhelming signs of speculative mania and clinging to the one feature that makes you feel better about your decision, you’re not ahead of the curve—you’re the mark. And if your motivation is “I don’t want to miss out,” you already have. You’ve missed out on rational thinking, due diligence, and the ability to distinguish between innovation and illusion.
Bitcoin might not be a Ponzi scheme in the legal sense. But if it walks like one, talks like one, and makes early adopters rich at the expense of latecomers… maybe it’s time to stop pretending it’s something else.
INDEX:BTCUSD NYSE:CRCL NASDAQ:HOOD TVC:DXY NASDAQ:MSTR TVC:SILVER TVC:GOLD NASDAQ:TSLA NASDAQ:COIN NASDAQ:MARA
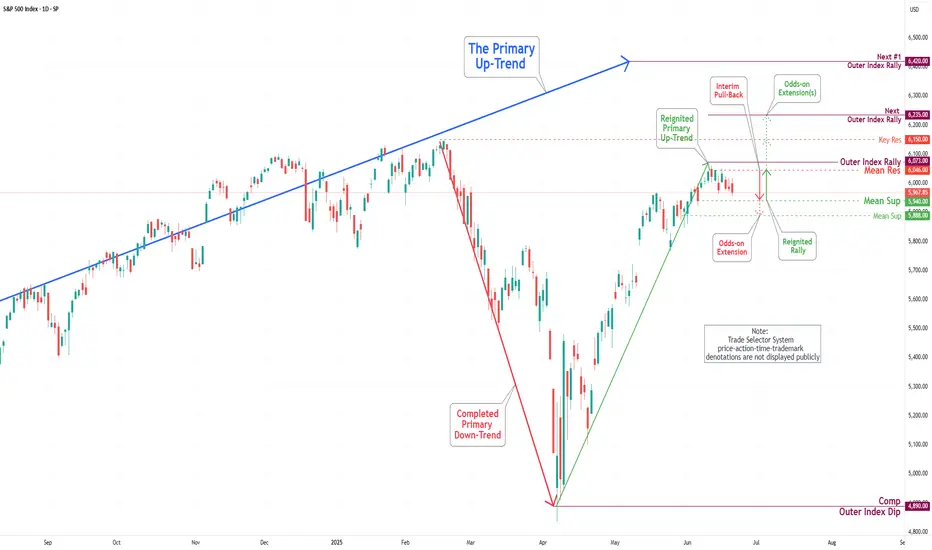
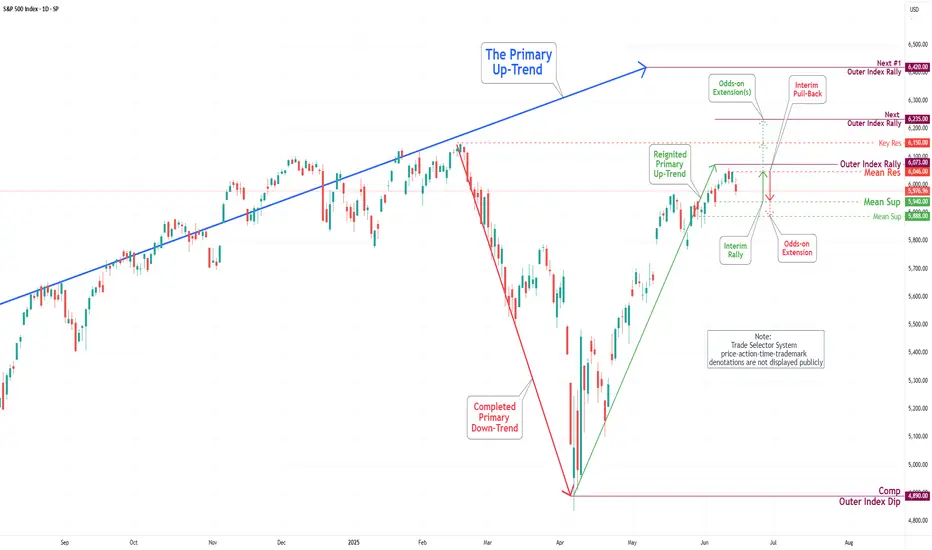
S&P 500 Daily Chart Analysis For Week of June 20, 2025Technical Analysis and Outlook:
The S&P 500 Index has primarily exhibited downward trends during this week’s abbreviated trading session, narrowly failing to reach the targeted Mean Support level of 5940, as outlined in the previous Daily Chart Analysis. Currently, the index exhibits a bearish trend, suggesting a potential direction toward the Mean Support level of 5940, with an additional critical support level identified at 5888.
Contrariwise, there exists a substantial likelihood that following the accomplishment of hitting the Mean Support of 5940, the index may experience recovery and ascend toward the Mean Resistance level of 6046. This upward movement could facilitate a resilient rally, ultimately topping in the completion of the Outer Index Rally at 6073, thereby enabling the index to address the Key Resistance level situated at 6150.
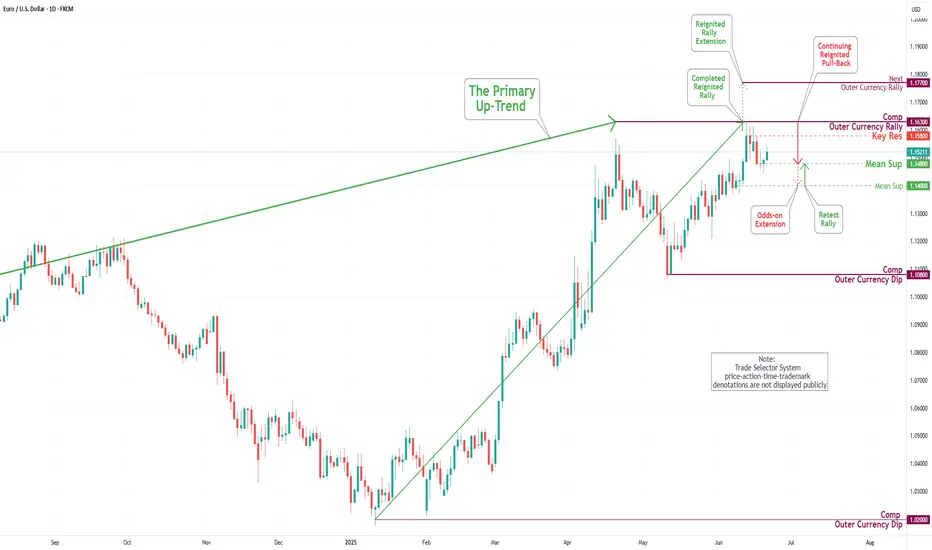
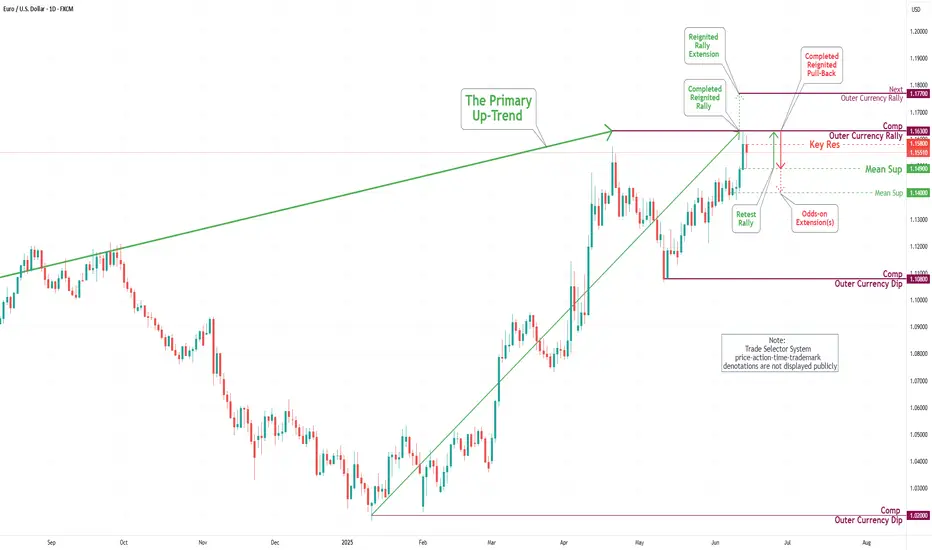
EUR/USD Daily Chart Analysis For Week of June 20, 2025Technical Analysis and Outlook:
During this week's trading session, the Eurodollar has encountered a significant decline, dipping below the Mean Support level of 1.149; however, it exhibited a modest recovery on Friday. Recent analyses indicate that the Euro is likely to decrease further to the Mean Support level of 1.148, with the potential for extending its bearish trend to reach 1.140. Nevertheless, there remains a possibility that the current recovery will persist, which could result in price movements targeting the Key Resistance level at 1.158 and potentially leading to a retest of the Outer Currency Rally's 1.163 mark.
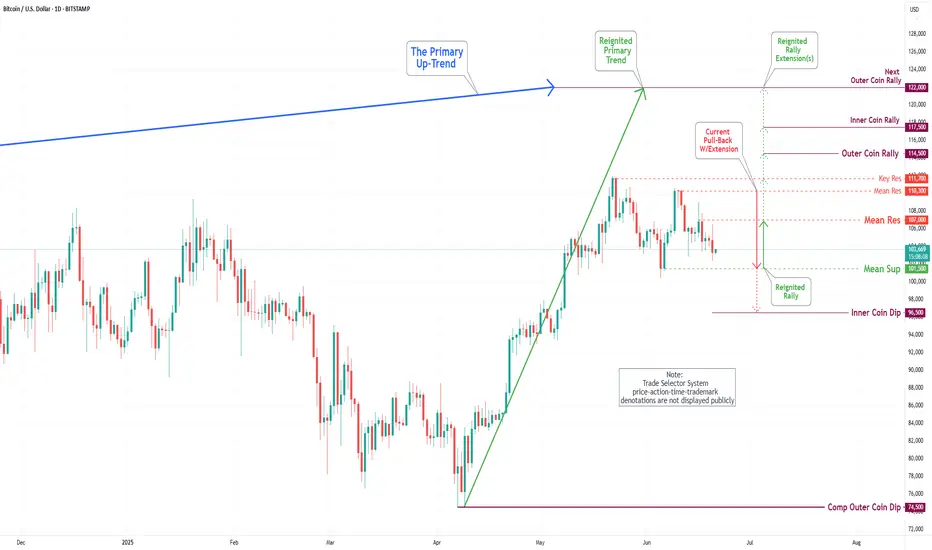
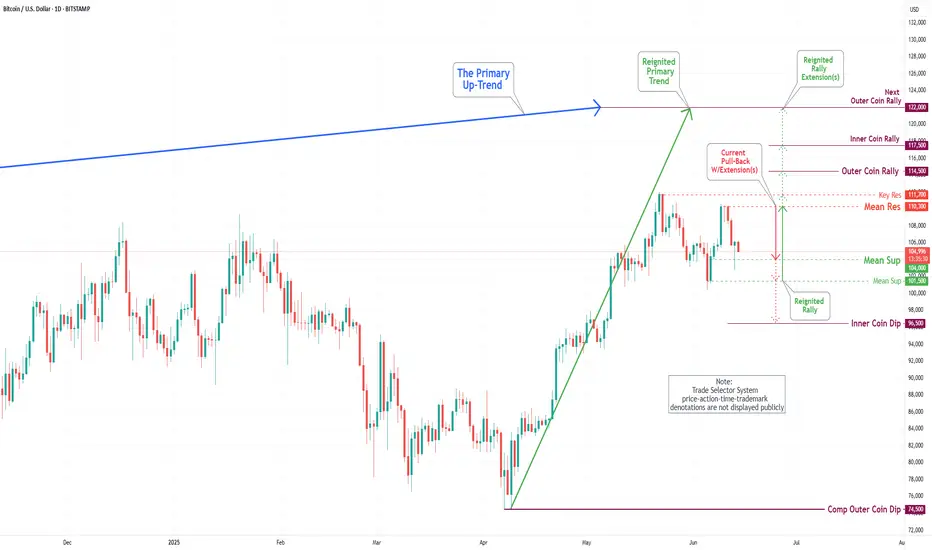
Bitcoin(BTC/USD) Daily Chart Analysis For Week of June 20, 2025Technical Analysis and Outlook:
In the recent trading session, Bitcoin exhibited an upward trend; however, it subsequently experienced a significant decline from the established Mean Resistance level at 110300. On Friday, Bitcoin exhibited notable price action, characterized by a pump-and-dump scenario. At this juncture, Bitcoin is retracing downwards as it seeks to approach the Mean Support level at 101500 and the ultimate Inner Coin Dip at 96500. It is essential to acknowledge the potential for an upward rally from the Mean Support levels of $101500 and/or the Inner Coin Dip at $96500. Such a rally could culminate in a retest of the Mean Resistance level at $107000.
$IREN could be next...100%+ UpsideNext Retail Darling... NASDAQ:IREN TA looks the part! 👀
Breakout 🎯$22 then $31
CupnHandle almost breaking out here with measured moves a lot higher!
Volume shelf acting as a launch pad.
WR% is uptrnding as well!
This one's looking good based on the TA.

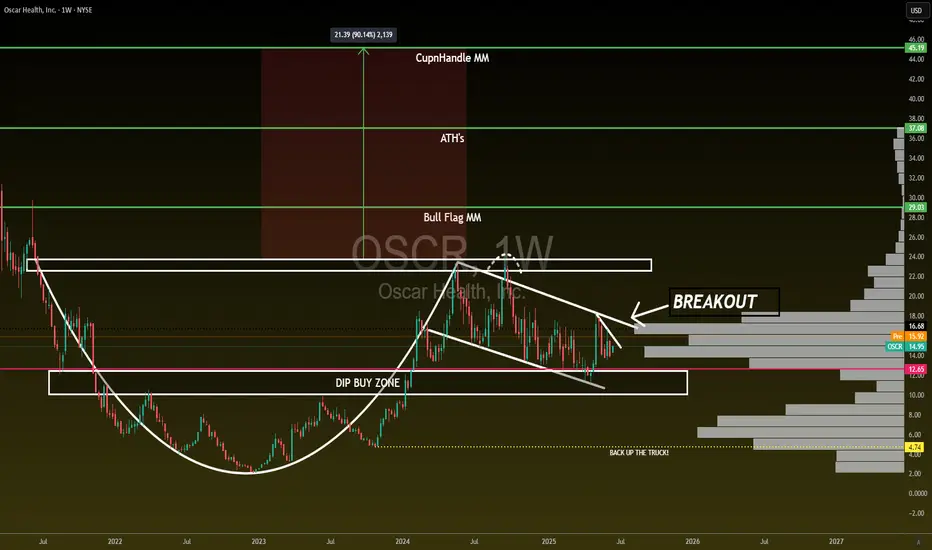
$OSCR - Finally Breaking Out! 125% UpsideThis move is nothing when talking about what's to come for a company this undervalued!
NYSE:OSCR is going to go PARABOLIC!!!
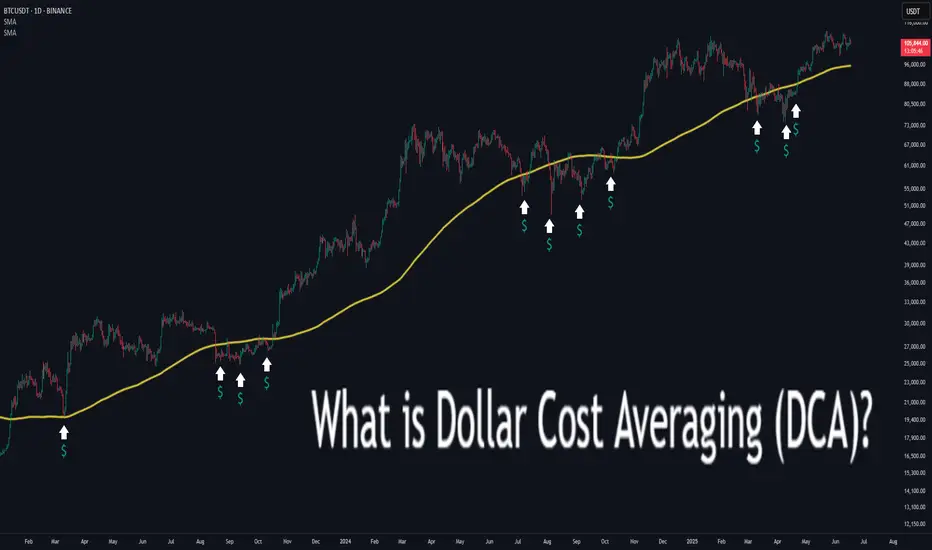
What is Dollar Cost Averaging (DCA)?🔵 What is Dollar Cost Averaging (DCA)?
Dollar Cost Averaging (DCA) is a timeless investment strategy that involves investing a fixed amount of money at regular intervals, regardless of the asset's price. It’s one of the most effective ways to build a position over time while minimizing the impact of market volatility.
The term "Dollar Cost Averaging" was popularized in the early 20th century by Benjamin Graham — the father of value investing and mentor to Warren Buffett. Graham advocated DCA as a way to remove emotions and guesswork from investing. By spreading out purchases, investors could avoid mistiming the market and reduce risk exposure.
Today, DCA remains a core strategy for retail investors, especially in volatile markets like cryptocurrencies and growth stocks.
🔵 How Does DCA Work?
The concept is simple: instead of investing a lump sum all at once, you break your total investment into smaller, equal parts and invest them over time — for example, weekly or monthly.
Invest $100 every week into Bitcoin.
Keep buying consistently — regardless of whether price goes up or down.
Over time, this smooths out your average entry price.
You buy more when price is low, and less when price is high.
Example:
If BTC is at $30,000 one month, you buy a small amount.
If BTC drops to $25,000 the next month, you buy more units with the same $100.
Over time, your entry price averages out — reducing the risk of buying at a peak.
🔵 Why Use DCA?
DCA offers both psychological and mathematical advantages:
Reduces timing risk: You don’t need to predict market tops or bottoms.
Builds discipline: Encourages consistent investing habits.
Prevents emotional mistakes: Avoids FOMO buying and panic selling.
Smooths volatility: Especially useful in crypto or fast-moving assets.
🔵 Smart DCA: Buying Into Market Bottoms
While classic DCA is powerful on its own, it becomes even more effective when combined with market structure. A popular approach is to only DCA when the asset is trading below its long-term average — such as the 200-day Simple Moving Average (SMA) or using RSI (Relative Strength Index).
What is the 200-day SMA?
It’s the average closing price over the last 200 days — a key indicator of long-term trend direction.
Why DCA Below the 200 SMA?
Historically, many market bottoms occur below the 200 SMA. Using this as a filter helps you avoid accumulating during overvalued or overheated conditions.
SDCA with RSI
The Relative Strength Index (RSI) helps identify momentum exhaustion. When RSI drops below 30, it often marks deeply oversold conditions — especially on the daily chart for BTC.
How to use it:
Only DCA when price is below the 200-day SMA.
You accumulate during crashes, fear, and corrections.
Avoid buying when price is extended far above long-term value.
🔵 Scaling DCA Based on Undervaluation
To further optimize the strategy, you can scale your DCA amounts depending on how far below the 200 SMA the price is.
Example:
Price is 5% below 200 SMA → invest normal amount.
Price is 15% below → double your investment.
Price is 25% below → triple your investment.
This creates a dynamic DCA system that responds to market conditions — helping you build larger positions when prices are truly discounted.
🔵 When DCA Doesn’t Work
Like any strategy, DCA has limitations. It’s not magic — just a system to reduce timing errors.
In strong uptrends, a lump sum investment can outperform DCA.
In declining assets with no recovery (bad fundamentals), DCA becomes risky.
DCA works best on quality assets with long-term growth potential.
Always combine DCA with research and risk management — don’t blindly accumulate assets just because they’re down.
🔵 Final Thoughts
Dollar Cost Averaging isn’t about buying the exact bottom — it’s about consistency , discipline , and risk control . Whether you’re investing in Bitcoin, stocks, or ETFs, DCA offers a stress-free approach to enter the market and smooth out volatility over time.
Smart traders take it one step further: using moving averages and structure to focus their DCA efforts where value is highest.
DCA won’t make you rich overnight — but it will help you sleep at night.
This article is for educational purposes only and is not financial advice. Always do your own research and invest responsibly.
S&P 500 Daily Chart Analysis For Week of June 13, 2025Technical Analysis and Outlook:
The S&P 500 Index has displayed both upward and downward movements throughout this week's trading session, narrowly missing the targeted Outer Index Rally level of 6073. Currently, the index is characterized by a bearish trend, warranting attention towards the Mean Support level of 5940, with additional critical support identified at 5888.
Conversely, there exists a significant potential that, upon reaching the Mean Support of 5940, the index may recover and rise to the Mean Resistance level of 6046. This upward movement could facilitate an interim rally, culminating in the completion of the Outer Index Rally at 6073 and enabling the index to address the Key Resistance level positioned at 6150.
EUR/USD Daily Chart Analysis For Week of June 13, 2025Technical Analysis and Outlook:
During the current trading session, the Eurodollar has exhibited notable volatility, mirroring patterns observed in the preceding week. The currency has surpassed both the Mean Resistance level of 1.145 and the Key Resistance level of 1.151, subsequently retesting the significant completed Outer Currency Rally level at 1.157.
Recent analyses indicate that the Euro is likely to revisit both the Key Resistance and the completed Outer Currency Rally and expand further to the next Outer Currency Rally of 1.177 in the forthcoming trading session(s). However, there exists a potential for a continuation of the downward trend from the current level, which could lead to the price action targeting the Mean Support level at 1.149 and possibly a further extension to the Mean Support level at 1.140.
Bitcoin(BTC/USD) Daily Chart Analysis For Week of June 13, 2025Technical Analysis and Outlook:
Throughout the past week, Bitcoin has exhibited considerable volatility. After reaching a peak at the first Mean Resistance level of 109500, the cryptocurrency experienced a significant decline. Nevertheless, on Friday, Bitcoin demonstrated a notable recovery, ascending to a newly established resistance now designated as the new Mean Resistance level marked at 110300.
At this juncture, Bitcoin is retracing downward as it retests the initial Mean Support level of 104000 while aiming to target the Mean Support at 101500 and the ultimate Inner Coin Dip at 96500. It is essential to recognize the potential for an upward rally from the Mean Support levels of $ 104,000 and/or $ 101,500, which could culminate in a retest of the Mean Resistance level of $ 110,300.
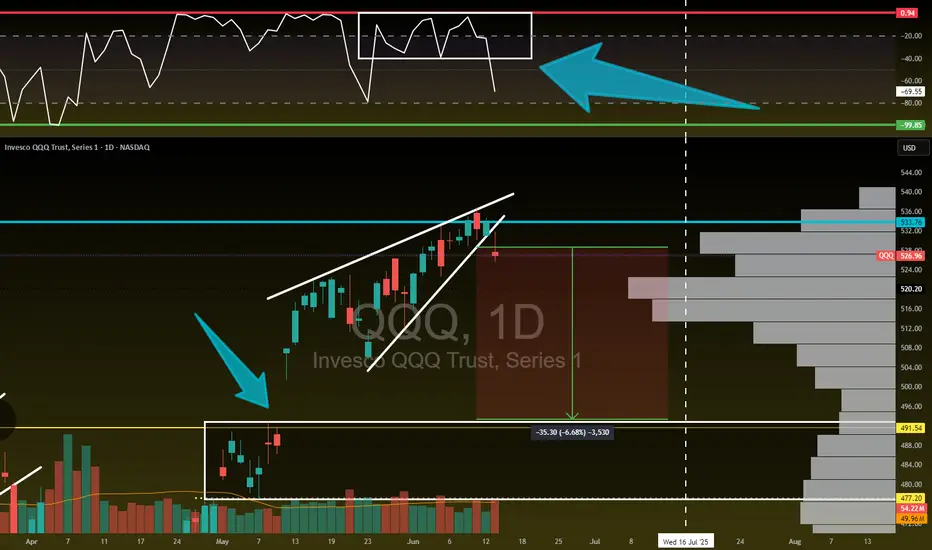
Bears Intensify... $QQQ - Pullback LikelyBears Intensify... NASDAQ:QQQ
🐻 Falling Wedge Breakdown
🐻 Hammer Candle
🐻 Bearish Wr%
🐻 H5 Flow Increasing
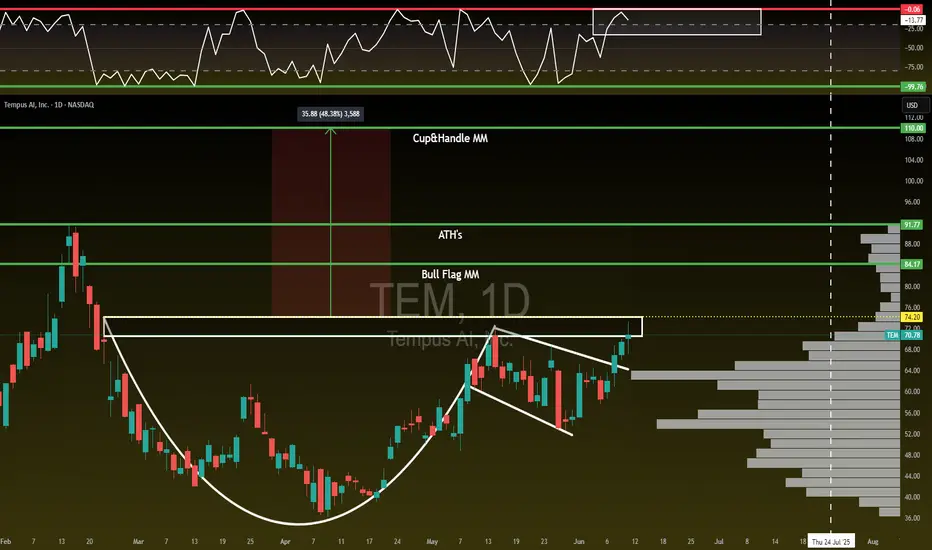
$TEM - New ATH's Inbound! 50% UpsideNASDAQ:TEM - New ATH's Inbound! 🚀
Bull Flag Breakout = $84.17 🎯
74.20 Cup&Handle Breakout = $110 🎯
WCB forming 📈
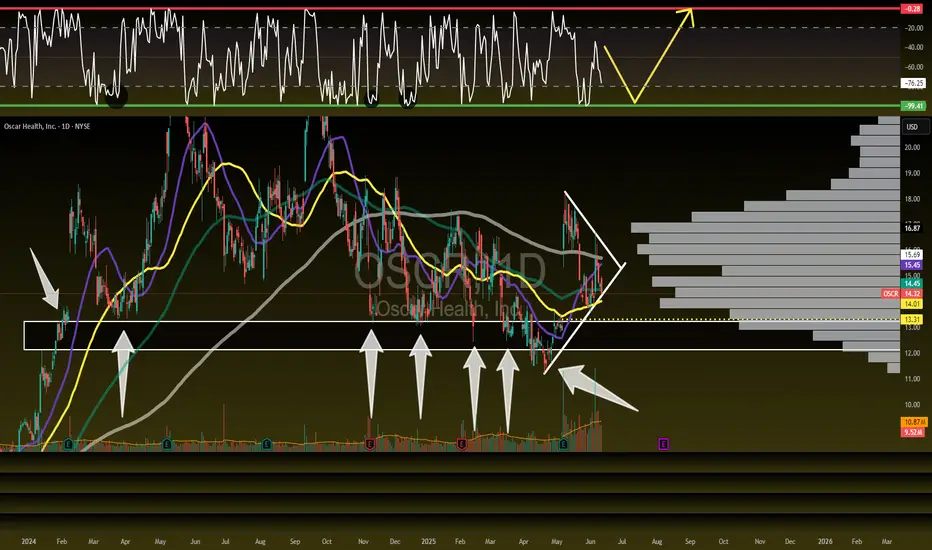
What's going on with $OSCR? Let's break it down!🚨 What's going on with NYSE:OSCR ? Let's break it down! 👇
📌 Long-term investors: Every dip = buy/add opportunity
📌 Traders: Short term, we may fill the $13.31 GAP
🔹 Massive volume shelf & consolidation between $11-$17 for nearly 2 years—the bigger the base, the bigger the breakout!
🔹 Rising trendline since April lows—if this breaks, expect a move to $13.31 GAP, possibly $11-$12. Strong support here unless bad news or a market correction hits.
🔹 Break above $18.27 (earnings pop) = 🚀 $20+ short term
🔹 200DMA rejection after retest from below = bearish short term
🔹 WR% is making a lower low instead of swinging higher—watching this closely.
🧐 Overall: We’re in a consolidation phase—when it moves, expect it to be quick & explosive 🔥 Best strategy: DCA & wait for the inevitable surge to $20+ (barring major setbacks).
Stay patient. Stay focused. NYSE:OSCR ’s move is coming! 💪
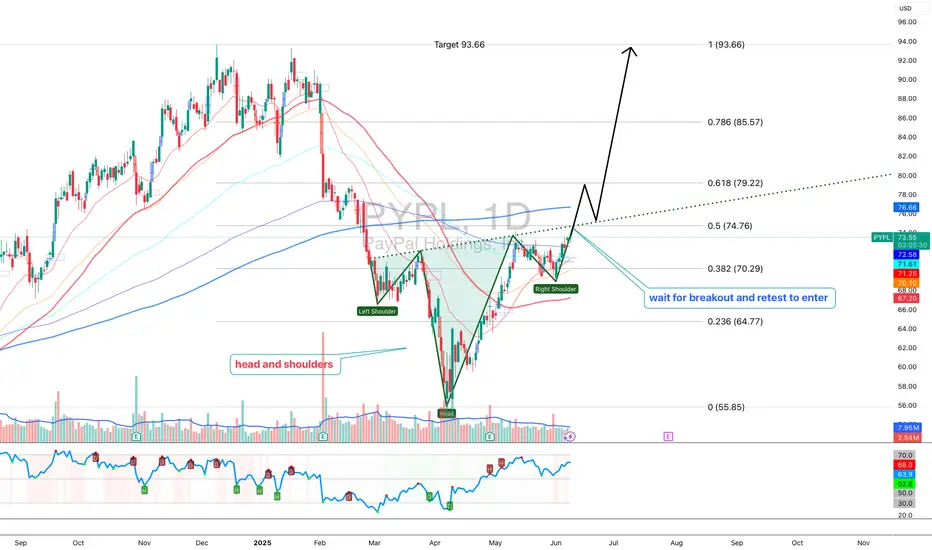
PayPal: Rebound or Rerun?PayPal in 2025: A breakout with backbone or just another spineless fintech?
PayPal is still in the rehabilitation ward after its fall from grace in 2021. Management drama, growth slowdown — the full fintech fatigue package. But something has shifted behind the scenes. A new CEO is cutting costs, AI integration is being whispered about, and earnings have started to surprise again. Wall Street pretends not to notice — but volume tells a different story.
Technically, we’re looking at a well-formed inverse head and shoulders. The neckline stretches from $72.00 to $74.76, aligning with the 0.5 Fibonacci level. A confirmed breakout above this zone opens the path to a clear target at $93.66 — the 1.0 Fibonacci extension. Multiple EMA clusters and strong pattern symmetry reinforce the setup. But no fairy tales here: the real entry comes after a retest. Without confirmation, it’s just another pretty formation for chart enthusiasts.
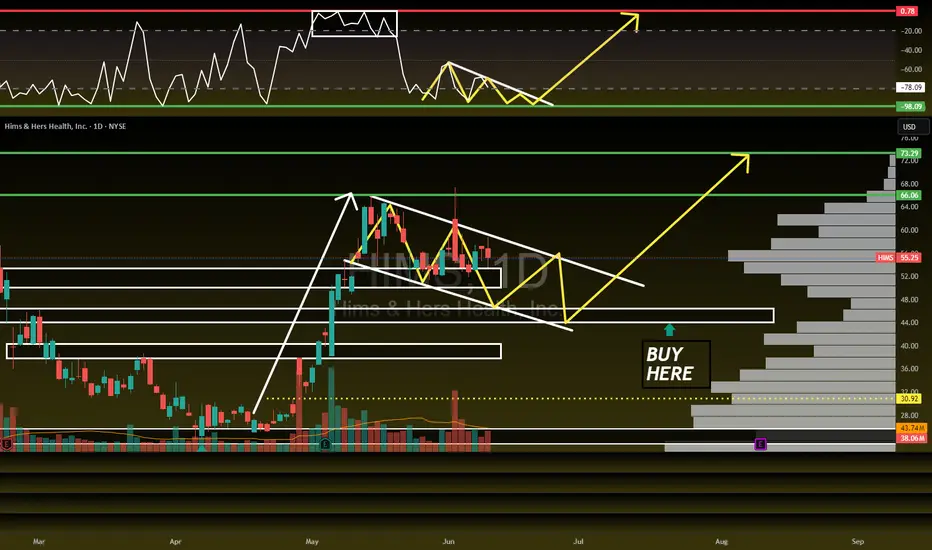
$HIMS setting up for its next big move—here’s what I’m watching!🔥 NYSE:HIMS setting up for its next big move—here’s what I’m watching! 🔥
📉 Eyeing momentum down to $44-$48, and I’m not mad about it!
🔄 That flip from resistance to support is key for long-term price growth.
🚀 Bull flag breakout could come sooner—stay locked in! Keeping an eye on it all for the next trade entry on this beast!
💬 What’s your take? Are we bouncing or breaking out? Drop your thoughts below! ⬇️
$VKTX Trade Alert - 42% Upside🚨 NASDAQ:VKTX Trade Alert 🚨
☕️ CupnHandle Breakout:
🎯 $41.76
⏳ October 1st 2025
💸 Jan. 16th $30 Calls
Not Financial Advice

SPX 500 to 17,000 in 7 years.This chart represents the S&P 500, showcasing its performance over time, including quarterly data.
It captures everything.
Every recession.
Every war.
Every president.
Every variation of the monetary base as superpowers rise and fall.
Whenever I hear a bear in the stock market declare that THE TOP has been reached, and we are about to CRASH -50% to -90%
I find myself drawn to these comprehensive long term charts.
If the bulls are genuinely in control and we have merely undergone an intermediate-term correction, then the long-term bull market that commenced at the 2009 low remains robust, with many more years ahead.
The chart also illustrates that the three significant bull market phases typically last around 18-20 years following a major breakout.
And they yield a comparable number of X's.
It's all quite fascinating, if you ask me.
See you in the future!

Stocks & ETF : Breaking out and Ready for Massive Bull runBelow is the list of stocks and ETFs that are in the early stage of breakout with ultra volume level. Good time to buy.
NSE:SCHNEIDER
NSE:ASAHIINDIA
NSE:HINDZINC
NSE:ABREL
NSE:TATAINVEST
NSE:UJJIVANSFB
NSE:PNBHOUSING
NSE:BANDHANBNK
NSE:DLF
NSE:ICICIGI
NSE:IDFCFIRSTB
NSE:SHRIRAMFIN
NSE:AUTOBEES
NSE:INDUSINDBK
NSE:ABB
NSE:TATACHEM
NSE:GODREJPROP
NSE:SIGNATURE
NSE:JPPOWER
NSE:HFCL
Bitcoin (BTCUSD) - Daily Price Consolidation Under ResistanceBitcoin (BTCUSD) price has been in a short-term downtrend since June 2025.
Price is currently consolidating under $106,000 resistance.
Watching to see if an evening star candle pattern prints on the daily chart, for a very-short-term pullback.
Support targets: $105,000, $104,000, $101,000, $100,000.
Resistance targets: $107,000, $109,000, $110,000, $112,000.
Bitcoin has been correlating with the USA stock market, tech stocks, consumer sentiment, and breaking news.