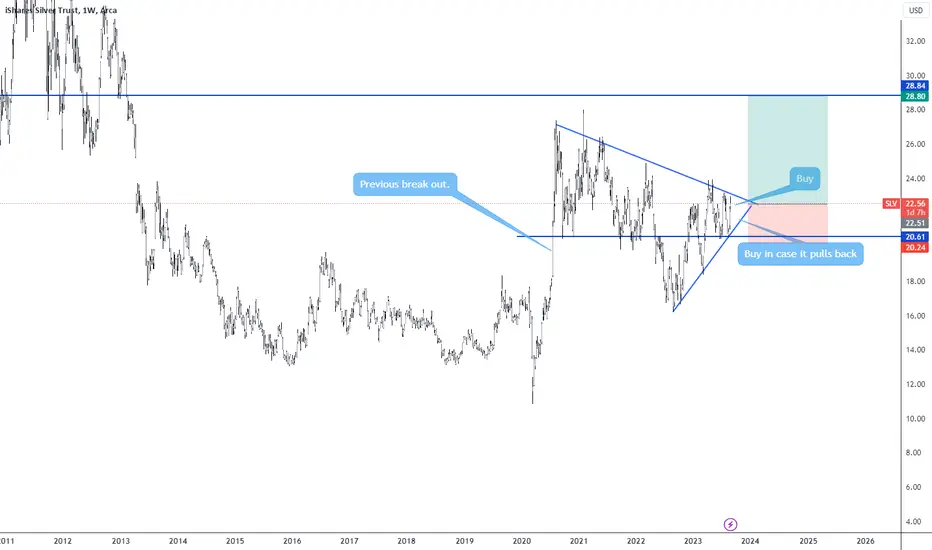
Silver is greatThis a long term strategy for the next couple of years. Silver is consolidating within this triangle since August 2020. Buying SLV ETF is like having silver bricks stored in a safe place. See it that way. You just don't sell silver, you accumulate it at every pull back. I may take less than a couple of years though bc the break out could be violent. I'm showing a SL just for reference but I would buy more if price drops that low (I don't think that will happen anytime soon). Check my previous post on silver down below.
Investing
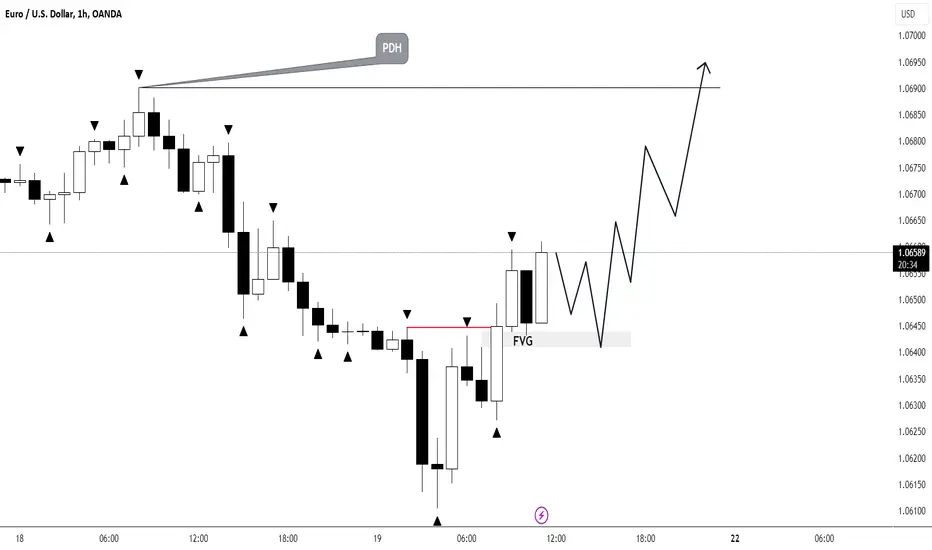
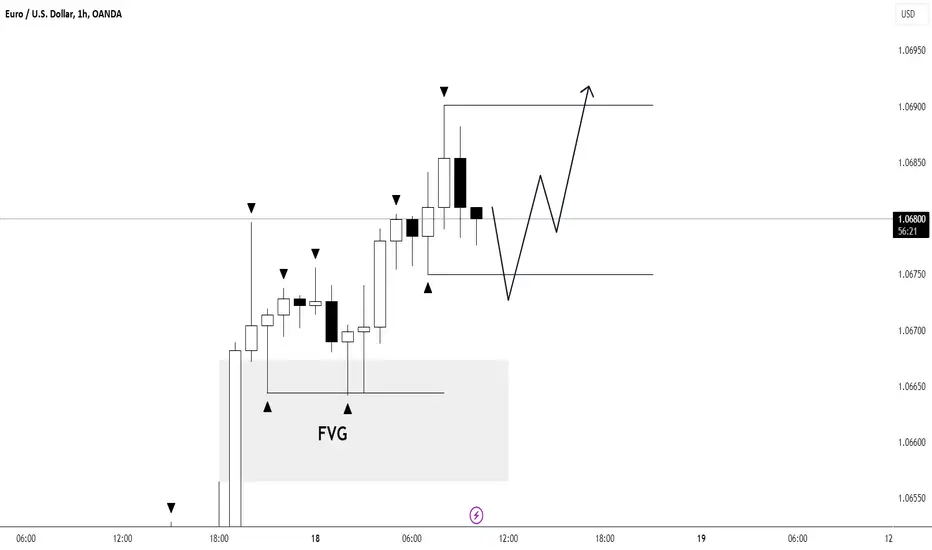
EURUSD Hello everyone, starting from the London session, the context has shifted to long. The primary intraday target is yesterday's high, PDH. The scenario will be invalidated if the price solidifies below 1.06250.
$TCSG has power to rocket start to the moon
MOEX:TCSG turned 180 degrees. and looking to the moon.
My expectation, that shot will be a very sharp within just some months.
In addition. in my view. this will show the first step only in the sequence of the next step-up.
Potential is more than 7000 for the long-term (year or more).
MOEX:TCSG ::2723->3600->4300::59%::Jul-Aug 2023
Does not constitute a recommendation.
#investing #stocks #idea #forecast #furoreggs
Please, subscribe and challenge my point of view )

KASPA Before you LONG, read this.This is one of the coins that I talk to my members for a long setup, but.. People are simply used to this coin that the price goes up non-stop, with certain corrections.
But the same pattern emerged before this impulse(Nov-DEC. 2023).
Wait for the zone to confirm it, because if we look at the chart we will see the first testing of the distribution on March 7 and then again. Then on March 15th there is a price break of 0.14 and a retest twice and a rejection? Wait for it to leak, do not engage in manipulations.. When the structure shows the first signs, a HIGH top, then a small correction that holds the price, we can entry.
The chart shows the zones I am looking at.
All this is valid only if 0.13 drops.

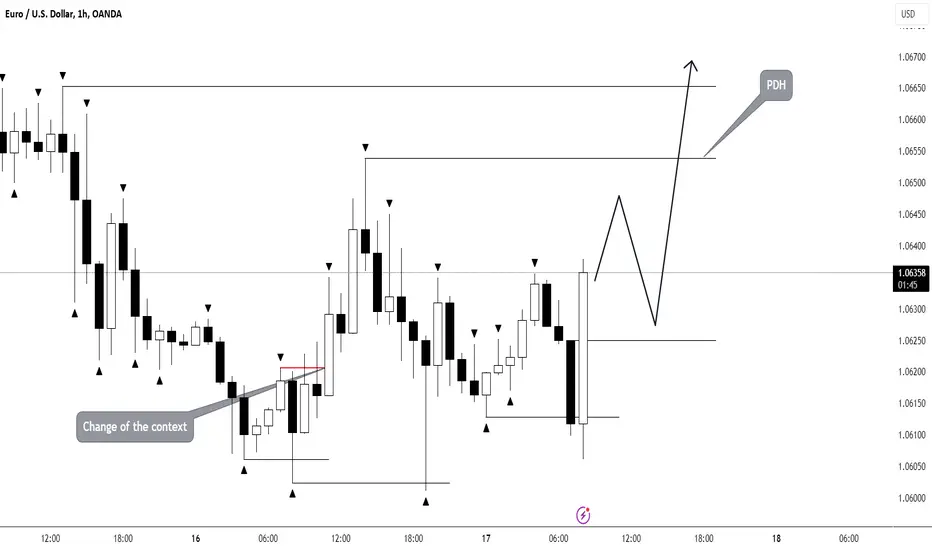
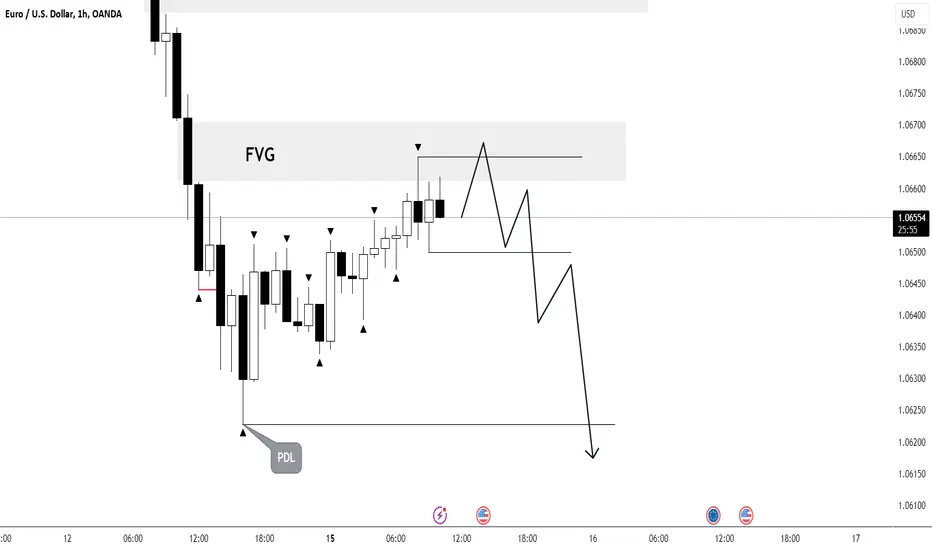
EURUSDWe continue to remain in a long context, with the primary short-term target being the Frankfurt maximum. The scenario would be invalidated with a price consolidation below 1.0665.
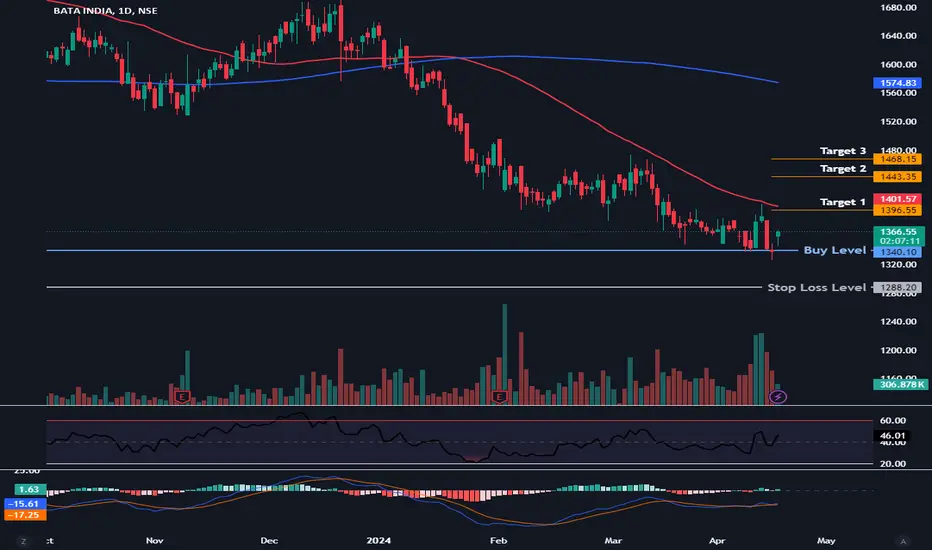
20% Upside Potential idea 🔥 - Bata🔥 20% Upside Potential idea - NSE:BATAINDIA
This Trade Ideas is a type of Equity Investment which is designed to give you 10% to 20% return in short-term via #Equity #Investment.
✅ Stock Name -
Bata India
Trade Process :-
✅ - Buy only at Buy Level as recommended in the chart. Use GTT feature available with all online brokers
✅ - On successful purchase, immediately create a SL GTT (Stop Loss level asper chart).
✅ - Once Stock Price is at Target 1 level, move your SL to Cost Price or 3% down from Target 1.
✅ - Keep Trailing the SL as Stock Price moves to next Targets.
Thanks
EURUSD DayPlan#EURUSD
Good day, we continue to be in a long context despite the corrective movement formed in the latter half of yesterday. I would also like to note the beginning of the order flow in the long direction, which gives us additional reason to adhere to the long context for the day. The intraday target will be the previous day's high (PDH), as well as the liquidity above.
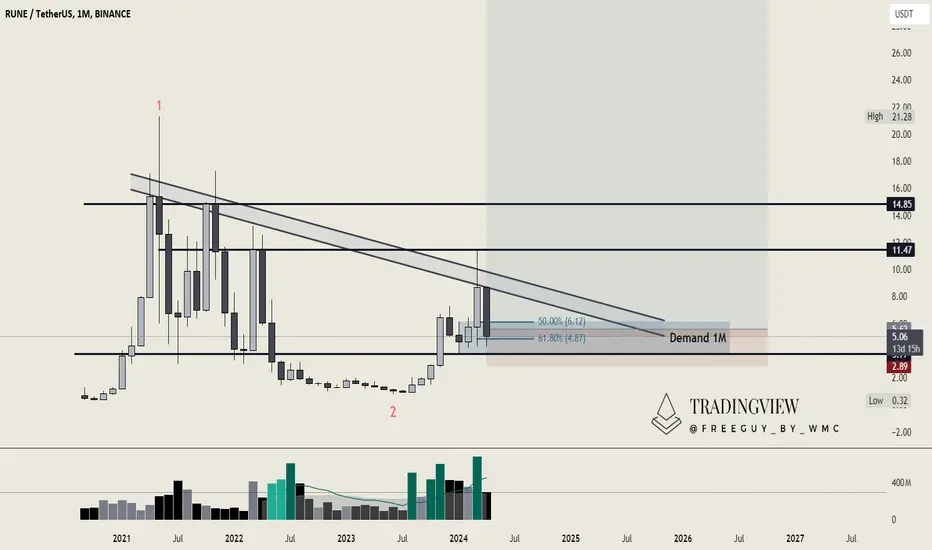
THORChain (RUNE): An outlook on the Higher TimeframeAt BINANCE:RUNEUSDT , we are initially examining the monthly chart because we believe it reveals something very significant and promising. We are potentially in a major Wave 3, which could realistically target at least $34.70. This is a considerably high target, yet feasible for Rune given its performance relative to other cryptocurrencies—it hasn't risen as sharply, suggesting there might be substantial upward potential once it breaks out.
We have observed multiple fakeouts around this trendline but have never truly broken above it. This trendline, along with the demand zone highlighted on the monthly chart, will be crucial anchors for our analysis.
We do not expect to fall below this demand zone; it forms the basis of our swing or spot bag setup for Rune. The response to recent price dips has been encouragingly positive, indicating resilience. If we see a clear breakout above this trendline and the price successfully consolidates above it, we anticipate significant bullish momentum to follow.
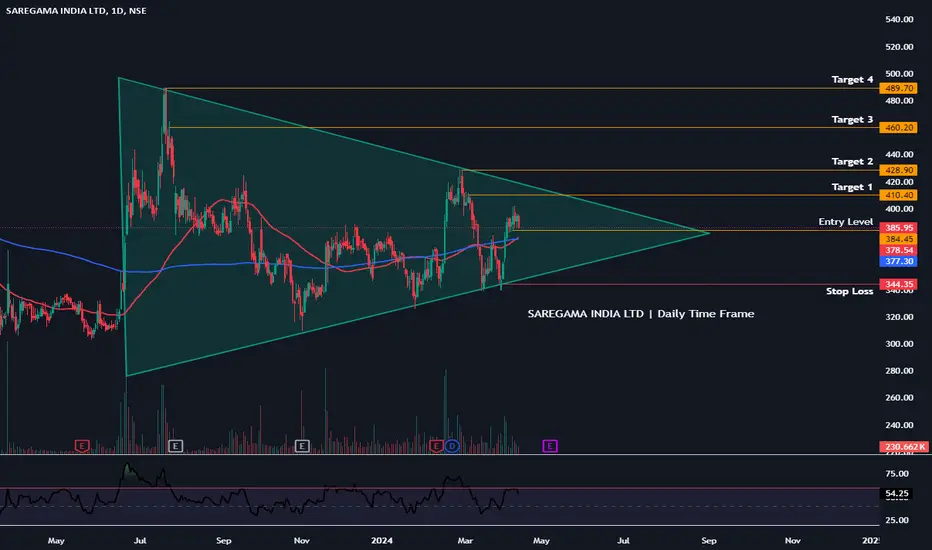
20% Upside Potential idea 🔥 - SAREGAMA🔥 20% Upside Potential idea - NSE:SAREGAMA
This Trade Ideas is a type of Equity Investment which is designed to give you 10% to 20% return in short-term via #Equity #Investment.
✅ Stock Name - NSE:SAREGAMA
Trade Process :-
✅ - Buy only at Buy Level as recommended in the chart. Use GTT feature available with all online brokers
✅ - On successful purchase, immediately create a SL GTT (Stop Loss level asper chart).
✅ - Once Stock Price is at Target 1 level, move your SL to Cost Price or 3% down from Target 1.
✅ - Keep Trailing the SL as Stock Price moves to next Targets.
Thanks
eurusd day planGood morning! We continue to be in a short context on all timeframes. The aggressive Frankfurt opening also hints at the context, with all timeframes synchronized. It's also important not to forget that the current short movement has been going on for several days without any correctional moves. The scenario will be invalidated by a price close above 1.062
EURUSD#EURUSD
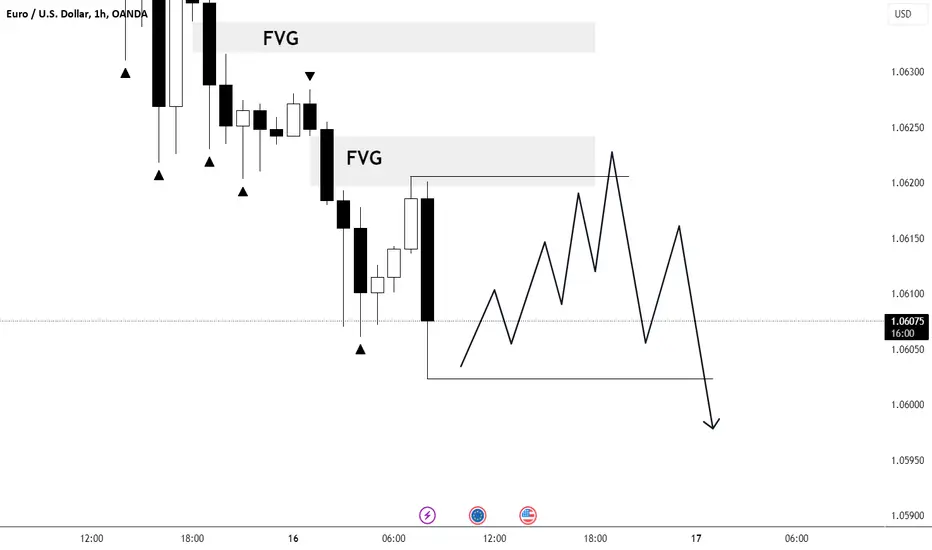
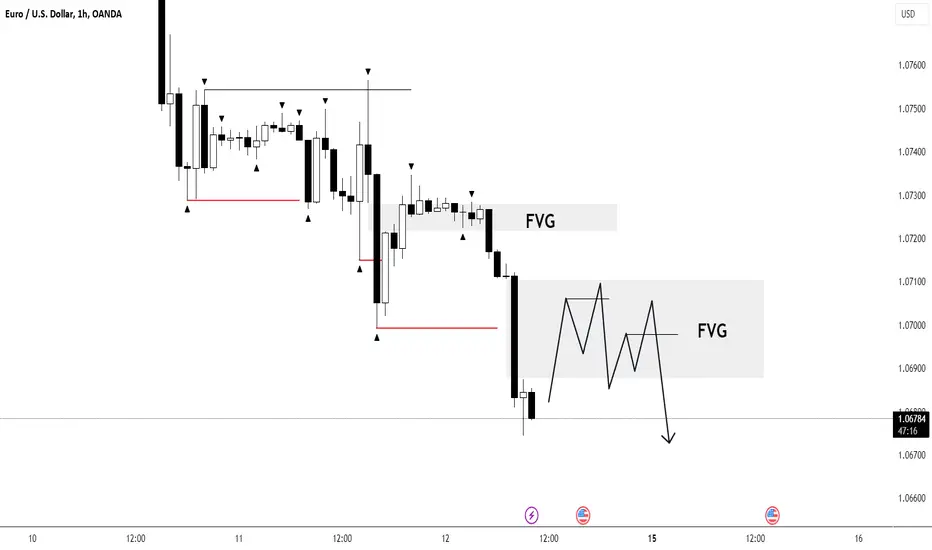
We continue to remain in a short context. For now, I've identified a potential position from the Frankfurt maximum with a re-covering of the FVG. My intraday target is the PDL.
04/14/2024 - Bitcoin & Crypto - Video IdeaBitcoin & Crypto market video idea by @NoFomoCharts
BTC/usd, TOTAL, ETH/usdt, BNB/usdt, SOL/usdt.
04/14/2024, 09:15PM EST Video Idea.
Technical Analysis & Educational Chart Videos.
Follow, Comment, Boost, or Cheer to support. Thank you!
All content is Not financial advice.

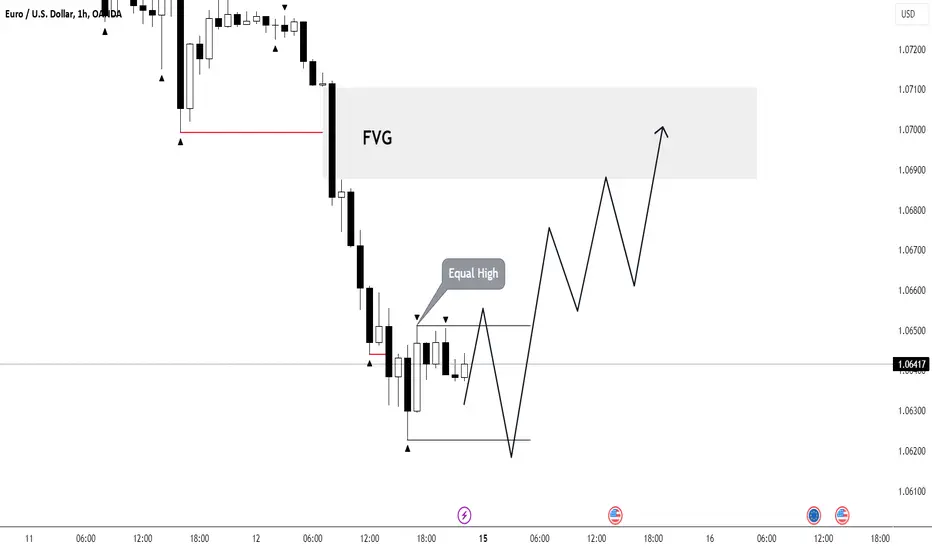
EURUSD1h - On the hourly timeframe, there has been aggressive movement over the past two days without any correction, resulting in significant unabsorbed liquidity above. It would be beneficial to observe sideways movement in the Asian session with liquidity absorption below, followed by a structural shift to a long context.
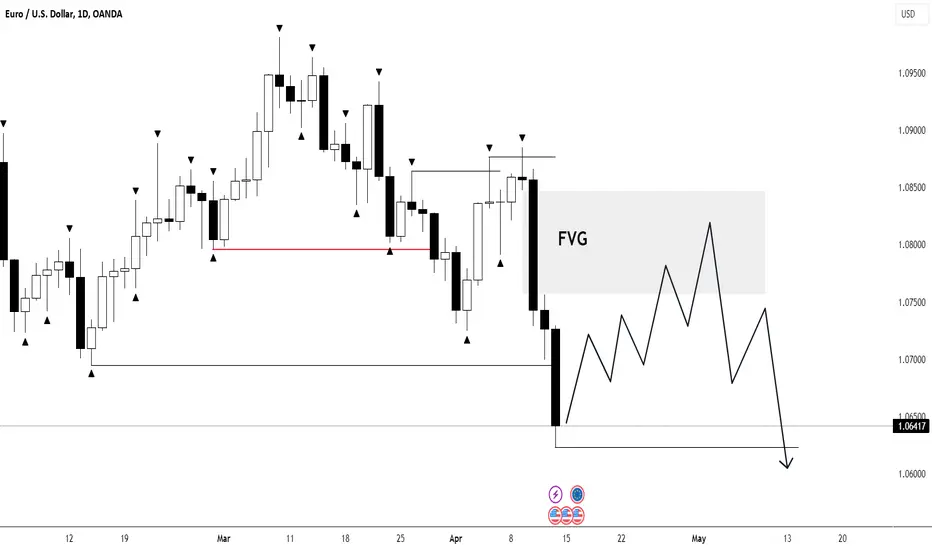
EURUSD 1D1D - On the daily timeframe, we continue to remain in a short context. Based on the aggressive end of the week, I anticipate the beginning of a corrective movement to build liquidity, with targets aiming for partial overlapping of the FVG.
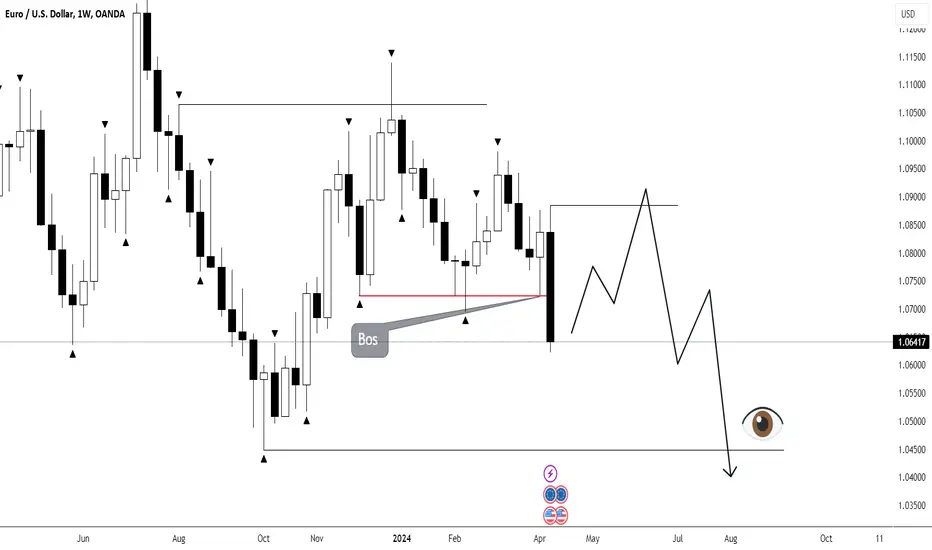
EURUSD 1W1W - On the weekly timeframe, we've switched to a short context. I anticipate that the next week will largely be characterized by sideways movement, after which we'll continue the movement towards the specified targets below.
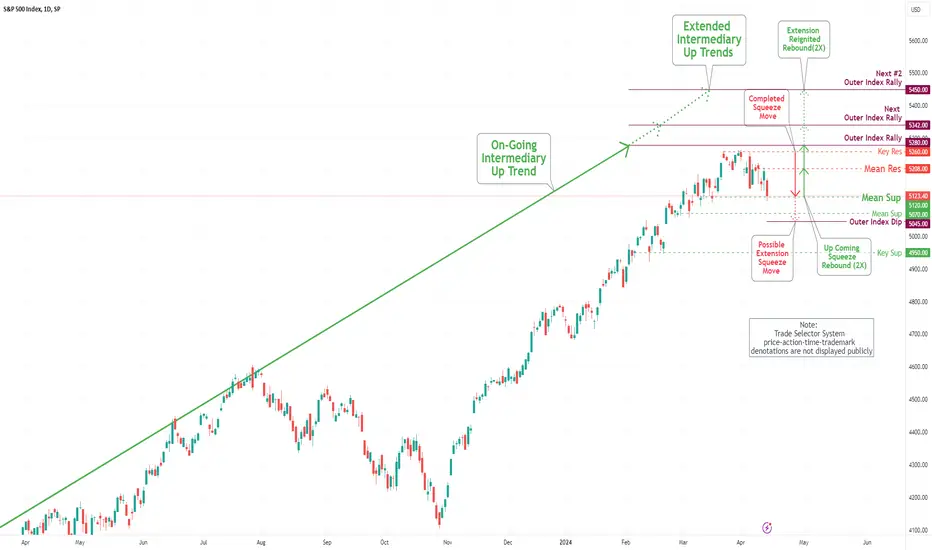
S&P 500 Daily Chart Analysis For Week of April 12, 2024Technical Analysis and Outlook:
The Spooz continue to experience a severe drop in this week's trading session, hitting our two Mae Sup levels: 5150 and 5120, respectively. The current price action indicates that the market will pursue an upside movement to target our Mean Res 5208 and beyond. On the downside, Spooz may continue on a downward spiral to the Mean Support level of 5070 and Outer Index Dip at 5045, which is expected to act as a launching point to reignite its bullish trend.
EUR/USD Daily Chart Analysis For Week of April 12, 2024Technical Analysis and Outlook:
The Eurodollar has completed an Inner Currency Dip of 1.065. This momentum is expected to generate further selling pressure, resulting in a decline to the next Inner Currency Dip of 1.054. Ultimately, the Eurodollar is expected to reach an Inner Currency Dip of 1.045. It is worth emphasizing, however, that an interim rebound to the Mean Resistance level of 1.075 may be feasible before the Eurodollar resumes its downward trajectory.

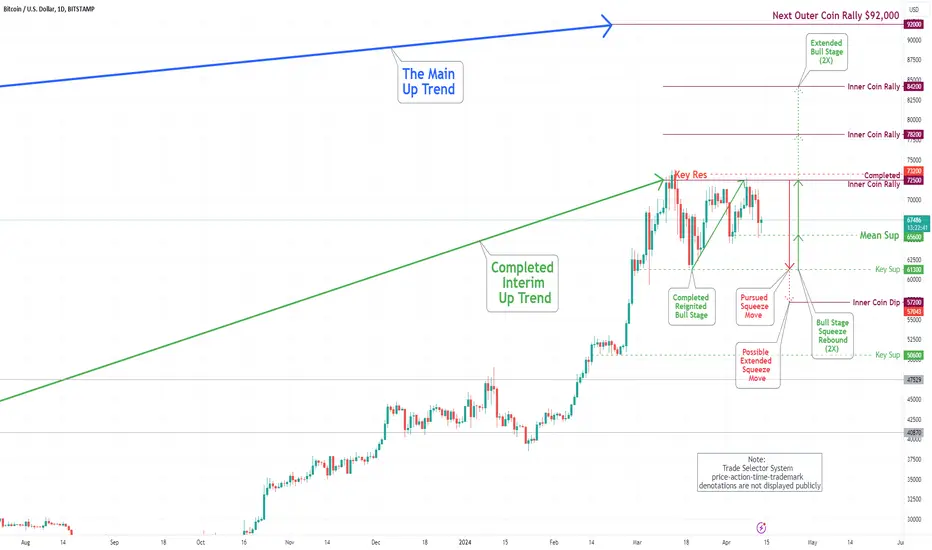
Bitcoin(BTC/USD) Daily Chart Analysis For Week of April 12, 2024Technical Analysis and Outlook:
This week's trading session Bitcoin completed the forthcoming Inner Coin Rally 72500, and as expected, the coin retraced to our designated Mean Sup 65600. Bitcoin is in the process of rebounding back to the 72500 scene of crime. On the downside, the market potential decline may occur, resulting in Bitcoin falling to Key Sup 61300 and an Inner Coin Dip 57200. The bull stage movement will arise from current price action or Key Sup 61300 and an Inner Coin Dip 57200, respectively.
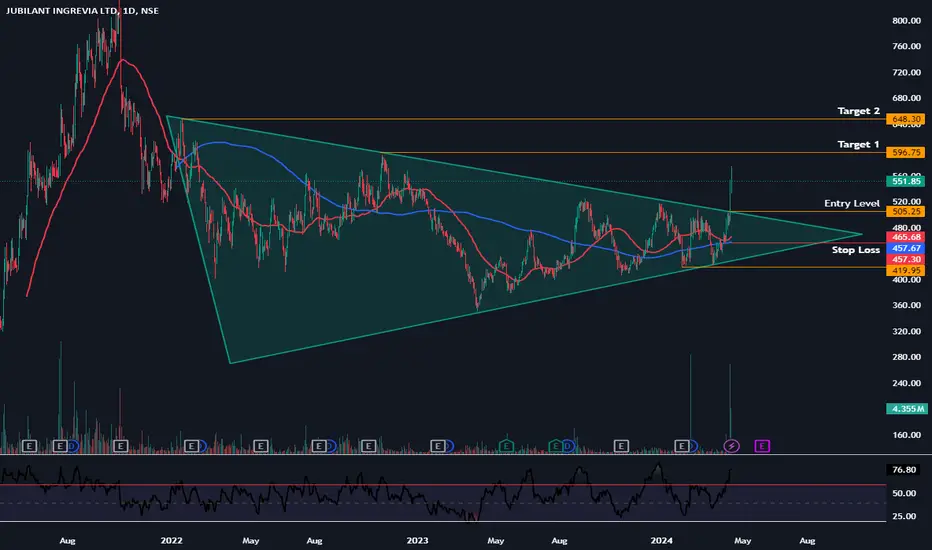
5% Trade Ideas #5PercentTrade -JUBLINGREA #5PercentTrade #Equity
5% Trade Ideas is a type of Equity Investment which is designed to give you 5% to 10% return in lest than 21 days via #Equity #Investment.
✅ Stock Name - NSE:JUBLINGREA
Trade Process :-
✅ - Buy only at Buy Level as recommended in the chart. Use GTT feature available with all online brokers
✅ - On successful purchase, immediately create a SL GTT (Stop Loss level asper chart).
✅ - Once Stock Price is at Target 1 level, move your SL to Cost Price or 3% down from Target 1.
✅ - Keep Trailing the SL as Stock Price moves to next Targets.
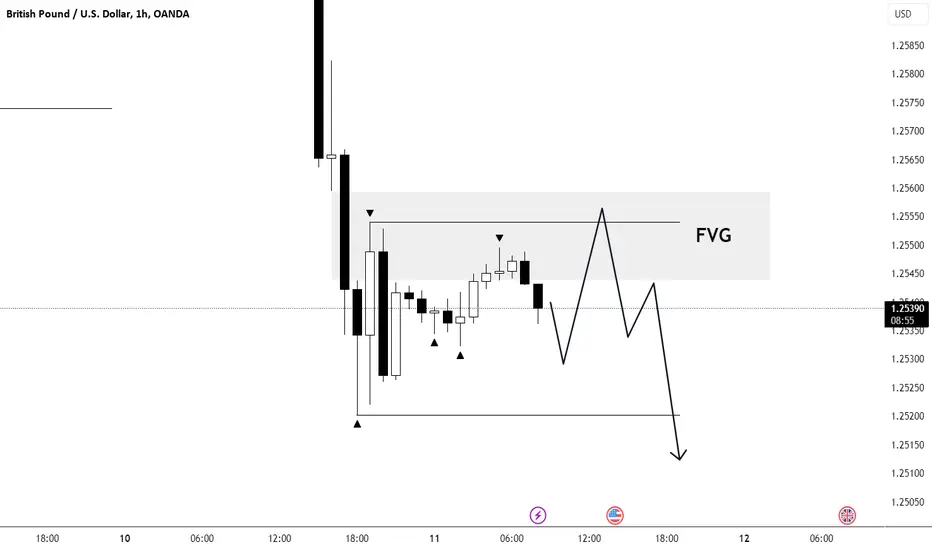
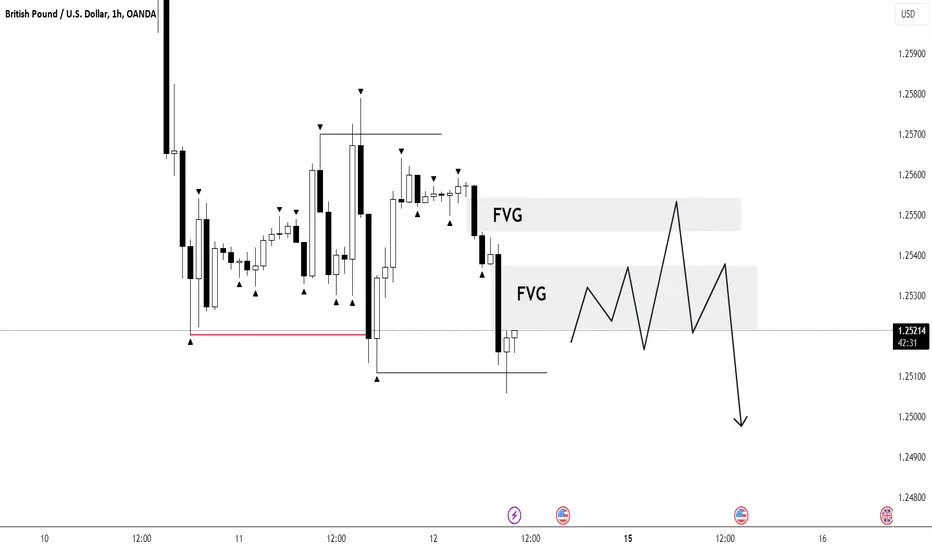
GBPUSDOn the pound, there are no significant differences observed compared to the euro. There is also a clear short order flow, and positions can be considered based on reactions to FVG with targets for continuation in short direction
EURUSD Day PlanWe continue with the short order flow on the euro, and the context remains short as well. There are no significant signs of a reversal observed yet. For a change in sentiment on the primary timeframe, it is important for the price to establish itself above 1.0735. I don't expect any particularly clear movements for the day since the intraday target at PDL has been reached.
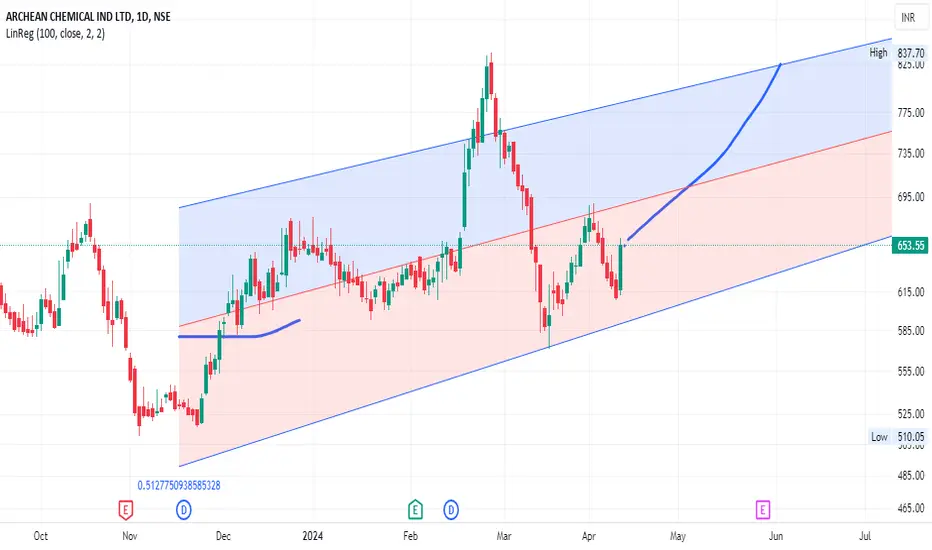
8000 MARKET CAP IS BOUND TO 11 THOUSAND MARKET CAP IN 100 DAYSArchean Chemical Industries Ltd, incorporated in the year , has its registered office in No 2 North Crescent Road, T Nagar, Chennai, Tamil Nadu, 600017, 91-44-61099999. The main industry in which Archean Chemical Industries Ltd operates is Chemicals.
Auditor/Auditors for Archean Chemical Industries Ltd is/are PKF Sridhar & Santhanam LLP. In the main management, is chairman and G Arunmozhi is the company secretary for Archean Chemical Industries Ltd.
SPOT 653
DATE 12 APRIL 24
777 EXPECTED TO GO
ADD UPTO 636
MAIL US FOR MORE VIJAY at Vijaymarketingg . com
HAPPY INVESTING