Invest in STRL: Ride the Coming US Digital Infrastructure Surge◉ Abstract
Sterling Infrastructure (NASDAQ: STRL) is a top pick to benefit from America's digital infrastructure boom, with the sector expected to grow 26% annually through 2034. The company specializes in data centers, 5G networks, and smart city projects, supported by a $1 billion backlog and improving profit margins. While risks like regional market shifts and housing demand exist, STRL's fundamentals are strong—revenue grew 7% in 2024, debt is manageable, and its P/E ratio (17.9x) looks cheap compared to peers (70.5x).
Technically, the stock shows bullish patterns after pulling back 35% from highs. With government infrastructure spending rising and strategic acquisitions likely, STRL could deliver 35-40% returns in the next 12-14 months. A good option for long term investing!
Read full analysis here...
◉ Introduction
The U.S. digital infrastructure market, valued at approximately USD 140 billion in 2024, is expanding rapidly, with a projected CAGR of 26.4% through 2034. This growth is driven by factors like the expansion of 5G networks, increased demand for data centers, rising cloud services adoption, AI automation, and investments in smart cities and edge computing. The 5G infrastructure segment alone is expected to grow at a CAGR of 20.2%, reaching USD 17.26 billion by 2030. North America holds a 42.8% share of the global market.
◉ Key Trends and Opportunities
1. Data Centers: Demand continues to rise, driven by cloud computing, AI, and data-intensive applications. Power availability and location are becoming critical, with providers moving to secondary markets to secure reliable energy sources.
2. Fiber Networks: Expansion is underway to support new data centers and remote connectivity needs. Middle-mile and long-haul fiber, as well as fiber-to-the-home (FTTH), are key areas of investment and consolidation.
3. 5G and Wireless: Ongoing rollout of 5G networks is fueling growth in hardware and network densification, with increased activity expected in wireless infrastructure and tower markets.
4. Edge Computing and Smart Cities: The proliferation of IoT devices and smart city initiatives is driving demand for edge data centers and low-latency networks.
5. Mergers and Acquisitions: The market is seeing consolidation, especially in fiber and data center segments, as major players acquire smaller firms to expand their footprint and capabilities.
Today, we’ll focus on Sterling Infrastructure (STRL), a key player navigating the U.S. infrastructure market.
This report provides a detailed look at STRL's technical and fundamental performance.
◉ Company Overview
Sterling Infrastructure Inc. NASDAQ:STRL is a U.S.-based company specializing in e-infrastructure, transportation, and building solutions. It operates through three key segments: E-Infrastructure Solutions, which focuses on site development for data centers, e-commerce warehouses, and industrial facilities; Transportation Solutions, handling infrastructure projects such as highways, bridges, airports, and rail systems for government agencies; and Building Solutions, providing concrete foundations and construction services for residential and commercial projects. Originally founded in 1955 as Sterling Construction Company, the firm rebranded to its current name in June 2022. Headquartered in The Woodlands, Texas, the company serves a wide range of sectors, including logistics, manufacturing, and public infrastructure.
◉ Investment Advice
💡 Buy Sterling Infrastructure NASDAQ:STRL
● Buy Range - 148 - 150
● Sell Target - 200 - 205
● Potential Return - 35% - 40%
● Approx Holding Period - 12-14 months
◉ SWOT Analysis
● Strengths
1. Strong E-Infrastructure Backlog – With over $1 billion in backlog, Sterling has a robust pipeline of future projects, ensuring sustained revenue growth.
2. Higher-Margin Services Shift – The company’s strategic focus on higher-margin work (21% gross profit margin in Q4) improves profitability without relying solely on volume.
3. E-Infrastructure Growth Potential – Expected 10%+ revenue growth and 25%+ operating profit growth in 2025 position Sterling for strong earnings expansion.
4. Strategic M&A Opportunities – Strong liquidity allows for accretive acquisitions, enhancing market share and service offerings.
5. Share Repurchase Program – Active buybacks reduce outstanding shares, potentially boosting EPS and shareholder value.
● Weaknesses
1. Texas Market Transition Risks – Moving away from low-bid work in Texas may slow revenue growth in the Transportation segment if not managed well.
2. Revenue Loss from RHB Deconsolidation – Excluding $236 million in RHB revenue could distort growth metrics and reduce reported earnings.
3. Residential Market Pressures – A 14% decline in residential slab revenue (due to DFW affordability issues) could persist if housing demand weakens further.
4. Geographic Expansion Challenges – High costs and logistical hurdles in expanding data center projects outside core regions may limit growth opportunities.
5. Competitive Bidding & Acquisition Risks – Difficulty in securing profitable acquisitions or winning competitive bids could hinder margin and revenue growth.
● Opportunities
1. Data Center & E-Commerce Boom – Rising demand for data centers and distribution facilities presents long-term growth potential for E-Infrastructure.
2. Government Infrastructure Spending – Federal and state investments in highways, bridges, and airports could boost Transportation Solutions revenue.
3. Strategic Acquisitions – Pursuing complementary M&A deals could expand capabilities and market reach.
4. Diversification into New Regions – Expanding into underserved markets could reduce dependency on Texas and mitigate regional risks.
5. Operational Efficiency Improvements – Further margin expansion through cost optimization and technology adoption.
● Threats
1. Economic Slowdown Impact – A recession could reduce demand for residential and commercial construction, affecting Building Solutions.
2. Rising Interest Rates – Higher borrowing costs may pressure profitability and delay large-scale projects.
3. Labor & Material Cost Inflation – Increasing wages and supply chain disruptions could squeeze margins.
4. Intense Competition – Rival firms competing for the same infrastructure projects may drive down pricing and profitability.
5. Regulatory & Permitting Delays – Government approvals and environmental regulations could slow project execution.
◉ Revenue & Profit Analysis
● Year-on-Year
➖ FY24 sales reached $2,116 million, reflecting a 7.28% increase compared to $1,972 million in FY23.
➖ EBITDA rose to $334 million, up from $264 million in FY23.
➖ EBITDA margin improved to 15.8%, up from 13.4% in the same period last year.
● Quarter-on-Quarter
➖ Q4 sales decreased to $499 million, down from $593 million in Q3, but showed a slight increase from $486 million in Q4 of the previous year.
➖ Q4 EBITDA was $80.3 million, down from $105 million in Q3.
➖ Q4 diluted EPS saw a notable rise, reaching $8.27 (LTM), up from $5.89 (LTM) in Q3 2024.
◉ Valuation
1. P/E Ratio (Price-to-Earnings)
● Current vs. Peer Average
➖ STRL’s P/E ratio is 17.9x, much lower than the peer average of 70.5x, suggesting the stock is undervalued compared to peers.
● Current vs. Industry Average
➖ Compared to the broader industry average of 22.9x, STRL again looks relatively inexpensive at 17.9x.
2. P/B Ratio (Price-to-Book)
● Current vs. Peer Average
➖ STRL’s P/B ratio stands at 5.7x, slightly higher than the peer average of 5x, indicating overvaluation.
● Current vs. Industry Average
➖ Against the industry average of 3.6x, STRL’s 5.7x P/B ratio suggests a noticeable overvaluation.
3. PEG Ratio (Price/Earnings to Growth)
➖ STRL’s PEG ratio is 0.21, which means the stock appears undervalued relative to its strong expected earnings growth.
◉ Cash Flow Analysis
➖ Sterling Infrastructure's operating cash flow grew to $497 million in FY24, up from $479 million in FY23, showing steady financial strength.
◉ Debt Analysis
➖ The company's debt-to-equity ratio is 0.38, indicating a healthy balance sheet with manageable debt levels.
◉ Top Shareholders
➖ The Vanguard Group has significantly increased its investment in this stock, now owning an impressive 8.3% stake, which marks a 30% rise since the end of the September quarter.
➖ Meanwhile, Blackrock holds a stake of around 8% in the company.
◉ Technical Aspects
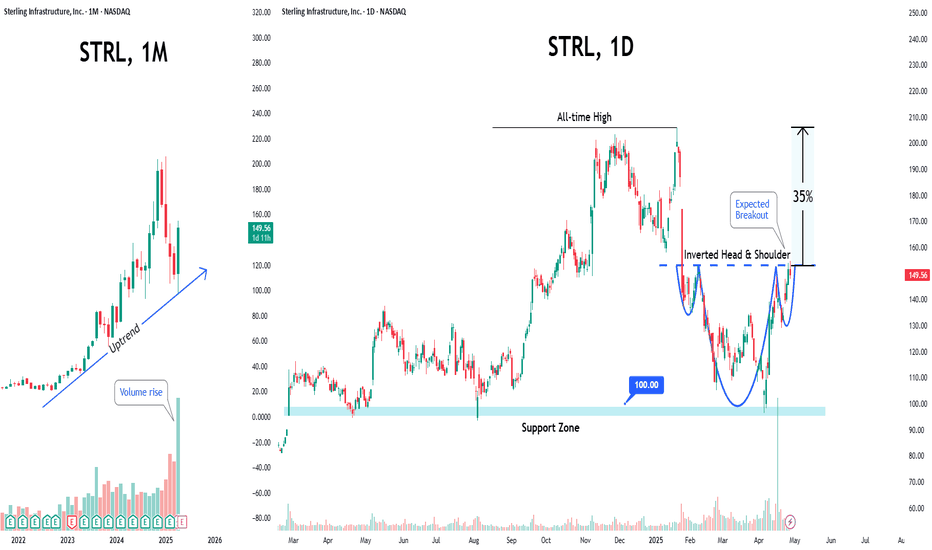
➖ On the monthly chart, the stock remains in a strong uptrend.
➖ On the daily chart, an Inverted Head & Shoulders pattern has formed, signaling a potential breakout soon.
➖ The stock is currently trading at about 35% below its all-time high, making it an attractive investment opportunity.
◉ Conclusion
Sterling Infrastructure (STRL) stands out as a strong investment candidate, backed by solid financial performance, a growing E-Infrastructure backlog, and a strategic focus on higher-margin projects. Its attractive valuation, healthy cash flow, and low debt levels provide further confidence in its growth potential. While there are challenges—such as market competition, geographic expansion hurdles, and economic uncertainties—Sterling’s strengths, including a robust project pipeline, strategic acquisitions, and exposure to high-growth sectors like data centers and 5G infrastructure, offer a favorable risk-reward balance. Overall, Sterling is well-positioned to benefit from the ongoing U.S. e-infrastructure boom, making it an attractive long-term investment opportunity.
Investment
Atour: The Smart Way to Invest in China's Hospitality Market◉ Abstract
Atour Lifestyle Holdings Limited is taking advantage of China's fast-growing hotel industry. The hospitality sector of China is expected to reach $157.46 billion by 2032, growing at a rate of 8.23% each year. This growth comes from a strong economy, more people moving to cities, and an increase in travel. Atour uses a smart business model that allows for quick expansion while keeping costs low. They offer a variety of hotel brands and even sell sleep-related products.
In FY23, Atour's sales jumped to $657.4 million, a 106% increase from the previous year, along with strong earnings growth. With over 83 million members in its loyalty program and a focus on great customer experiences, Atour is set for continued success in China's hospitality market.
Overview of the Hotel Service Industry in China.
Continue reading full article here:
◉ Overview of the Hotel Service Industry in China
China's hotel service industry is on the cusp of a remarkable growth spurt, fueled by the country's soaring economy, rapid urbanization, and an unprecedented surge in domestic and foreign travel.
● Projected Market Value: $157.46 billion by 2032
● Growth Rate: 8.23% Compound Annual Growth Rate (CAGR) from 2024 to 2032
◉ What's Driving this Growth?
● Economic Growth: China's economy continues to expand, boosting disposable incomes and travel budgets.
● Urbanization: As more Chinese citizens move to cities, they're seeking better travel experiences and accommodations.
● Increased Travel: Both domestic and foreign travel are on the rise, driving demand for hotels and travel services.
As China's hotel service industry experiences rapid growth, Atour Lifestyle Holdings NASDAQ:ATAT Company has established itself as a prominent force in the market. By delivering a unique blend of comfort, style, and local charm, Atour is redefining the hospitality landscape in China.
Atour's strategic focus on mid-to-upscale hotels enables the company to provide immersive local experiences, innovative design, and exceptional service. This distinctive approach has fostered a loyal customer base and positioned Atour for continued success in China's burgeoning hotel market.
◉ Investment Advice
💡 Buy Atour Lifestyle Holdings NASDAQ:ATAT
● Buy Range - 27 - 27.5
● Sell Target - 36 - 37
● Potential Return - 30% - 35%
● Approx Holding Period - 12-14 months
◉ Business Model
Atour Lifestyle Holdings Limited utilizes an asset-light, franchise-oriented business model that enables rapid expansion and operational efficiency in China's hotel industry. Here are the key components:
● Manachised Model: Atour primarily operates through a "manachised" model, where franchisees handle capital expenditures and hotel leases while Atour provides management and training. This approach minimizes operational costs and maximizes revenue from franchise royalties.
● Diverse Brand Portfolio: The company offers various hotel brands, including Atour, Atour S, Atour X, and ZHOTEL, catering to different market segments and customer preferences.
● Retail Integration: Atour has expanded into retail by selling sleep-related products, generating significant revenue and enhancing the guest experience.
● Customer Loyalty Programs: The A-CARD loyalty program boasts over 63 million members, driving customer retention and engagement through various benefits.
● Digital Capabilities: Atour leverages technology for a seamless customer experience, allowing easy online bookings and efficient communication during stays.
● Focus on Experience: The company emphasizes delivering unique lifestyle experiences through thematic hotels and tailored offerings.
◉ Key Competitors
1. Huazhu Group (H World Group): A leading competitor with over 10,150 hotels, Huazhu operates a similar manachised model and has been expanding rapidly, making it one of the largest players in the market.
2. Jin Jiang International: With a vast portfolio exceeding 12,000 hotels, Jin Jiang is another major competitor that employs a mix of franchising and management strategies.
3. GreenTree Hospitality Group: Focused on midscale accommodations, GreenTree operates around 3,000 hotels and utilizes a franchise-based model with manachised elements.
4. BTG Homeinns Hotels: Known for its budget offerings, BTG Homeinns has a significant presence with thousands of hotels primarily targeting domestic travelers.
5. Plateno Group (7 Days Inn): Operating primarily in the budget segment, Plateno utilizes a manachised approach to grow its network of over 3,000 hotels.
These companies dominate the domestic market, while international brands like InterContinental Hotels Group (IHG) and Shangri-La Hotels & Resorts lead the high-end segment.
◉ Strategic Initiatives Powering Atour's Growth Trajectory
● Expanded Hotel Network: 140 new hotels added in Q3 and 732 under development, increasing capacity and driving revenue growth.
● Upscale Brand Introduction: SAVHE Hotel launch in core business districts, enhancing occupancy and average daily rate (ADR).
● Retail Segment Growth: 107.7% year-over-year GMV growth in 'deep sleep' products, boosting revenue and net margins.
● Membership Base Expansion: Over 83 million members, increasing revenue potential through customer loyalty and repeated business.
◉ Revenue & Profit Analysis
● Year-on-year
➖ FY23 sales reached $657.4 million, a remarkable 106% increase from $328 million in FY22.
➖ EBITDA surged to $142 million, up from $36 million in FY22.
➖ The EBITDA margin widened to 21.6% from 11.15% in the same period.
● Quarter-on-quarter
➖ Q3 sales reached $270 million, a 9% increase from $247 million in Q2 and a 52% jump from $177 million in Q3 2023.
➖ Q3 EBITDA climbed to $72.6 million, up from $56.2 million in Q2.
➖ Q3 diluted EPS rose to $0.39 (LTM) from $0.30 (LTM) in Q2 2024.
◉ Valuation
● P/E Ratio
ATAT has a P/E ratio of 24x, which is fairly valued when compared to the peer average of 23.7x.
● PEG Ratio
With a PEG ratio of just 0.15, ATAT appears to be undervalued based on its anticipated earnings growth.
◉ Profitability Analysis
With a 30.7% ROCE, ATAT demonstrates its expertise in generating substantial profits through efficient capital allocation.
◉ Cash Flow Analysis
ATAT achieves remarkable growth in operational cash flow, rising 582% to $280 million in FY23 from $41 million in FY22.
◉ Debt Analysis
ATAT's debt-to-equity ratio stands at 0.67, signaling that debt is not a significant concern for the company.
◉ Top Shareholders
➖ Mr. Haijun Wang, CEO of Atour Lifestyle Holdings, holds a significant 19.2% stake.
➖ Trip.com Group Limited holds approximately 13.6% stake.
◉ Technical Aspects
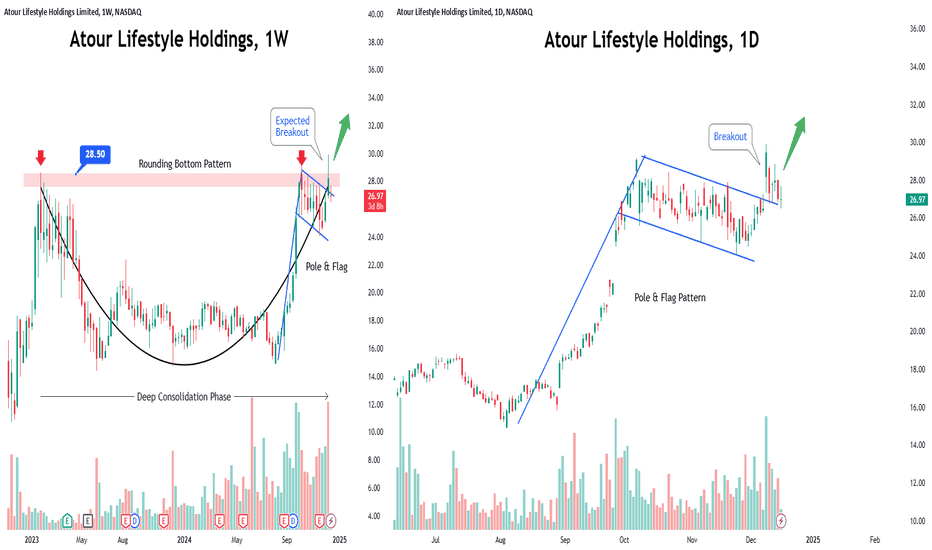
➖ The weekly chart indicates that after a long period of consolidation, the stock price has formed a Rounding Bottom Pattern and is likely to break through its strong resistance zone soon.
➖ A Pole & Flag pattern has formed on the daily chart, with the stock price targeting higher levels following a successful breakout.
◉ Conclusion
Following a thorough analysis, we believe Atour presents a lucrative investment opportunity. With its appealing valuation, impressive financial track record, and strategic growth initiatives, Atour is well-positioned to capitalize on the growing tourism sector. The company's commitment to delivering exceptional customer experiences further strengthens its potential for long-term growth and value creation for shareholders.
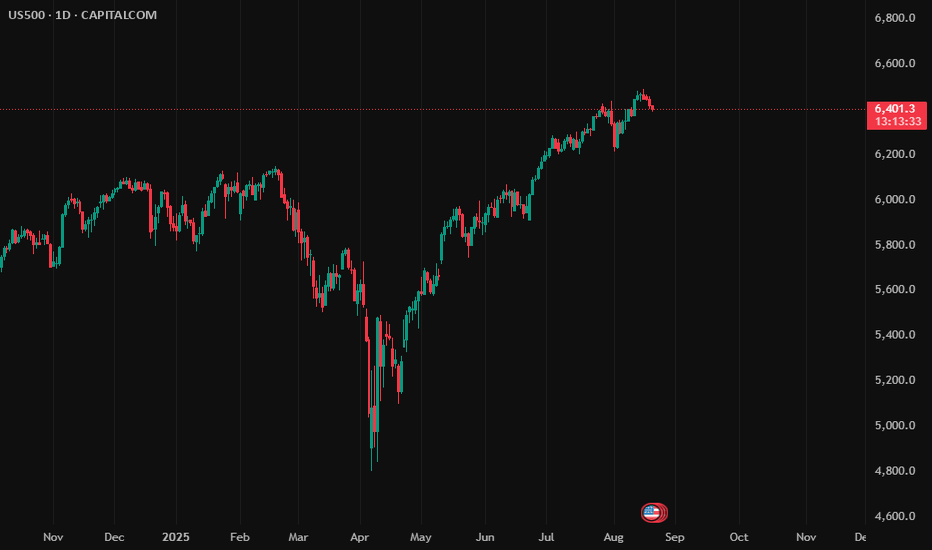
Portfolio Update Aug 20 2025I sold all ORCL stocks yesterday as I see the market topped. Big tech companies are retracing now, so this might be the peak for now.
We have Jackson Hole symposium in the upcoming days which may lead to policy changes. We also waiting to see tariff effect in the 3rd quarter earnings. Plus Ukraine war updates.
Disclaimer: This content is NOT a financial advise, it is for educational purpose only.
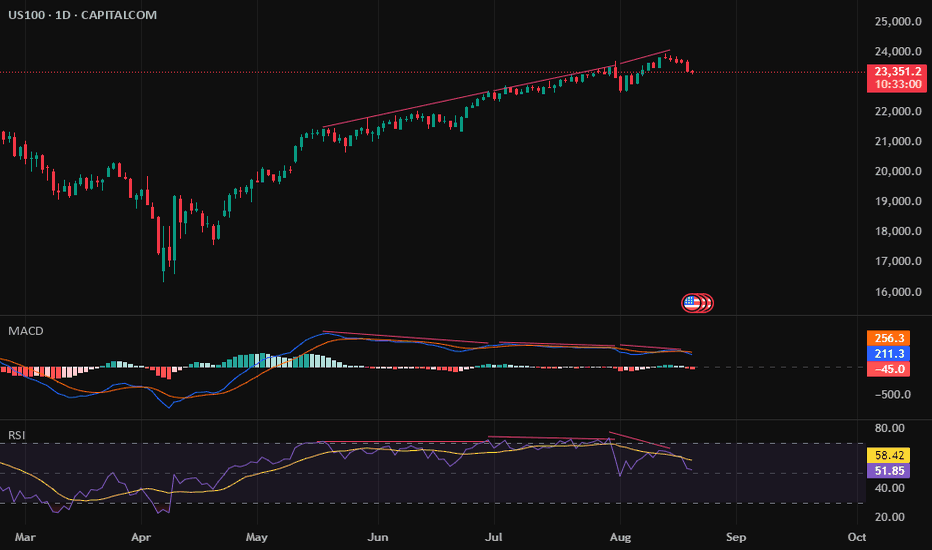
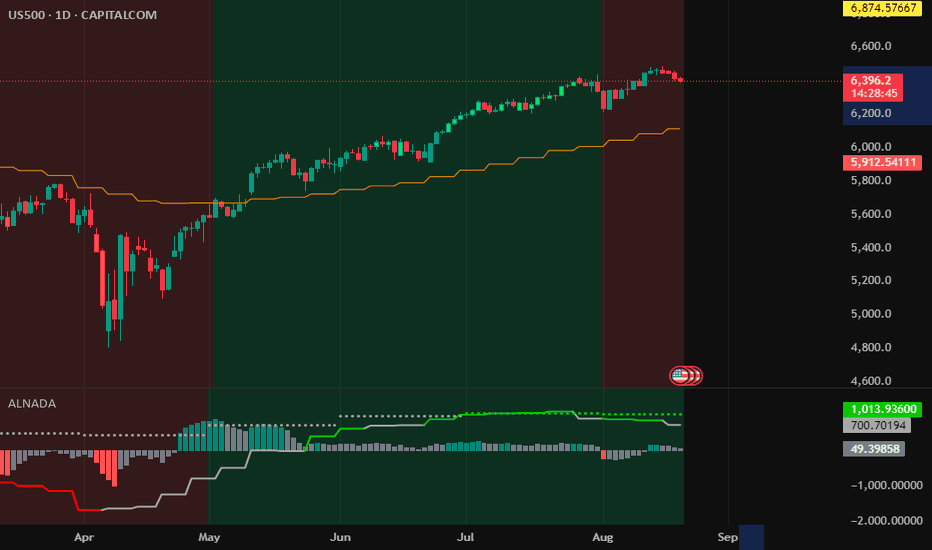
S&P500: Losing Momentum !I see the rally comes to end, the recent upside move has no momentum. The stocks need a new catalysts to continue, but I do not think this to happen. I suggest that US500 to go down in the next 30 days or so.
Disclaimer: This content is NOT a financial advise, it is for educational purpose only.
Analysis for the next weekHello traders.
The market is going to open tonight, are you ready for the next week??
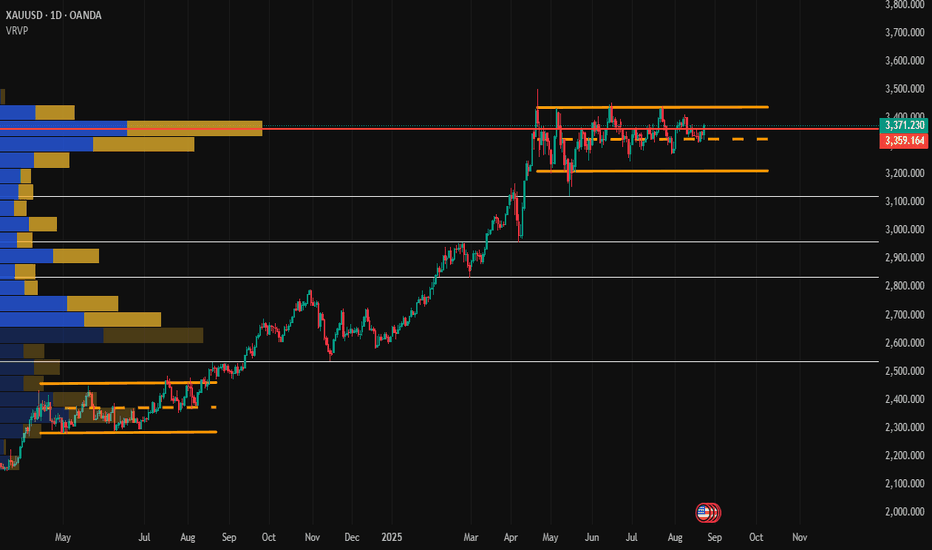
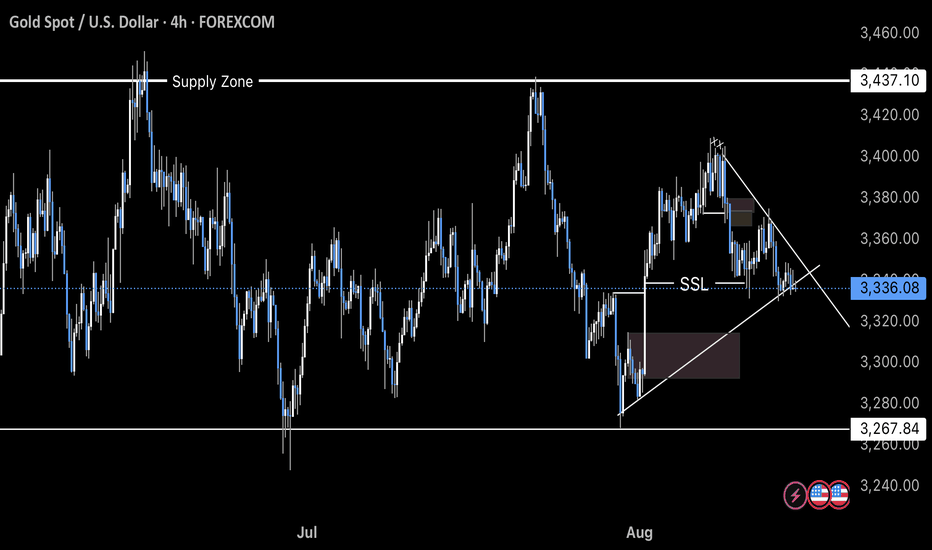
The gold is falling like a crazy from the last week. Gold can fly from 3327 - 3301. Next week will be bullish. Gold can touch 3413 next week.
Kindly share your thoughts, where will be the next move for gold according to your analysis??
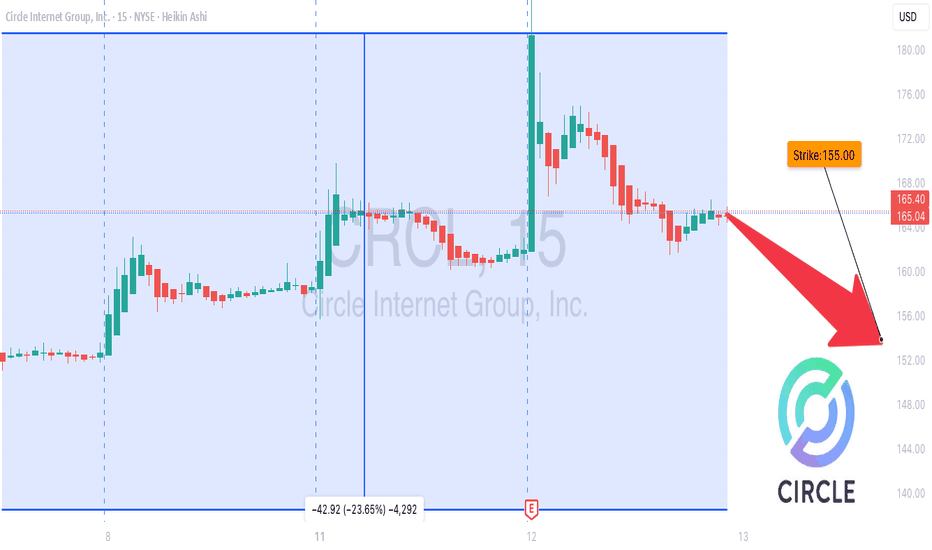
CRCL on the Edge: Bearish Play Loading… 📉 CRCL Weekly Options Alert (Aug 12, 2025)**
**Bias:** ⚠ **Neutral → Bearish** — Weak volume + bearish weekly RSI
📊 **Quick Stats:**
* **Daily RSI:** 40.8 ↗ (bullish divergence from oversold)
* **Weekly RSI:** 58.7 ↘ (bearish drift)
* **Options Flow:** Call/Put = **1.19** → neutral
* **Volume:** 1.0× last week — no institutional conviction
* **Gamma Risk:** Moderate — 3 DTE & rising time decay
💡 **Consensus Take:**
* Lack of strong buying pressure + bearish weekly trend = higher downside risk short term.
**Trade Idea:**
* **Type:** Naked PUT
* **Strike:** \$155.00
* **Expiry:** Aug 15, 2025
* **Entry:** \$6.22
* **PT:** \$10.90 (+75%)
* **SL:** \$2.80
* **Confidence:** 68%
* **Entry Timing:** Open
⚠ **Risks:**
* Earnings news could swing price violently
* Daily RSI divergence could spark short-term bounces against your position
---
**📈 TL;DR:**
Weekly trend still weak, volume flat, options flow balanced → bearish skew.
\#CRCL #OptionsTrading #WeeklyOptions #PutOptions #OptionsFlow #StockMarket #TradingSetup #BearishTrade #TechnicalAnalysis #OptionsAlert
NLB Banka Vision: Achieving €2 B Revenue and €1 B ProfitNLB Banka stands at a pivotal moment in its journey. Guided by a bold vision set forth by its Board of Directors, the bank is primed to transform into a leading financial powerhouse across Southeastern Europe (SEE). This vision is not merely aspirational; it is rooted in a clear, actionable roadmap that leverages the synergies of mergers and acquisitions (M&A) and organic growth, even amidst a challenging macroeconomic environment. By aligning its strategic initiatives with its core strengths, NLB Banka is well-positioned to achieve its ambitious targets of €2.2 billion in revenue and €1 billion in profit.
The Current Landscape
As of today, NLB Banka operates in a market characterized by both opportunities and challenges. While the SEE region offers significant growth potential due to underpenetrated financial markets, the current economic environment presents hurdles such as declining interest rates and inflationary pressures. The growth of the bank’s loan portfolio has been a bright spot, but it has faced challenges in fully offsetting the compression in net interest margins.
Nevertheless, NLB Banka's resilience and adaptability are evident. Its robust digital transformation initiatives, enhanced risk management frameworks, and customer-centric approach have provided a solid foundation to capitalize on growth opportunities. The Board recognizes that achieving its revenue and profit targets requires not only sustaining the current momentum but also scaling its operations strategically.
The Strategic Roadmap
To achieve €2.2 billion in revenue and €1 billion in profit, the Board has outlined a three-pronged strategy:
1. Accelerated Growth through M&A
The SEE region remains fragmented, with numerous mid-sized banks and financial institutions operating across borders. NLB Banka sees this as an opportunity to establish itself as a consolidator in the region. By acquiring strategically aligned banks and integrating their operations seamlessly, NLB Banka can expand its market share, customer base, and product offerings.
Target Markets: Focused acquisitions in high-potential markets such as Serbia, Croatia, and North Macedonia.
Synergies: Realizing cost efficiencies through operational integration and leveraging economies of scale.
Cross-Selling: Expanding the reach of its digital platforms and diversified product portfolio to acquired customer bases.
The successful execution of these M&A activities will enable NLB Banka to accelerate revenue growth while creating a strong competitive moat in the SEE region.
2. Organic Growth Through Innovation and Customer Focus
Organic growth remains a cornerstone of the bank’s strategy. By deepening relationships with existing customers and attracting new ones, NLB Banka aims to drive sustainable growth.
Digital Transformation: Continued investment in cutting-edge digital banking solutions to enhance customer experience and operational efficiency.
SME and Retail Expansion: Growing its SME and retail loan portfolios in underbanked areas of SEE.
Green and Sustainable Financing: Aligning with global trends by offering products such as green bonds and sustainable investment options, catering to environmentally conscious customers and businesses.
Customer-Centric Approach: Leveraging data analytics to personalize product offerings and improve customer retention.
3. Operational Excellence and Cost Optimization
Achieving the profit target of €1 billion requires more than just revenue growth; it demands a relentless focus on operational efficiency.
Streamlined Processes: Continued simplification of internal workflows to reduce costs.
Automation and AI: Using advanced technologies to enhance decision-making and automate routine operations.
Cost Synergies from M&A: Realizing savings through shared resources and consolidated systems.
Overcoming Challenges
The Board is acutely aware of the challenges that lie ahead. Declining interest rates, inflationary pressures, and regulatory hurdles require proactive measures to mitigate risks. NLB Banka’s strong capital position and risk management expertise will play a pivotal role in navigating these challenges. Additionally, the diversification of revenue streams—including fee income from wealth management, insurance, and payments—will further insulate the bank from macroeconomic volatility.
The Vision Realized
By 2028, NLB Banka envisions itself as the undisputed leader in SEE banking, with a robust footprint across the region. The successful execution of its M&A and organic growth strategies will not only drive financial performance but also position the bank as a key partner in the economic development of the SEE region.
At €2.2 billion in revenue and €1 billion in profit, NLB Banka will have proven that a clear vision, combined with strategic execution and operational excellence, can overcome even the most challenging of economic landscapes. This is not just a story of growth; it is a testament to the resilience, innovation, and leadership that define NLB Banka.
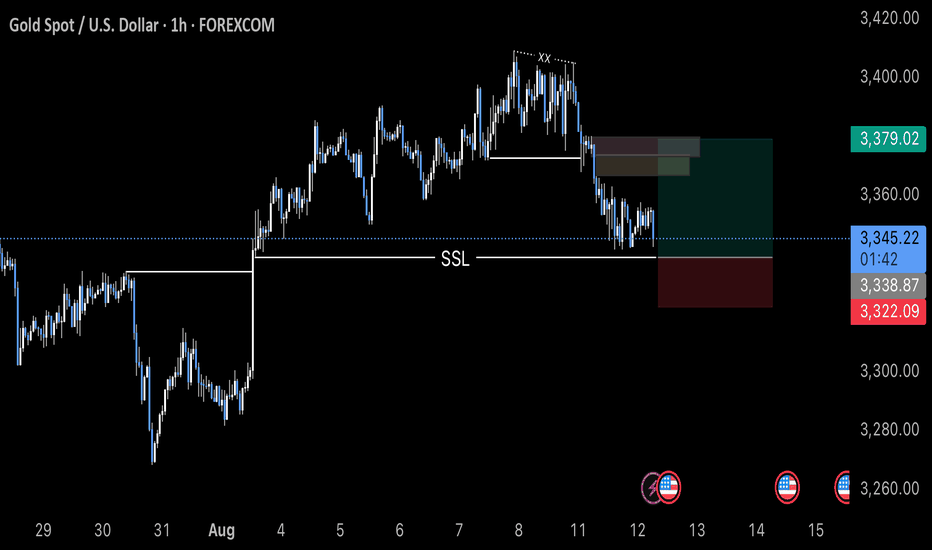
Analysis for the CPI News
Good Morning Traders,
Here is my analysis for the CPI News, as you seen the waterfall of gold, price has filled the FVG according to the D1 time frame, there is SSL, the price can hit the SSL and can fly during the news impact, here is our trade entry, Stop loss and Target.
Good Luck Mates!!
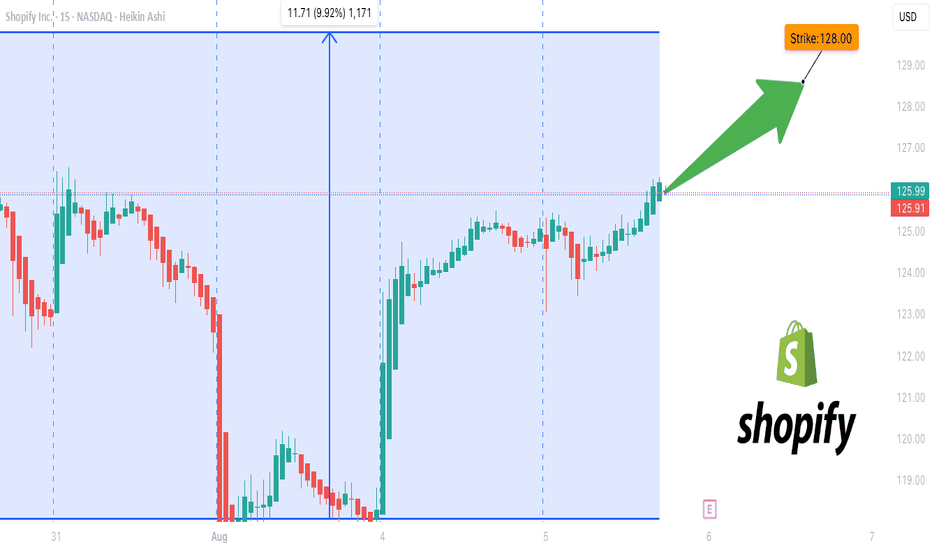
SHOP Bulls Are Back!
**SHOP Bulls Are Back! \$128 Calls Flash 80% Confidence Ahead of Earnings 🚀**
---
### 📋 **Post Body (TradingView Viral Format):**
**SHOP Weekly Options Alert — Aug 8 Expiry 💥**
📈 **Momentum Check:**
* RSI (Daily/Weekly): 🔼 Rising
* Call/Put Ratio: **1.35** (Bullish)
* Volume: Confirmed Institutional Support
* Confidence Level: **80%**
---
📊 **Recommended Trade:**
* **Type:** Buy Call
* **Strike:** \$128
* **Entry:** \$5.70
* **Stop Loss:** \$2.85
* **Targets:** 🎯 \$8.55 / 💰 \$11.40
* **Expiry:** Aug 8, 2025
* **Entry Timing:** Market Open
---
⚠️ **Key Risk:**
Major earnings event approaching — **exit before earnings** if holding through volatility isn’t part of your plan. Position sizing is **crucial**.
---
💡 **Strategy Insight:**
Strong consensus across models (Grok, Gemini, Claude, Llama, DeepSeek) aligns on bullish bias. This is a **premium setup** — watch for confirmation early in the week.
---
📦 **Trade JSON (for automation nerds):**
```json
{
"instrument": "SHOP",
"direction": "call",
"strike": 128.00,
"expiry": "2025-08-08",
"confidence": 0.80,
"profit_target": 8.55,
"stop_loss": 2.85,
"size": 1,
"entry_price": 5.70,
"entry_timing": "open",
"signal_publish_time": "2025-08-05 07:05:45 UTC-04:00"
}
```
---
### 🏷️ **Recommended Tags (TradingView Style):**
`#SHOP #OptionsTrading #WeeklyOptions #CallOptions #SHOPStock #BullishBreakout #TechnicalAnalysis #EarningsPlay #TradingStrategy #MomentumTrade #RSI #VolumeAnalysis #SmartMoney #TradingView`
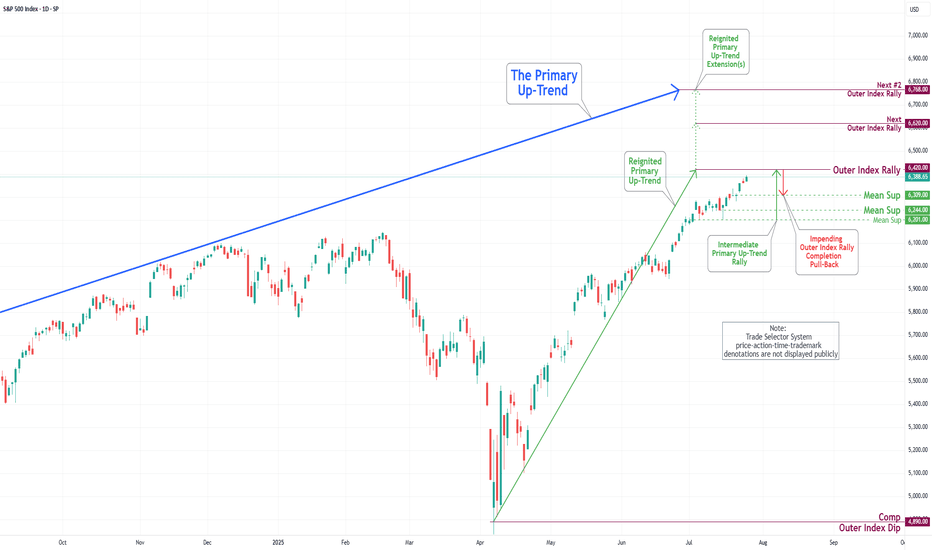
S&P 500 Daily Chart Analysis For Week of July 25, 2025Technical Analysis and Outlook:
In the trading activity observed last week, the S&P 500 Index exhibited a predominantly upward trajectory. It traded around the Key Resistance level of 6314. It successfully broke through this level, with the primary objective being to complete the Outer Index Rally at 6420, as outlined in the previous week's Daily Chart Analysis.
It is crucial to acknowledge that the current price movement may prompt a substantial pullback following the completion of the Outer Index Rally, with the main target identified as the Mean Support level of 6309. Following this potential downward adjustment, it is anticipated that the index will resume its upward trend, targeting a retest of the forthcoming completion of the Outer Index Rally at 6420.
Bitcoin(BTC/USD) Daily Chart Analysis For Week of July 25, 2025Technical Analysis and Outlook:
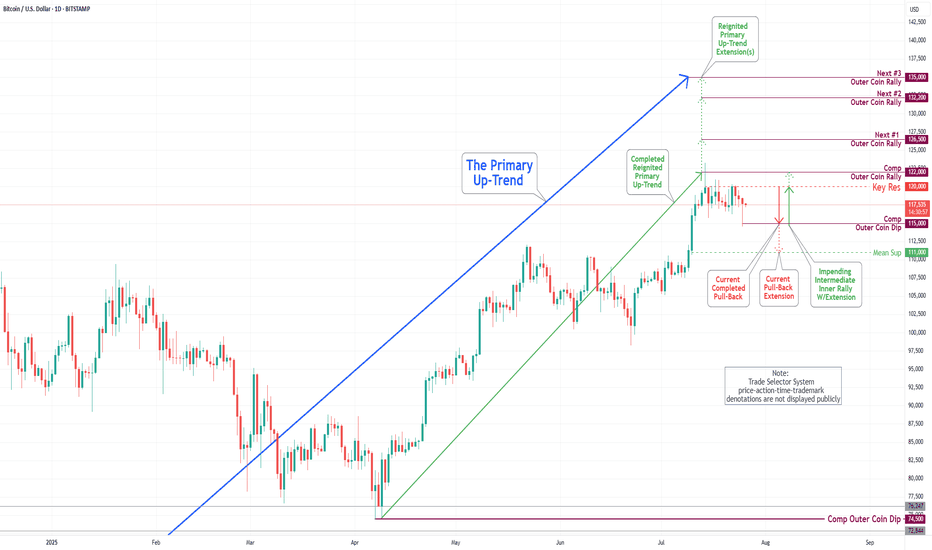
In the trading session of the previous week, the Bitcoin market exhibited considerable volatility as it retested the Key Resistance level at 120000. On the lower end of the spectrum, the market engaged with the Mean Support levels at 117500 and 115900, culminating in the completion of the Outer Coin Dip at 115000. Currently, the coin is poised to retest the Key Resistance at 120000 once again. This anticipated rebound will necessitate a retest of the completed Outer Coin Rally at 122000. The additional target levels for the renewed Primary Up-Trend are 126500, 132200, and 135000.
$RCAT Momentum Play – Institutional Money, Defense Narrative, an
🚀 NASDAQ:RCAT Momentum Play – Institutional Money, Defense Narrative, and a Chart Screaming Higher 📈
📅 Posted: July 18, 2025
💡 Five AI models, one trade idea: follow the smart money, manage the risk.
⸻
🧠 AI Consensus Summary (Multi-Model Breakdown)
Model Bias Highlights
DeepSeek (DS) ⚠️ Bullish, Cautious +78% over 5 days. RSI 83.39. Weak volume = risk of cool-down.
Llama (LM) ✅ Moderately Bullish Above all EMAs. MACD strong. Caution: near upper Bollinger Band.
Grok (GK) 🔥 Strong Bullish Pentagon catalyst. EMAs bullish. Ignore RSI — momentum matters.
Gemini (GM) 🔥 Strong Bullish Institutional buying. Clean breakout path to $15.00.
Claude (CD) ⚠️ Modestly Bullish Overbought but structurally sound. Supports small, well-managed long.
⸻
🔍 Trade Setup – RCAT LONG
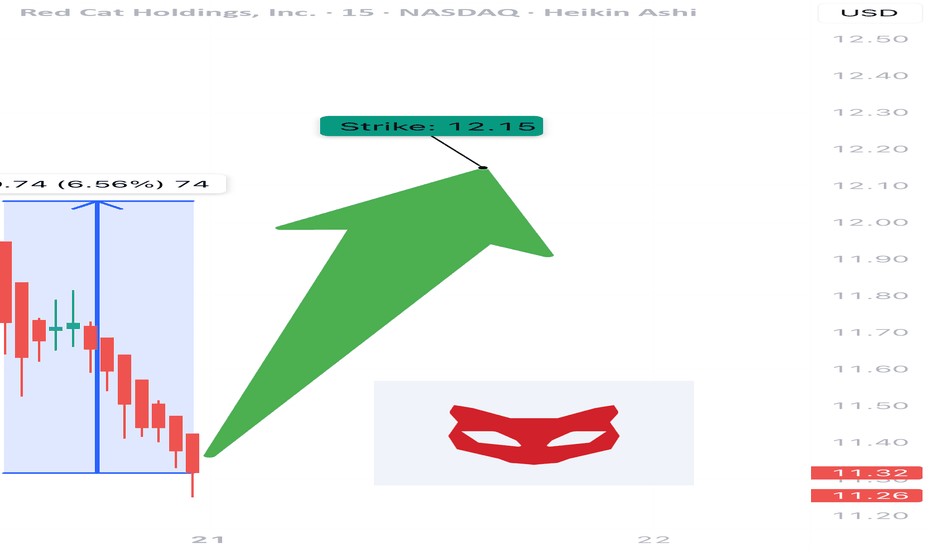
🎯 Entry Price: $12.15 (Market open)
💰 Take Profit: $15.00
🛑 Stop Loss: $10.80
📊 Position Size: 166 shares
⚖️ Risk Amount: ~$200 on $10,000 account
📆 Max Hold Time: 3–4 weeks
📈 Confidence Level: 80%
📌 Entry Timing: Open (or first pullback toward 12.00 if gapping)
⸻
🧭 Why It Works
• ✅ Narrative Power: Pentagon spending = sector tailwind
• ✅ Institutional Flow: Smart money is already positioned
• ✅ EMA Alignment: Above 10/50/200 on most timeframes
• ⚠️ RSI Hot Zone: Manage risk — but this can stay hot longer than expected
⸻
📌 Levels to Watch
• 📉 Support: $11.50 short-term; $10.80 technical invalidation
• 📈 Resistance: $13.20 (minor) → $15.00 (major target)
⸻
⚠️ Risk Management Reminder
Don’t let green candles fool you. Overbought doesn’t mean reversal, but it does mean tighter stops and no oversizing.
Let the setup breathe — don’t chase.
⸻
📊 TRADE SNAPSHOT
{
"instrument": "RCAT",
"direction": "long",
"entry_price": 12.15,
"stop_loss": 10.80,
"take_profit": 15.00,
"size": 166,
"confidence": 0.80,
"entry_timing": "open"
}
⸻
💬 RCAT running hot — but too hot? Or just getting started?
🚀 Follow for more AI-powered trades.
🔁 Like • Share • Save for later
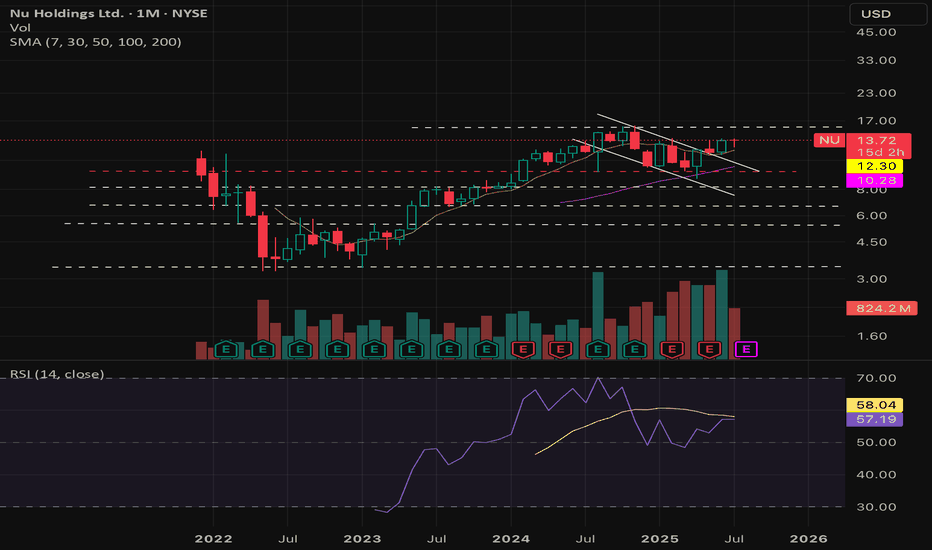
$NU : 30% CAGR for your portfolio for the next 3-5 years!- NYSE:NU is a big name in the LATAM.
- LATAM is expected to grow significantly in next decade with digitalization as the strongest theme.
- Let's talk about fundamentals:
Year | 2025| 2026| 2027 | 2028
EPS | 0.56 | 0.77 | 1.05 | 1.45
EPS growth% | 31.99% | 37.71% | 36.05% | 38.58%
For a company growing EPS at 30%+ deserves a forward p/e of 30
Base Case Stock Value ( Forward p/e = 30 ):
Year | 2025| 2026| 2027 | 2028
fair value | $16.8 | $23 | $31 | $43
Bear Case ( Forward p/e = 20 )
Year | 2025| 2026| 2027 | 2028
fair value | $11.2 | $15.4 | $21 | $29
Bull Case ( Forward p/e = 35 )
Year | 2025| 2026| 2027 | 2028
fair value | $19.6 | $26.95 | $36.75 | $50
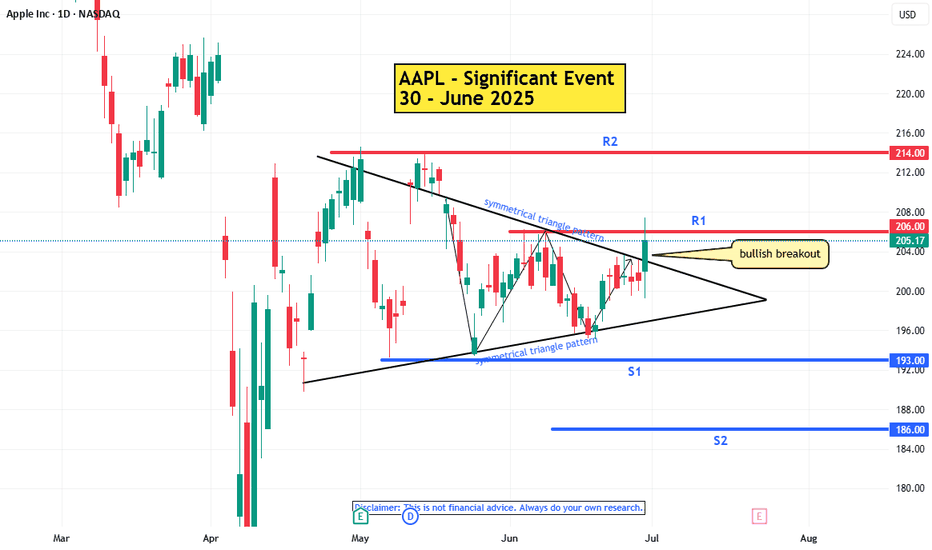
AAPL Significant Event NASDAQ:AAPL
1. Bullish Breakout :
In the daily chart bullish breakout has been seen. If the bullish momentum is strong, the price may follow the upward.
2. Target Price : Potential target price 214
3. Risk Factors:
A. Failure to breakout the resistance 206
B. Sideways trend may be started.
C. Broader market weakness or correction
D. False Breakouts
---------------------
Note :
If you’re interested in receiving detailed technical analysis reports on your selected stocks, feel free to reach out to me. I can provide you with customized reports covering trends, key levels, momentum, patterns, and price projections to support your trading or investment decisions.
