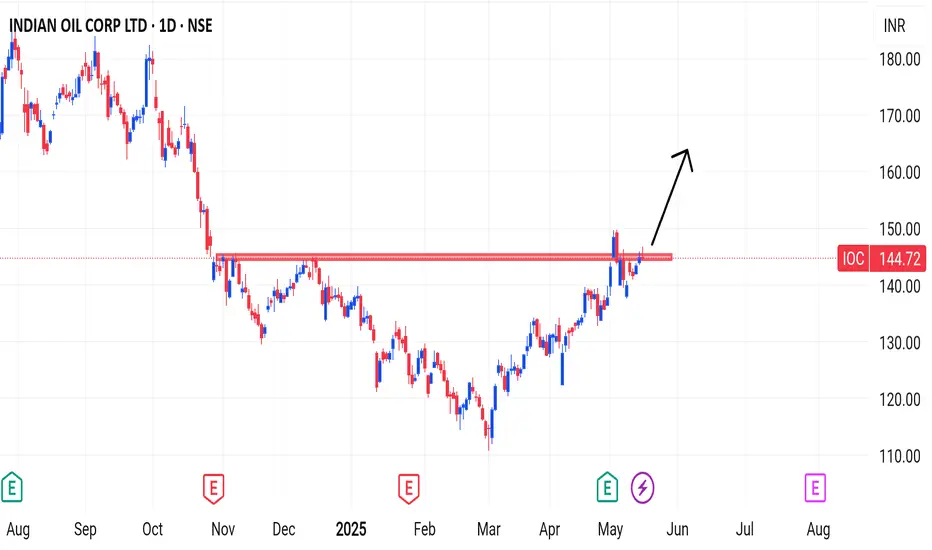
IOC The red horizontal line on the chart represents the resistance zone, which is around ₹145.
In the past, the stock price has stalled at this level multiple times – indicating that it's a strong resistance level.
This time, the stock has attempted to break through this resistance, which is a positive (bullish) signal.
If you find this helpful and want more FREE forecasts in TradingView, Hit the 'BOOST' button
Drop some feedback in the comments below! (e.g., What did you find most useful?
How can we improve?)
Your support is appreciated!
Now, it's your turn!
Be sure to leave a comment; let us know how you see this opportunity and forecast.
Have a successful week
DISCLAIMER: I am NOT a SEBI registered advisor or a financial adviser. All the views are for educational purpose only