Buy IOC short term target 155, 165 & Medium Term tgt 185, 250 Indian Oil Corporation does business in the entire hydrocarbon value chain - from Refining, Pipeline transportation and marketing of Petroleum products to R&D, Exploration & production, marketing of natural gas and petrochemicals. It has the leadership position in the Oil refining & petroleum marketing sector of India.
The company aims to strengthen EV mobility infrastructure by setting up charging points and battery-swapping facilities at its fuel stations. It has also signed a binding term sheet with Panasonic Group to form a JV for manufacturing cells in India.
The company’s R&D is focused on emerging fields such as nanotechnology, Solar, Bioenergy, Hydrogen, etc. It has an effective patent portfolio of 1636. It spent Rs 946 Cr in FY24 on R&D.
The company’s R&D is focused on emerging fields such as nanotechnology, Solar, Bioenergy, Hydrogen, etc. It has an effective patent portfolio of 1636. It spent Rs 946 Cr in FY24 on R&D.
Market Cap ₹ 2,07,370 Cr.
Annual Sales - ₹ 758,106 Cr
Dividend Yield - 8.20 %
Stock P/E - 17.0
Industry PE - 29.2
Debt to equity - 0.82
ROCE - 7.37 %
EPS - ₹ 9.63
Fundamentally, this big company is trading at a very low valuation. The Crude Oil price is expected this year to be on lowest, so we can expect good profit margin and this company is into green energy business so it should have PE multiple of that business as well. We Expect growth in EPS by 30% to 12.5 And re-rating of PE multiple to 20 so that give the share price to ₹ 250 which gives return of 70.88% from current price level of 146.30.
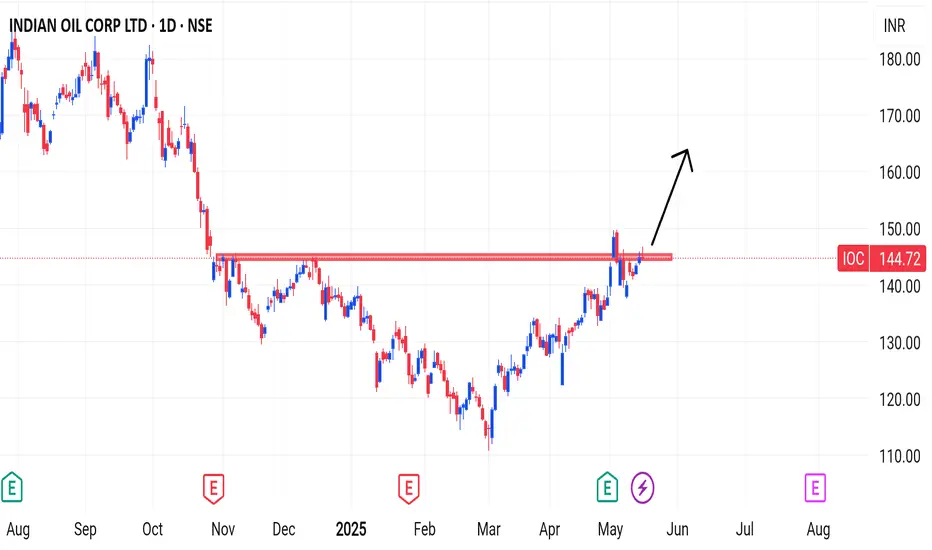
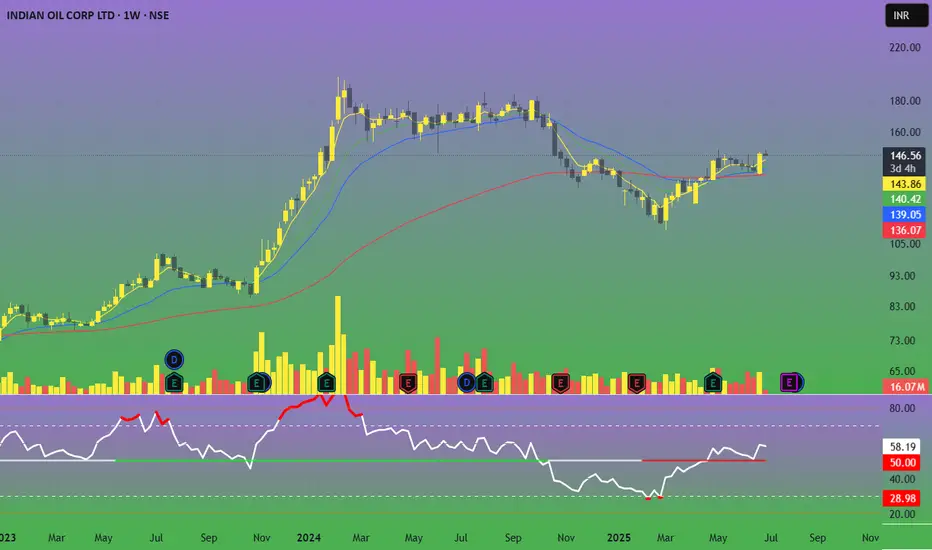
Technically, this is very bullish on weekly, daily timeframe. Price is trading above all short term, medium term averages. It has formed a bullish candlestick pattern on daily and weekly chart, so we expect immediate strong upside to 155, 165 and eventually 185 level and investment target of 250 levels.
Ioctechnicalanalysis
IOC The red horizontal line on the chart represents the resistance zone, which is around ₹145.
In the past, the stock price has stalled at this level multiple times – indicating that it's a strong resistance level.
This time, the stock has attempted to break through this resistance, which is a positive (bullish) signal.
If you find this helpful and want more FREE forecasts in TradingView, Hit the 'BOOST' button
Drop some feedback in the comments below! (e.g., What did you find most useful?
How can we improve?)
Your support is appreciated!
Now, it's your turn!
Be sure to leave a comment; let us know how you see this opportunity and forecast.
Have a successful week
DISCLAIMER: I am NOT a SEBI registered advisor or a financial adviser. All the views are for educational purpose only