IOSTI think this coin can move upwards quite a bit. Broken out of falling wedge with increasing volume.
Will be watching out for resistance and reversal at 8000 levels (white line) otherwise I can go further up.
Bouncing off from fib's golden pocket so it should move upwards.
Iost
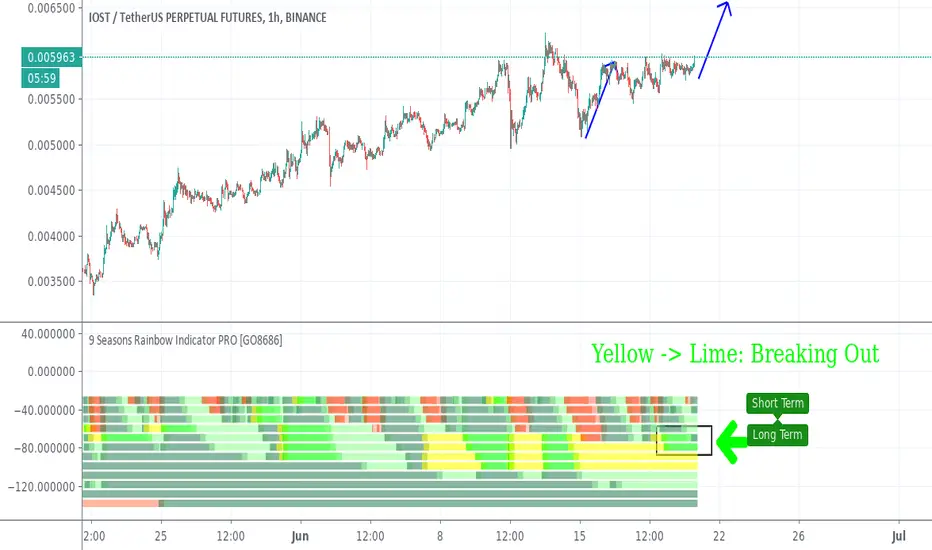
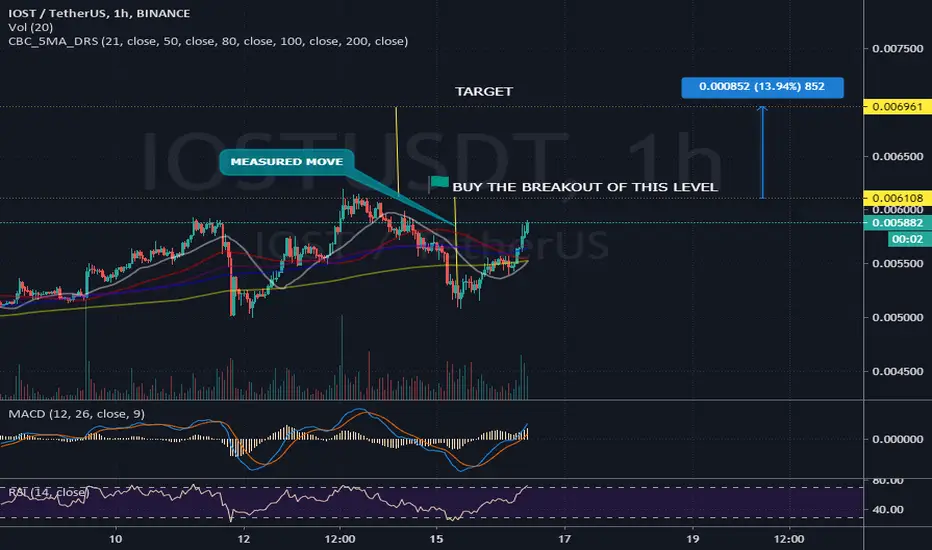
10% Quick Money: IOSTUSDT is Breaking OutSymbol: IOST, IOSTUSDT,IOSTUSDTP, iostbtc
IOSTUSDTP is breakout a big Ascending Triangle
AB-CD may apply, so a 10% -15% quick money chance is coming.
Indicator: 9 Seasons Rainbow Multi TimeFrames Pattern
Timeframes: 1H -2D
Signals: Yellow -> Lime *2 : Breaking Out
Condition: BTCUSD should not break the support 9100 - 9300, as mentioned in my latest post.
Manual Stop Conditions: Lime -> Yellow or Red
I appreciate your like or comment. Welcome to share your idea here.
PM the author for a trial of "9 Seasons Rainbow Multi TimeFrames Pattern".
DISCLAIMER
This is only a personal opinion and does NOT serve as investing NOR trading advice.
Please make your own decisions and be responsible for your own investing and trading Activities.
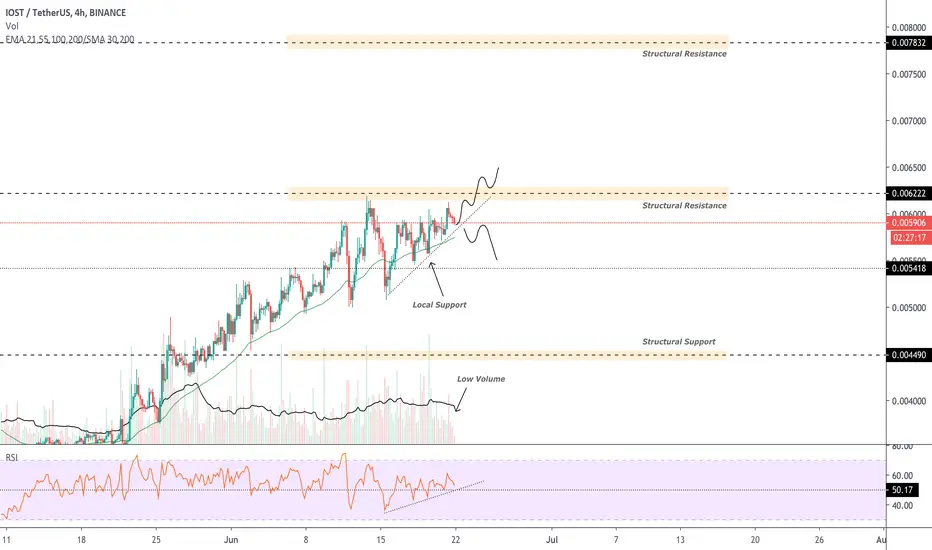
IOSTUSDT | S/R Flip | Volume Climax | .618 Fibonacci Todays analysis - IOSTUSDT – retracing after a strong breakthrough structural resistance.
Points to consider:
- S/R flip Re-test
- Support confluence
- 55 EMA – visual guide
- Volume climax
- Oscillators overextended
IOST is likely to retrace back to structural resistance after a bullish pattern break, S/R flip needs to hold for a valid long trade.
Structural support in confluence with .618 Fibonacci retracement further solidifies the true trade location.
IOST trading above the 55 Exponential Moving Average, acting as a visual guide, price must hold on retest to support the bullish bias.
Volume climax evident, indication of buyer exhaustion, temporary top may be in as price finds its equilibrium before another probable impulse move.
Both, the RSI and Stochastics trading in overextended conditions, a retrace in price will allow oscillators to cool off, creating space for further bullish momentum.
Overall, in my opinion, a long trade is validated on a successful S/R flip re-test.
What are your thoughts? Let me know in the comments below!
Be sure to leave a like and follow me for daily chart updates.
As always - focus on you, and the money will too!

IOSTUSDT | Ascending Triangle | Apex | Structural Resistance Todays analysis - IOSTUSDT – retracing to local resistance, trading in a bullish ascending triangle.
Points to consider:
- Support and resistance converging (apex)
- Bullish ascending triangle
- Bullish price action
- 55 EMA – Visual guide
- Low volume
- RSI projecting higher lows
IOST consolidating within an ascending triangle nearing its apex where a break in either direction is expected.
Recent price action consisting of higher lows and strong bull moves proceeding weak sell-offs is indicative of a bullish bias in the market.
Trading above the 55 Exponential Moving Average, acting as visual support, price must hold to support the bullish bias.
Volume is clearly declining, indication of an influx being imminent, corresponding with the breakout.
RSI trading is trading above 50, projecting higher lows showing strength in the current market.
Overall, in my opinion, a long trade is validated at the test of local resistance (aggressive entry) and the position may be added to as we verify a successful S/R flip above structural resistance (conservative entry).
What are your thoughts? Let me know in the comments below!
Be sure to leave a like and follow me for daily chart updates.
As always, focus on you - and the money will too!
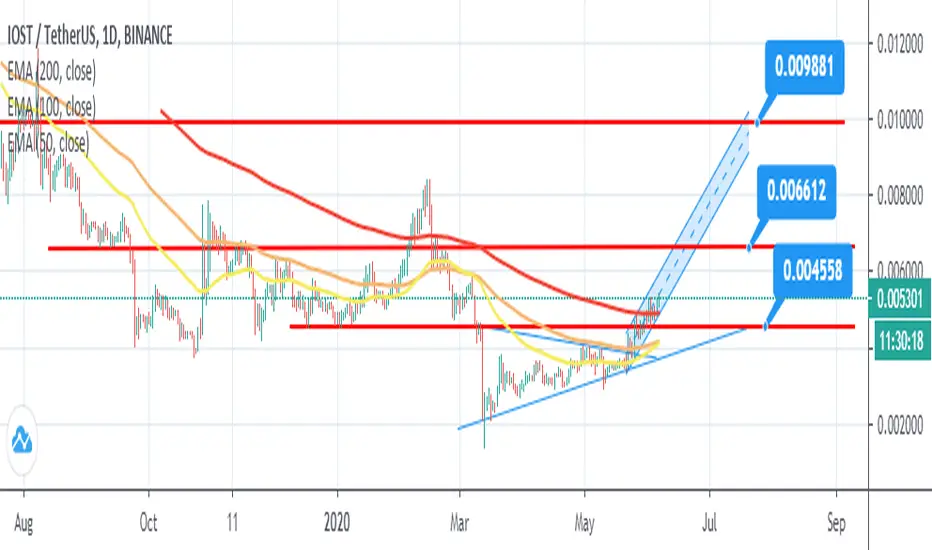
IOST / USDT Bullish Trade Idea IOST is about the break an important resistance zone and it is likely to have an upwards momentum. Set your alerts on TradingView to the upper resistance zone and let it run!
IOST is ready to move uponce break the 0.004558 its ready to move 0.006612 if stays over 3. target is 0.009881
IOST / BTC Mid Term Hold Idea After The BreakoutDsecription is stated on the chart. Do not buy and hold now! Buy only after the breakout of the triangle.

Ascending Triangle on IOST Hello Traders,
IOST/BTC is breaking out of the ascending triangle, which is a bullish indication.
Please like this post and comment.
You are welcome to follow us on our social networks.

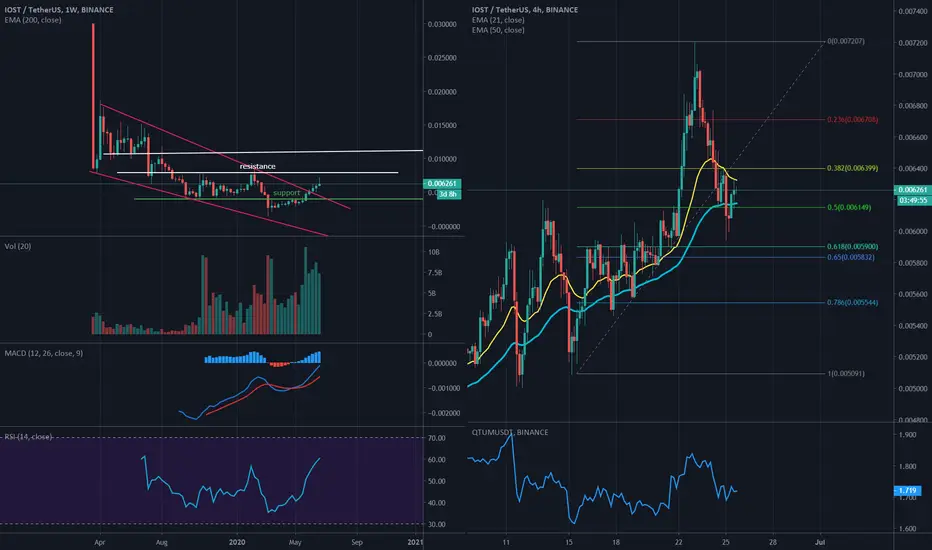
IOST USDT - Can history repeat itself?IOST started its journey at All time High in Jan 2018 @ 0.139 USDT for each IOST Token while reaching a low of 0.003589 USDT per IOST Token in December 2018, a downfall of 97.42% in just 12 months. After hitting the low in December 2018, it started the journey of crawling back up reaching a high of 0.0185 USDT in April 2019. During this time, it crossed the resistance trend line on the daily / weekly charts and subsequently generated returns of over 190% on the weekly charts while around 160% on the daily charts.
Daily Chart showing the trend during Jan 2018 - April 2019:
Weekly Chart showing the price action:
During December 2018, IOST hit the then all time low while approaching the resistance trend line on daily / weekly charts. Come to March 2020, IOST hit the now all time low while approaching the resistance trend line on daily / weekly charts. The said patterns are shown by the highlighted boxes.
Can IOST break the resistance trendline again and showcase similar price action?
We will monitor and wait for break out of trend line if any and take action accordingly.

[ADAM & EVE] IOST/BTC 4HAdam & Eve pattern spotted.
Measured move from base to peak *on breakout* is 80 sats.

#IOST/BTC (May 25)IOST is one of the coins that you should pay attention to because if it pumps, it would be very fast and turn back fast too.
IOST is on the way to 55-60sts zone and it has a very high possibility to break out and move up to 80-85sts in July.
If you don't have IOST, wait for it around 40st


IOST/BTCIOST/BTC Fibonacci Levels.
Disclaimer:
We are not registered or licensed in any jurisdiction whatsoever to provide investing advice or anything of an advisory or consultancy nature,
and are therefore are unqualified to give investment recommendations.
Always do your own research and consult with a licensed investment professional before investing.
This communication is never to be used as the basis of making investment decisions, and it is for entertainment purposes only.
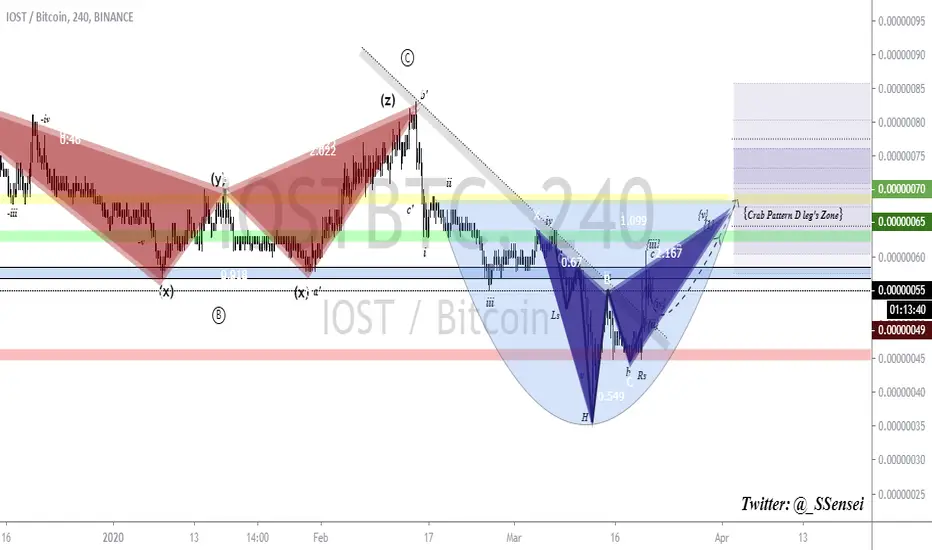
IOSTBTC 4HIOST; looks breakout. May create Cup and -Bearish Crab Patterns with this uptrend.. Good luck!
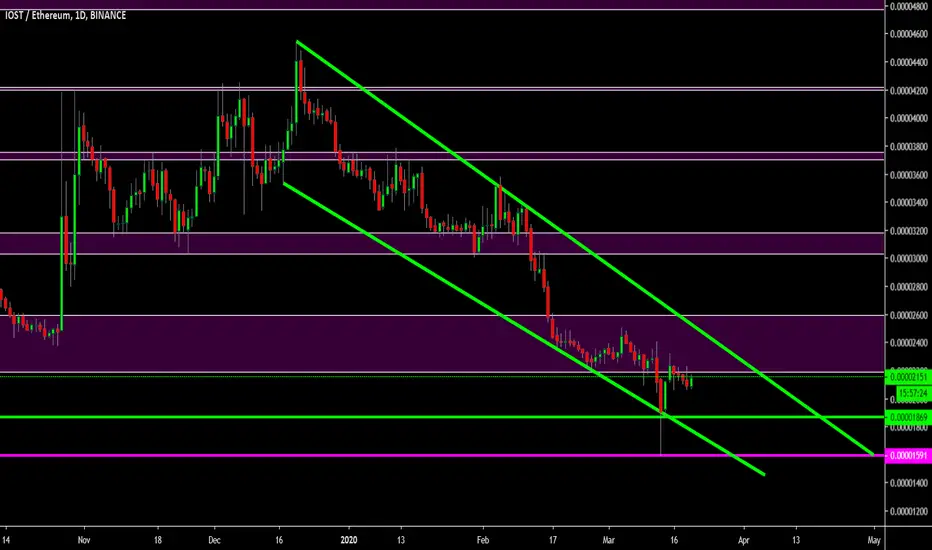
IOST/ETH Buying Range Comes1D chart looks Good
Descending Chart Pattern
Buying range 0.00001600 to 0.00001900
Sell when you Satisfy
Good luck comment below what you think and share your ideas Thanks
IOST Token (IOSTUSDT) long.ll description on the chart.
Please, don't forget to like and follow.
Thank you.


iost good accumaltive rangeiost has just broken out of downtrend and retested old resistance and turned support,
looking good here to accumulate imo

IOST/BTC LONGIOST/BTC
LONG
Open 65;
SL 60;
TP 80;
Risk/Reward: 1/3
Bitcoin dominance has broken the triangle down. We expect good movements on many violas. Here is a good setup that has already shown its worth in practice.

LONG - IOST - BOTTOMDouble bottom formed in high timeframes, expecting the support a 70 sats to hold and push the price to the range high.
Entry: 0.00000075
TP 1: 0.00000085
TP 2: 0.00000097
TP 3: 0.00000108
SL: 0.00000068
CryptoCue is not providing investment advice and is not taking subscribers’ personal circumstances into consideration when discussing investments. Investment involves a high degree of risk and should be considered only by persons who can afford to sustain a loss of their entire position.
CryptoCue is not registered, licensed or authorized to provide investment advice and is simply providing an opinion, which is given without any liability or reliance whatsoever. The information contained here is not an offer or solicitation or recommendation or advice to buy, hold, or sell any security. CryptoCue makes no representation as to the completeness, accuracy or timeliness of the material provided and all information and opinions provided by CryptoCue are subject to change without notice and provided on a non-reliance basis and without acceptance of any liability or responsibility whatsoever or howsoever arising. You hereby irrevocably and unconditionally waive, release and discharge: (a) any and all accrued rights and/or benefits you may have against CryptoCue in respect of any opinion expressed or information conveyed by CryptoCue at any time; (b) any and all Claims you may have against CryptoCue arising out of any opinion expressed or information conveyed by CryptoCue at any time; (c) CryptoCue from all and any claims (whether actual or contingent and whether as an employee, office holder or in any other capacity whatsoever) including, without limitation, Claims you may have against CryptoCue arising out of any opinion expressed or information conveyed by CryptoCue at any time. ("Claims" shall include any action, proceeding, claim, demand, judgment or judgment sum of whatsoever nature or howsoever arising.) You hereby agree to indemnify and hold harmless CryptoCue in respect of any and all Losses paid, discharged, sustained or incurred by CryptoCue in the event of bringing any Claim against CryptoCue. (“Losses” shall include any and all liabilities, costs, expenses, damages, fines, impositions or losses (including but not limited to any direct, indirect or consequential losses, loss of profit, loss of earnings , loss of reputation and all interest, penalties and legal costs (calculated on a full indemnity basis) and all other reasonable professional costs and expenses and any associated value-added tax) of whatsoever nature and/or judgment sums (including interest thereon).

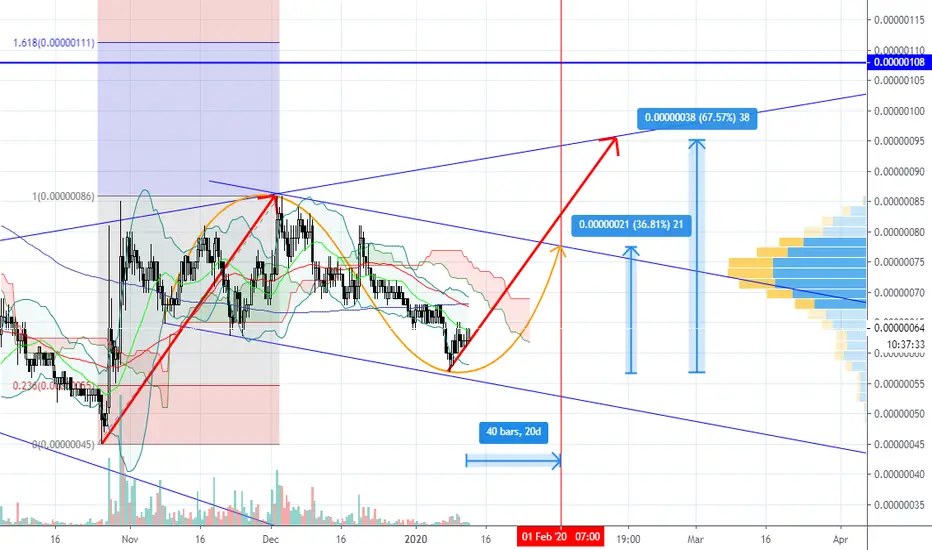
IOST (Jan 12) - 36% in 20 Days, Up to 67%#IOST/BTC (Binance)
Buy : 60 - 62
Sell : 65 - 70 - 75 - 80 - 85 - 90 - 95
Stop : 54
#IOST $IOST #IOSTBTC