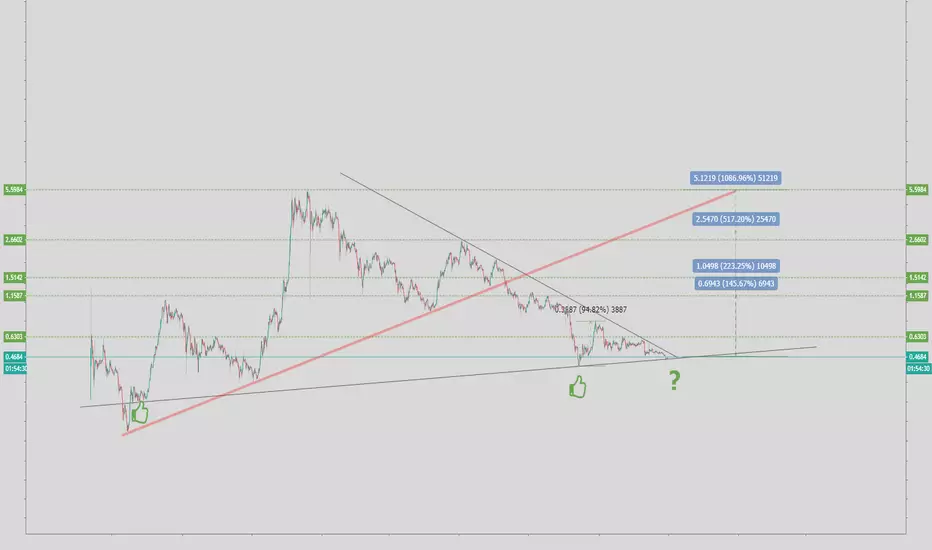
IOTA/USD from 145 to 1050% profit potentialHello!
IOTA is in an interesting position, do you agree?
I singled out all the old goals, new ones are possible.
ITS NOT financial advice!
Iotausd

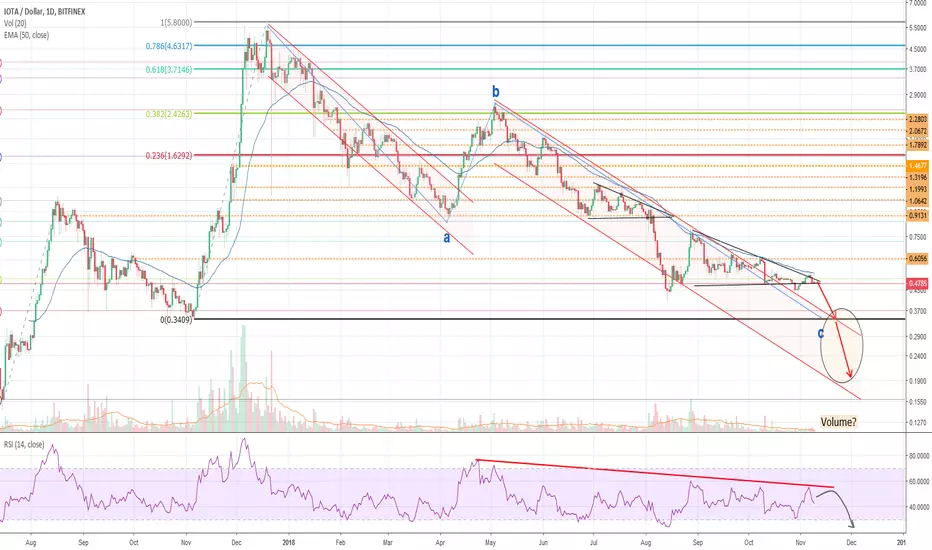
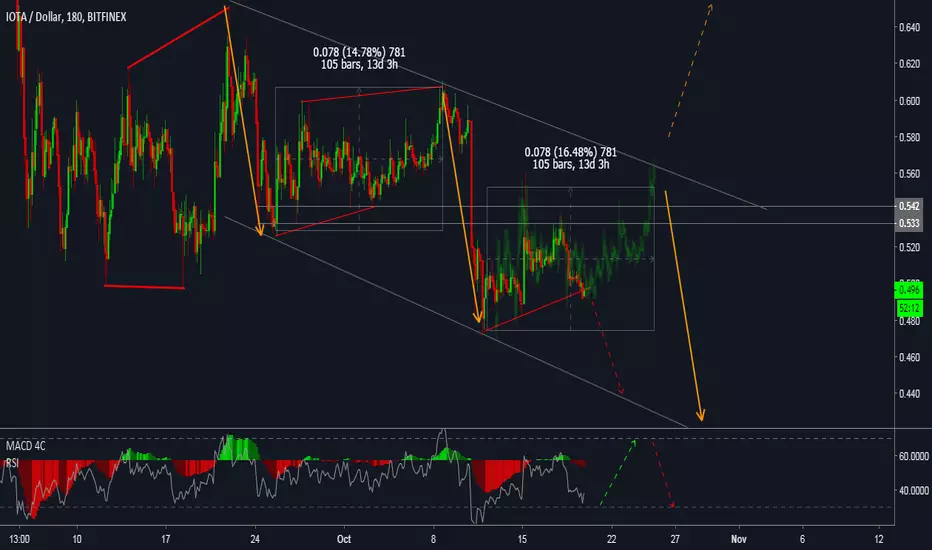
IOTA bearishThe last time when I made a negative analysis for IOTA a lot of people claimed, that it would be false. IOTA never will fall as deep as I had mentioned (0.34$).
And, yes, temporarily I thought they could be right and my analysis had been too negative for this token.
But meanwhile the token had left its consolidation path, entered a new negative trend channel (red) and fell to 0.48$ - not so far away from my older analysis.
But what didn´t happen yet could happen in the near future.
IOTA has left the falling channel to the side - what is a good sign. And if it had rosen to higher prices immediately after leaving the channel I would have concluded that the bearish trend has finished. But instead rising it stayed on the lower level. Every try to break out to the top was lower than then previous top.
IOTA now has reached the peak of the wedge and it is to be expected that it´ll fall - at least on the upper limit of the negative trend channel (scenario I), because there it reaches the very important support consisting out of the Zero-line of fib retracement (0.34$). This has been the aim in my older analysis, too. And on that level we could also consider the ending of the long corrective wave c (EW).
But there is also another possibility, that IOTA would break the support and reenter the negative trend channel (scenario II).
In this case IOTA could even cross the channel to its lower limit and would reach prices around 0.19$. On this level we had the first rush from IOTA in july 2017 - to august 2017 (0.17$ - 1.05$).
I think the difference between I or II depends on the volume which is in the market. Hopefully it´ll come back at time.
This is no trading advice.
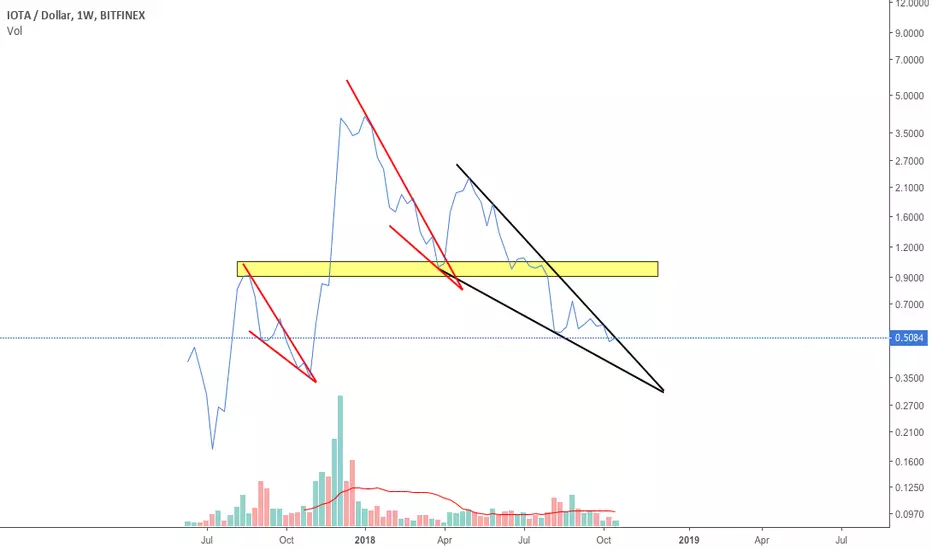
IOTA - Large scale potential Hi guys, this is my first IoT trade idea. I would be looking to make a long position as the price has broken above the descending triangle formed in early May 18' and looks as if it is currently re-testing this trend-line. The previous market high was $5.8 - the current price is 94% lower than that at $0.504. This presents a rather lucrative trade.
The Internet of Things market is predicted to consist of 26 billion units by 2020 - up from 0.9 billion units in 2009. According to researchers, this would generate 14.4 trillion in value; combination of increased revenues and decreased costs dispersed among companies by 2022.
I have not done enough research into this project to have confidence to invest myself or to advise any others to invest, but the sheer numbers of the potential IoT market should be incentive enough to encourage you to have a look into the prospects of this platform.
Losses can exceed initial deposits when trading in the various asset classes. You can manage your losses by using smart risk management. Identify your Entry, Take Profit and Stop Loss levels before you enter a trade.
If you stick by a smart trading plan you can substantially reduce your exposure to losses.

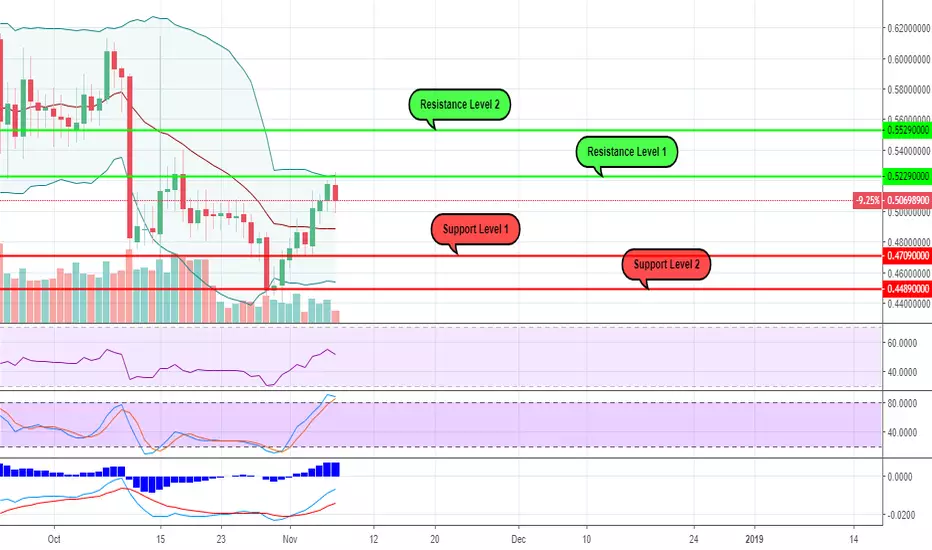
IOTAUSD - 1D Chart Analysis
After 3 consecutive days of growth, in which the price has been increased with 9%, the latter failed to break the Resistance Level of 0.5229$, meaning that another "peak" has been created.
Excepting the MACD, which is indicating a possible continuation of the price increase, the rest of the technical indicators are showing the opposite scenario as it follows :
* The RSI has reached a maximum level of 55 and it started to retrace
* The stochastic is very close to a crossover above the level of 80, meaning that the price is "overbought" and we are waiting for a trend change
* The upper standard deviation of the Bollinger Bands has been touched by the price, meaning that the latter is considered "overbought"
* The trading volumes are getting lower and without any fundamentals, the price seem to start a slight decrease.
In this situation, it seems that the next important moment will be the intersection of the price with the 20 days Moving Average and from there, we will have 2 possible scenarios :
* If the price will bounce back from the 20 days MA, there are big chances for the Resistance Level of 0.5229$ to be "tested" again
* If the price will go below the 20 days MA, the next possible "stop" will be the Support LEvel 1 of 0.4702$
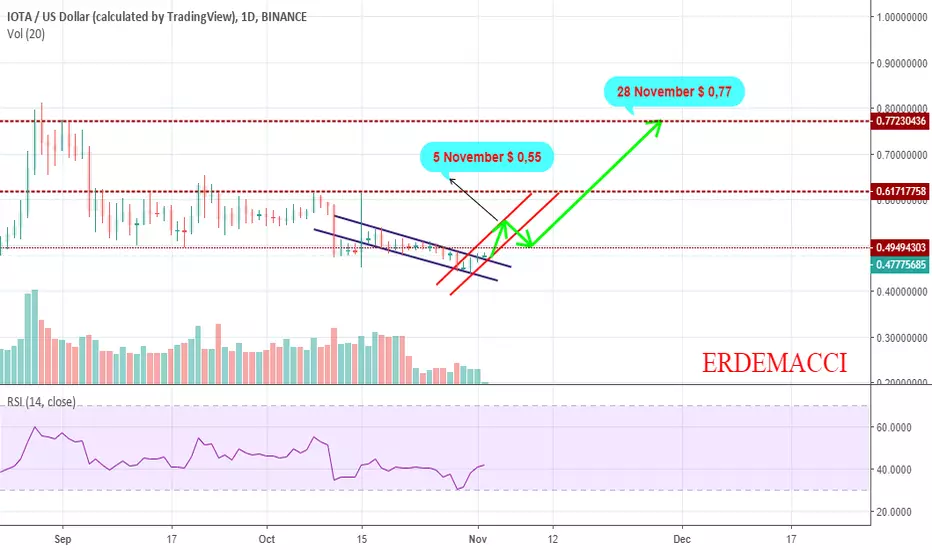
IOTUSD 70%+ potentialIOTUSD has strong potential to the upside, to complete last wave of present correction.

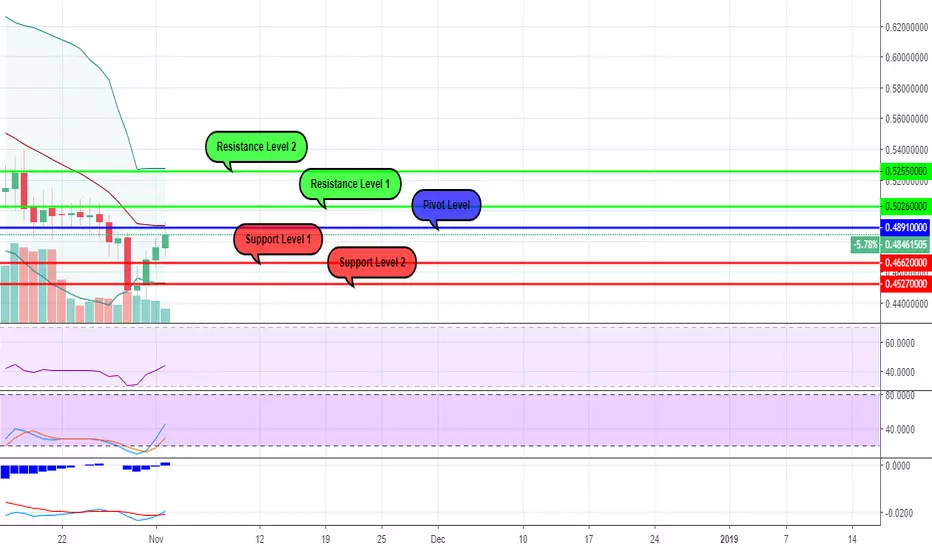
IOTAUSD - 1D Chart AnalysisAfter the market went through a hard period, it seems that we are assisting to a slight "come back", with Iota being one of the coins which are leading the recovery process.
The Stochastic's crossover on the 31st of October and the RSI's "oversold" position indicated these 3 consecutive days of growth but even if we had a price increase of 8.14%, the trend cannot be considered "Bullish" yet, as the price is still located between the 20 days Moving Average and the lower standard deviation of the Bollinger Bands.
On the other hand, MACD's Moving Averages have just intersected, showing a possible continuation of the uptrend with the first obstacle at the Pivot Level of 0.4891$.
* If this level will be broken, the next target price is the Resistance Level 1 of 0.5026$
* If the price will fail to broke the Pivot Level, the target price is 0.4662$
IOTUSD: Falling Wedge cracked below. Expecting a 1W support testThe 1D Falling Wedge broke downwards (RSI = 34.753, MACD = -0.020, Highs/Lows = -0.0276, B/BP = -0.0673) and a test of the 0.4039 Support is necessary to provide the next pattern. That will most likely be a Channel Down on 1D (blue dotted channel) that can extend up to 0.3199 as part of the Lower Low process. The overall long term trend remains bearish (1W RSI = 38.183, grey channel) and so do we on IOTUSD with TP = 0.3199, 0.1459.

IOTAUSDT SOME CLUES and MY ACTION PLANIOTA is one of a solid projects and they work with VW group and IBM -1.31% . I had some clues and wrote down detail on the graph. After these clues SHORT is a good option for me I will wait and get into train after it decides its way to go. Since pulse of BTC 0.06% is near stop, it has not decided yet which way to go and the overall market is waiting for BTC 0.06% except for pumpkin shitcoins :)
People who want to get some risk can buy from this price and set a close SL.
Please add your comments to improve ideas. Wish you have a profitable day


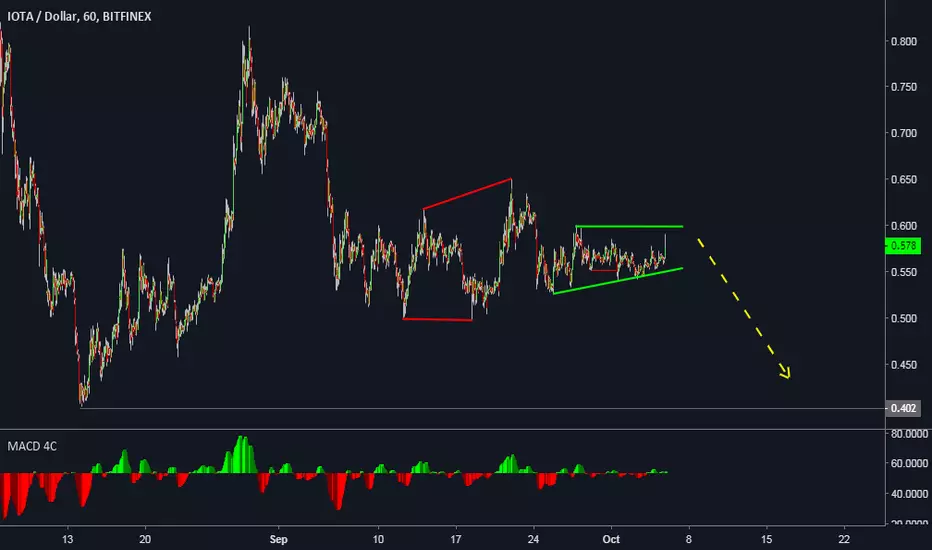
IOTA/USD falling wedgeThe chart pretty much explains itself. Will IOTA go further down inside the falling wedge or will it break out? Depends very much on $BTC as well.
IOTUSD: Falling Wedge near its bearish break-out. Still short.ioThe previous Descending Triangle on 1D has been discontinued as the price broke and remains below the 0.4978 support. As a result a Falling Wedge has emerged on 1D (RSI = 39.630, MACD = -0.018, Highs/Lows = -0.0063, B/BP = -0.0270) which should break towards the end of October and test the 0.4040 1W support. With 1W though still on a long term bearish pattern (MACD = -0.307, Highs/Lows = -0.0515), the 0.3200 November 02, 2017 should be tested. We remain bearish on IOTUSD with TP = 0.3199, 0.1459 (long term).

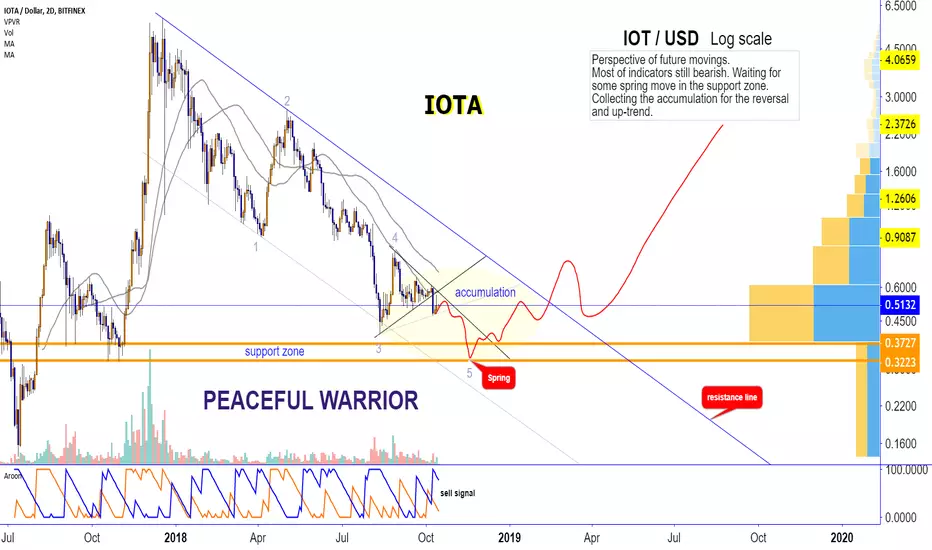
IOTAIOTUSD logarithmic chart
Perspective of future movings.
Most of indicators still bearish. Waiting for some spring move in the support zone.
Collecting the accumulation for the reversal and up-trend.
IOTAUSD - 1D Chart AnalysisAfter yesterday's failed attempt of crossing the 20 days Moving Average, we could see today another negative evolution of the price, confirming the bearish trend which started on the 11th of October.
Other factors that we might consider for this scenario would be the RSI which seems that is heading to the "oversold" area, the Stochastic's crossover which is indicating that the price will start to decrease and the MACD which is clearly indicating that the downtrend is not finished yet.
As possible targets, we can first consider 0.4708$ or 0.4600$ in extension.

IOTAUSDIOTA / USD
Can form a double bottom pattern
It will be necessary to monitor the support zone at $ 0.48
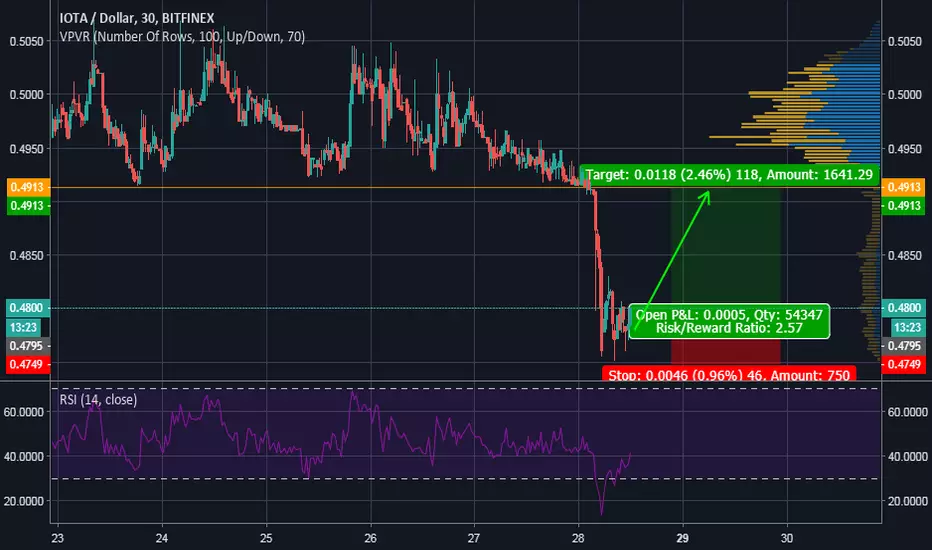
IOTA Return to MeanIota looks good for a play, target is 90c or so can SL under the low around 46c.
Zoomed out view.
See the divergence vs BTC

IOTA LongIota finally stopping the bleed from btc's recent move up.
Trend bleeding has stopped, and we are now entering accumulation until levels start to squeeze.

IOTUSD: Support and Triangle broken. Short.The 1D Descending Triangle broke on IOTA as the 0.4980 Support was crossed (RSI = 42.370, MACD = -0.025, Highs/Lows = -0.0164, B/BP = -0.0387). We have a Channel Down in its early stages and the commanding long term bearish trend on 1W (Highs/Lows = -0.0606, MACD = -0.309, RSI = 39.391) should sell every spike below 0.5800. We are still bearish on the long term with our TP = 0.3199, 0.1459 intact.

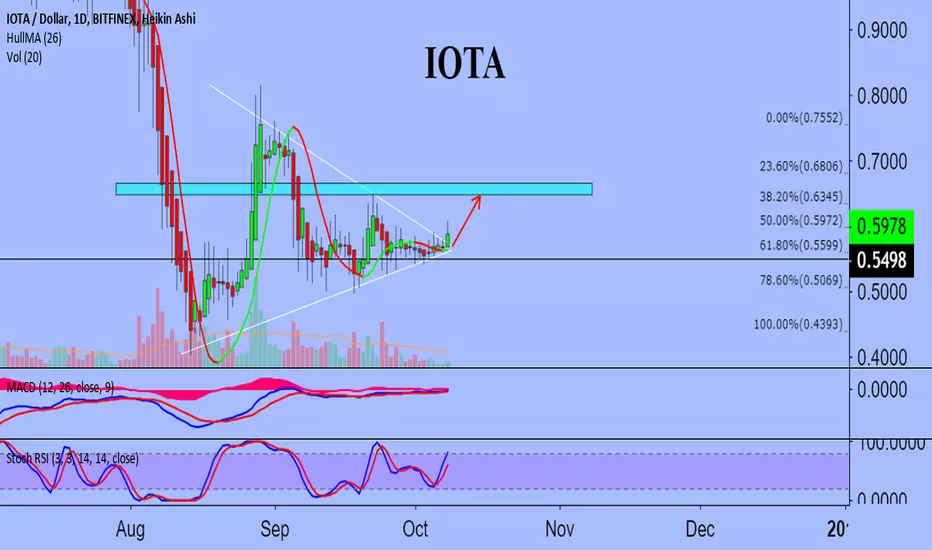
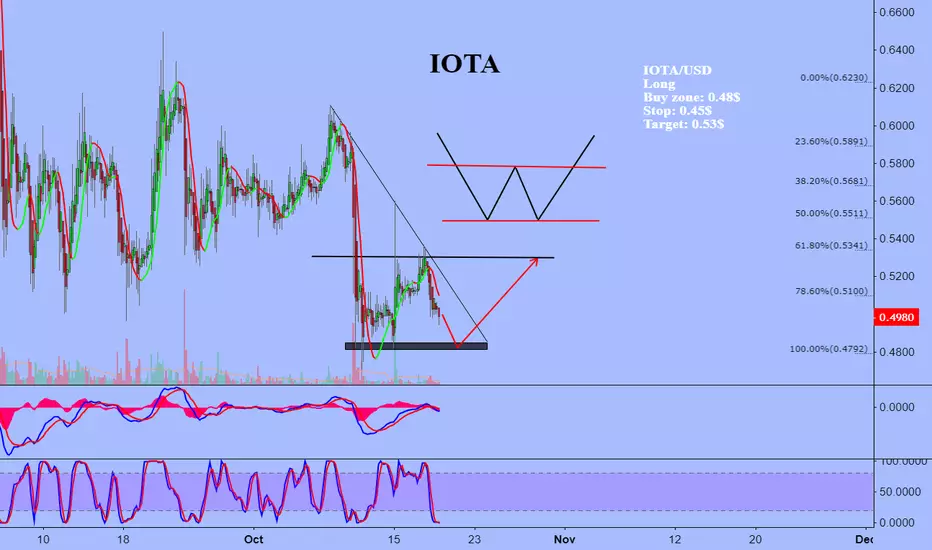
IOTAUSDIOT/USD
Broke symmetrical triangle up
The immediate goal is 0.64-0.65 $
Good zone for buy: 0.57 - 0.58$
Stop 0.55$