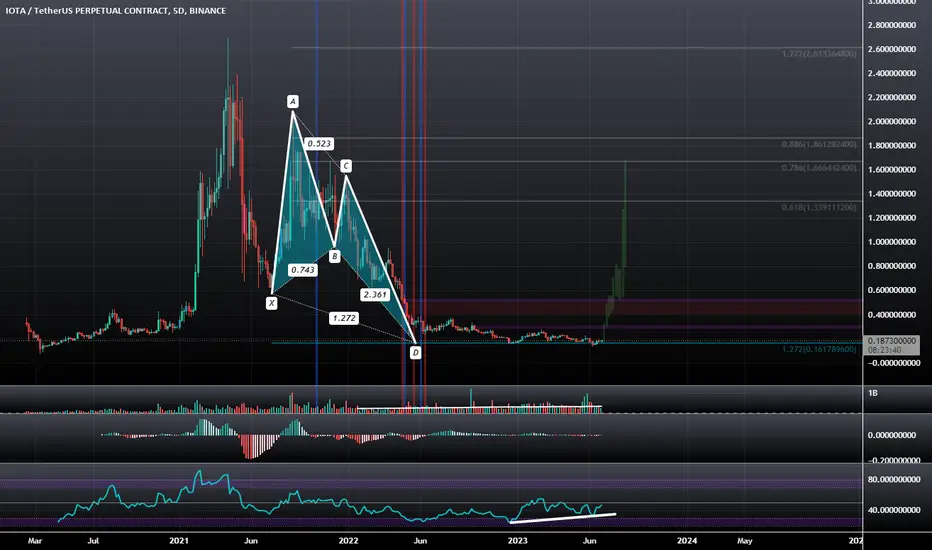
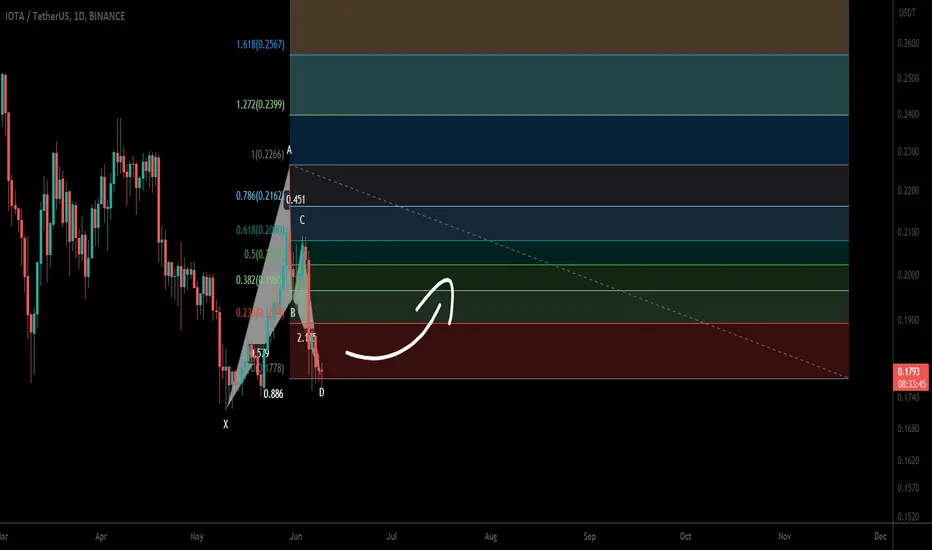
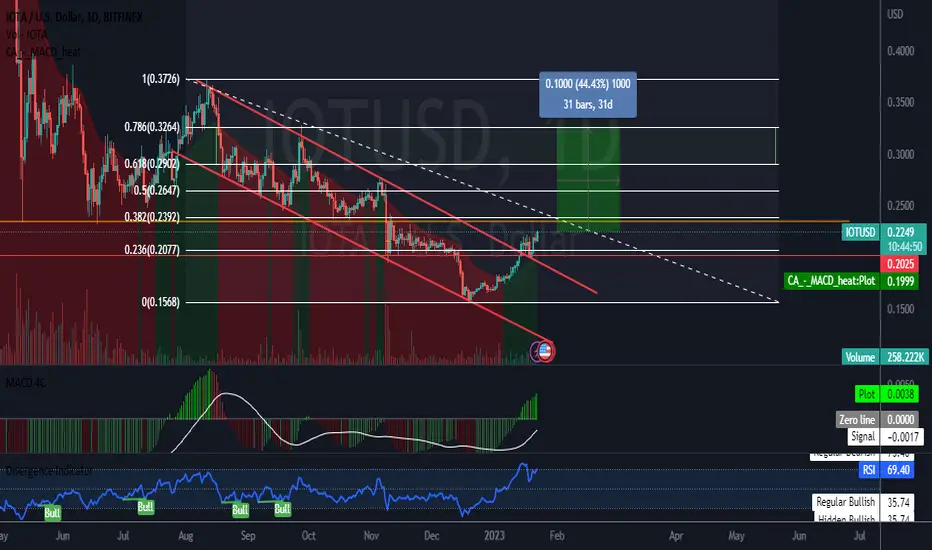
IOTA: Bullish Butterfly RSI Bullish Divergence (Final Fib Level)IOTA is currently sitting at the 1.272 PCZ of a Bullish Butterfly and this 1.272 extension happens to be the last positive Fibonacci Extension on the linear scale, meaning that this is probably the least risky area possible to buy IOTA and perhaps aim for much higher levels, even as high as 1–2 dollars.
Given how tight the entry and price action are, I think as long as it holds above 15 cents, we could see it go for some major Bullish targets.
Iotausd
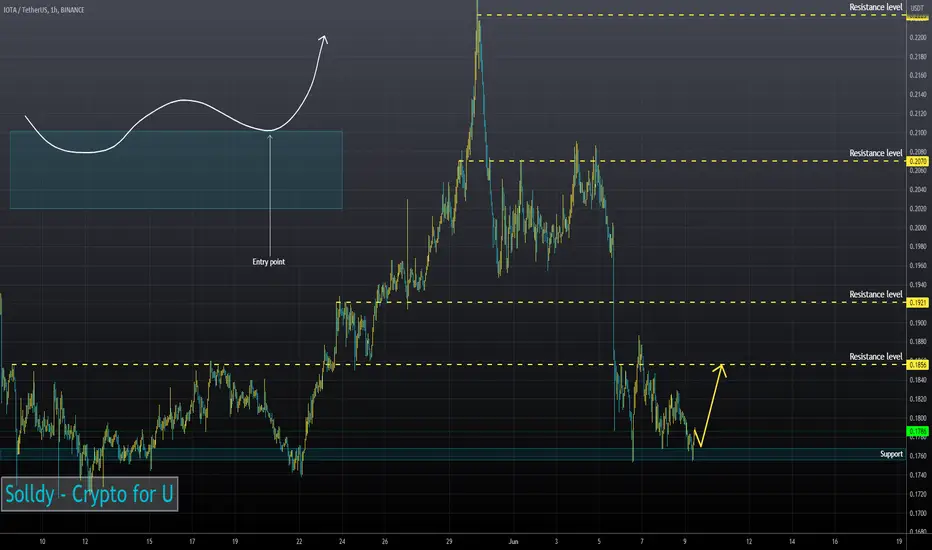
IOTAUSD ❕ uptrend50EMA broke up 200EMA on the 4H TF.
TD Sequential has formed an up reversal signal on the 4H TF.
The RSI chart is moving in a bullish zone on 4H, 1H and 30m TFs.
I believe that the asset will continue to rise after fixing above the resistance level.
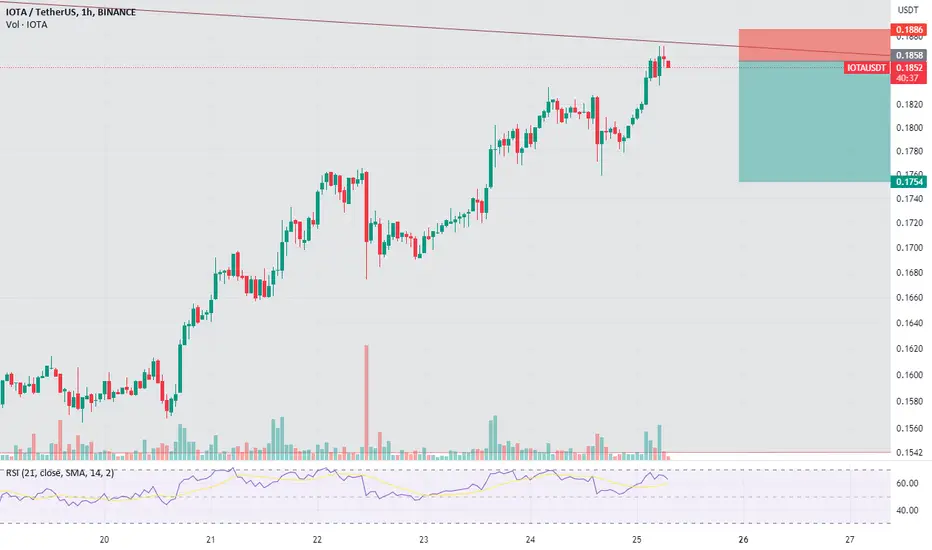
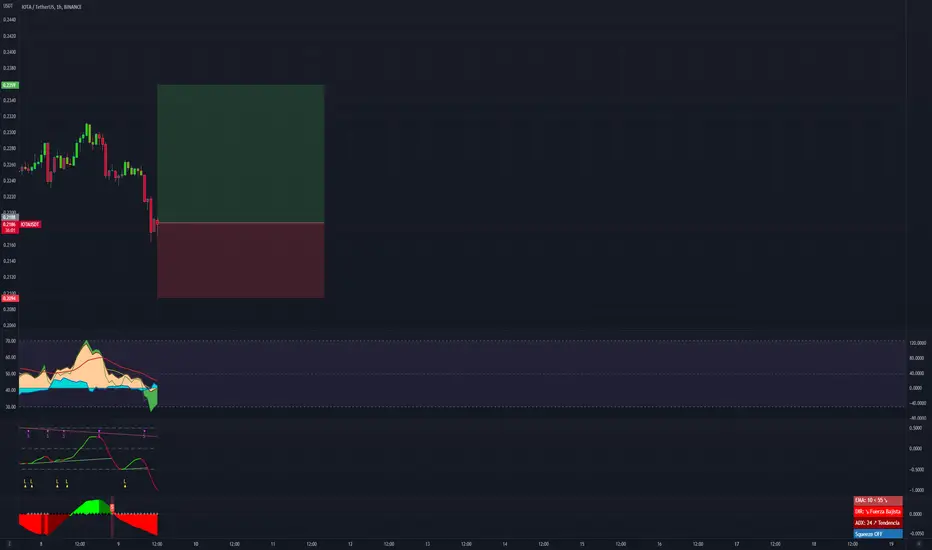
iotaBINANCE:IOTAUSDT is now reached to a dynamic red zone. and i think it will be reject from there now. lets see what,s doing now.
IOTA formed bullish BAT for upto 26% pumpHi dear friends, hope you are well, and welcome to the new update on IOTA (MIOTA) coin with USD pair.
Previously I shared a long-term trade setup of IOTA, which is still in play:
Now On daily time frame, IOTA has formed a bullish BAT move for another bullish reversal move.
Note: Above idea is for educational purpose only. It is advised to diversify and strictly follow the stop loss, and don't get stuck with trade.
IOTAUSD ❕ volume declinedTrading volumes declined as the asset began to test the support area.
I think IOTA could rebound if it fixes above the support area.
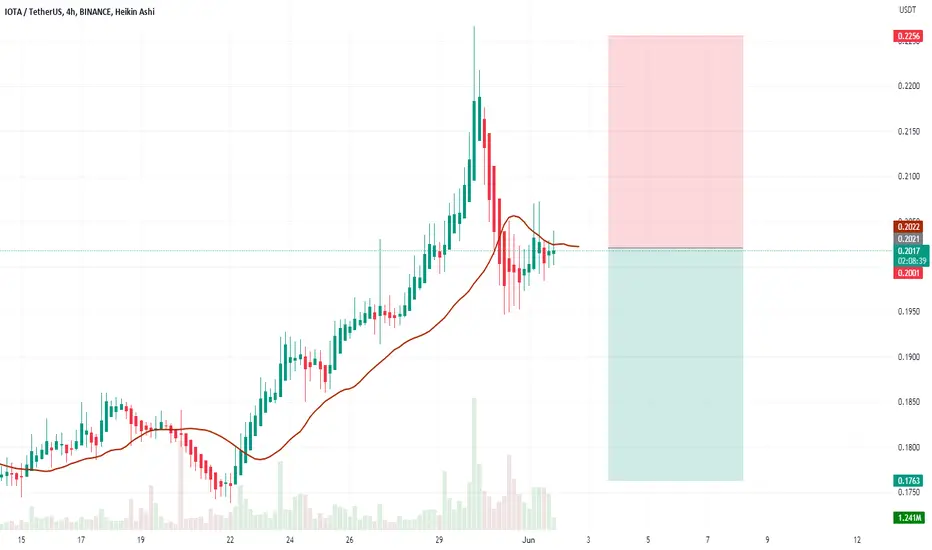
IOTUSD Sell TF H4. TP = 0.1763On the 4-hour chart the trend started on May 30 (linear regression channel).
There is a high probability of profit. A possible take profit level is 0.1763
But do not forget about SL = 0.2256
Using a trailing stop is also a good idea!
Please leave your feedback, your opinion. I am very interested. Thank you!
Good luck!
Regards, WeBelieveInTrading
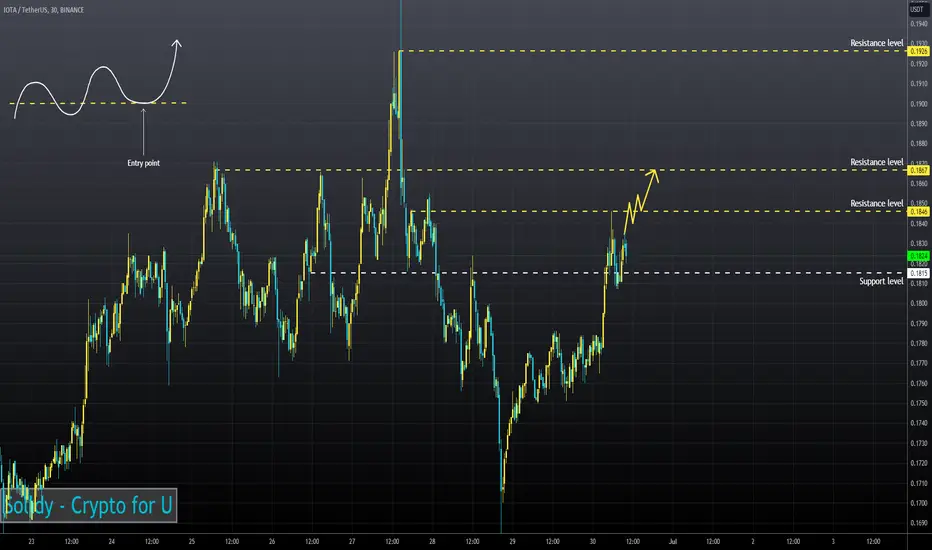
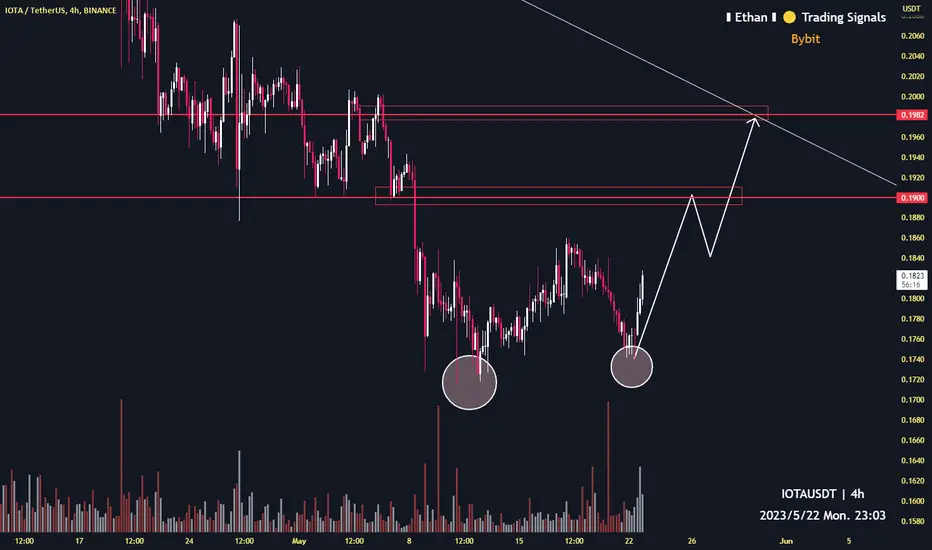
IOTA will potentially reach 0.1984h time frame
-
IOTA creating double bottom.
Notice the first resistance around 0.19
Final target is 0.1982
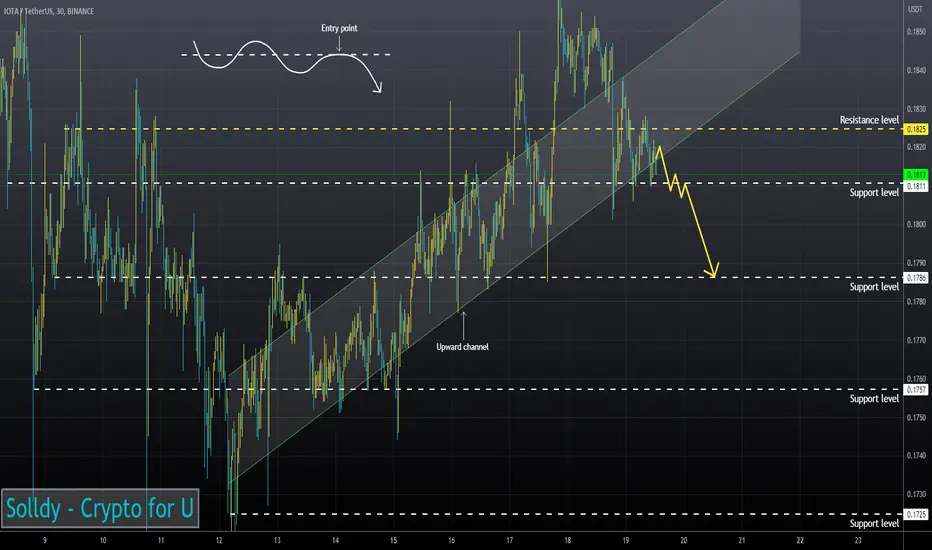
IOTAUSD ❕ broke down the channelThe RSI chart is moving in the bearish zone at 1H and 30m TFs.
I believe that after fixing under the support level, the price of the asset will continue to decline.
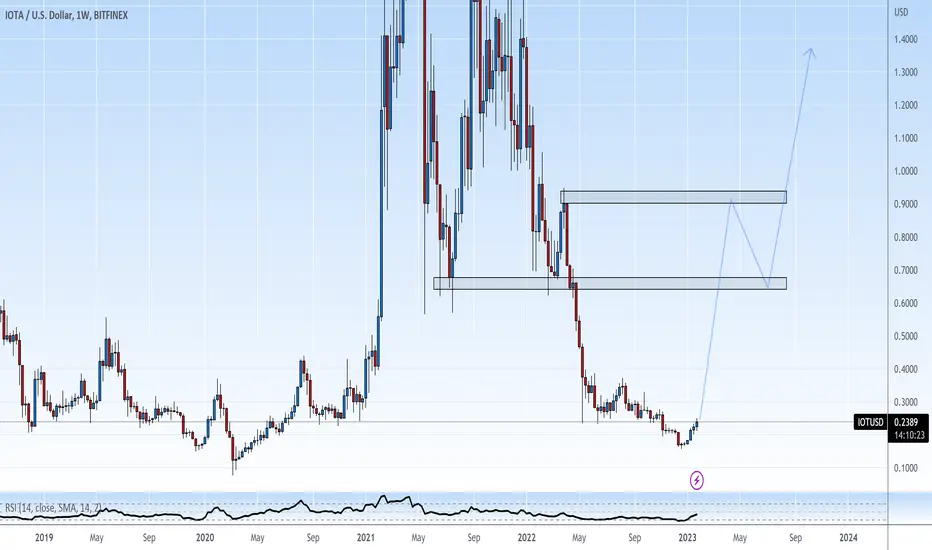
IOTA will reach $2 next yearDaily time frame
-
IOTA creating a symmetrical structure
Big possibility to see $2 from 2024/03 to 2024/07
Try to put it into your portfolio!

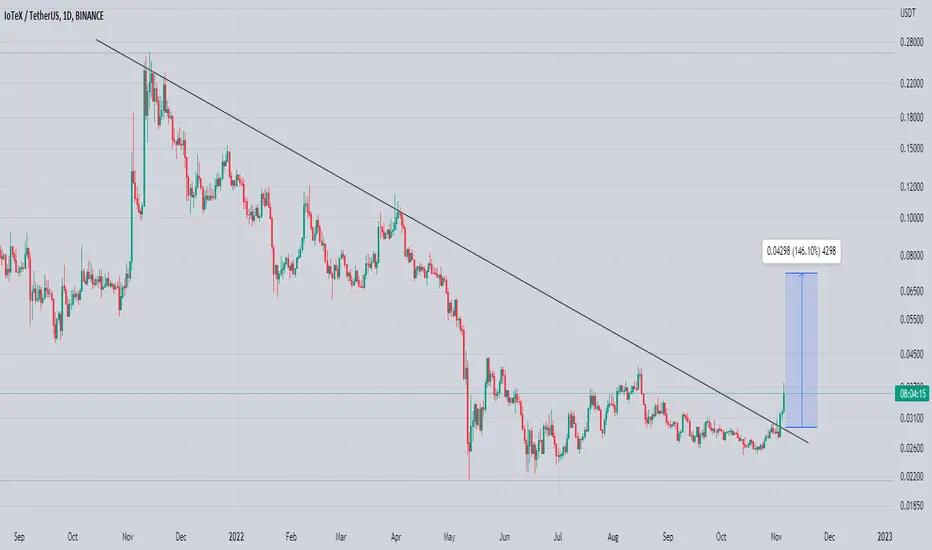
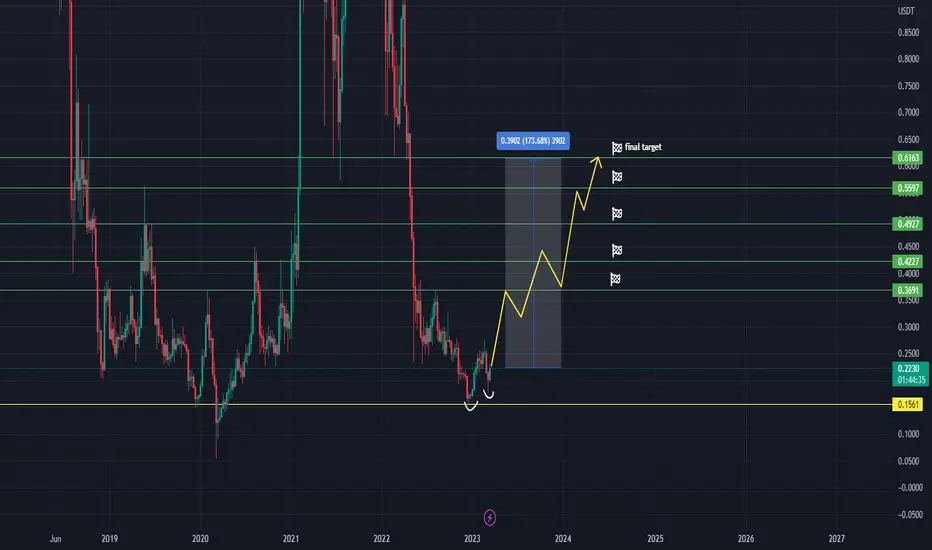
IOTAUSD still early (170% gains to be made)We believe that IOTA bottomed out and it's ready to start/continue the uptrend.
If you're patient, you can make even 170 % gains , however it will probably take many months. Take profit levels are shown on the chart.
Buying now for a mid-term or long-term trade/investment may be a good idea.
IOTA is still cheap and we believe that it's very undervalued.
Good luck
Get ready for a potential pump in IOTAUSDT!The chart is showing a promising sign with a decisive break above the downtrend trendline, followed by a successful support test at the top of the descending channel.
This could be the start of a bullish momentum to push the price higher.

IOTAGood breakout and retest.. targets on green. Last target is hard resistance if we pass it we might fly again..
Midterm trade.


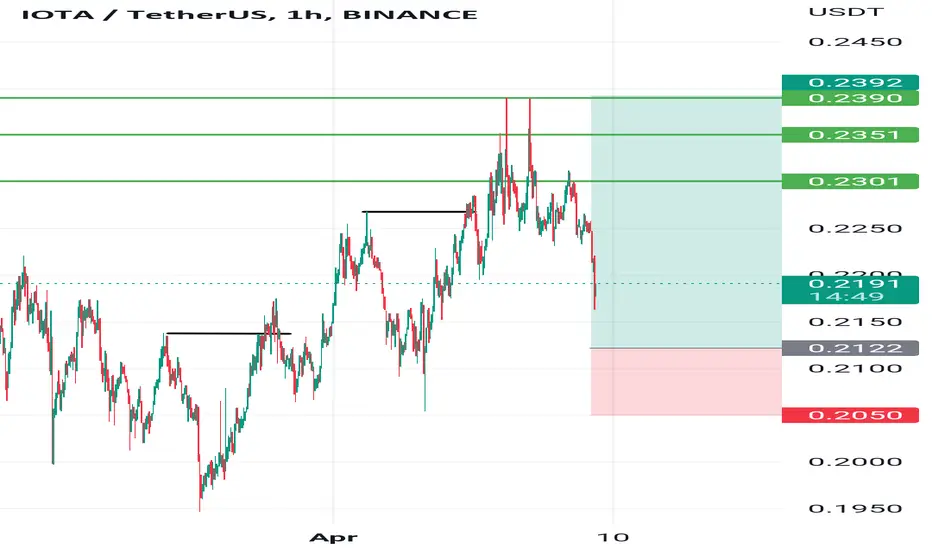
IOTAUSD - dumping and no surprise!IOTAUSD looks like XLMUSD that we just published:
Successful breakdown and beautiful follow through , very aggressive.
Expecting the price reaching the target soon.
Good luck!

Iota looking good to accumalateaccumulating iota at these prices
looking good here to start accumulating
if we break the falling wedge could see a nice move up

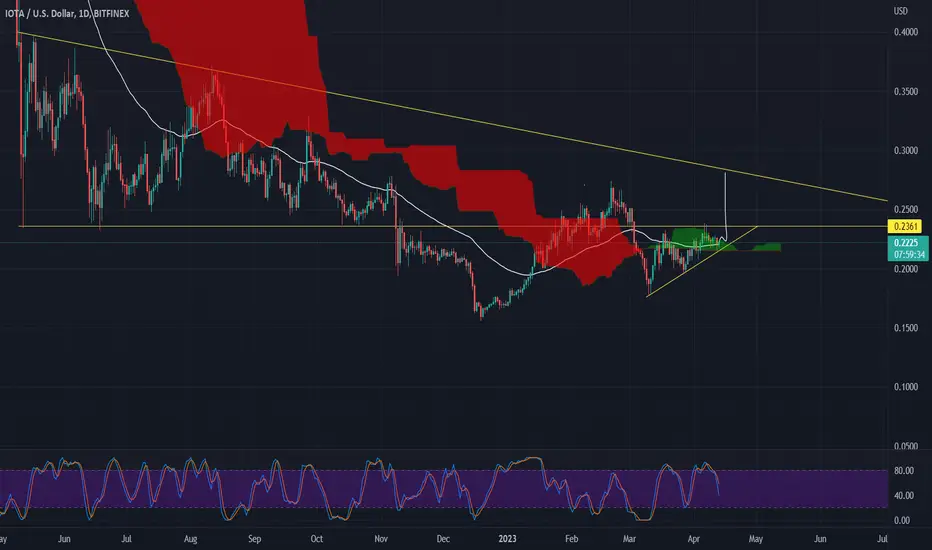
Monthly support!IOTA has seen little buying power over the past week, which has caused the currency to break its monthly support in the $0.226-$0.260 range. Now this area has become a serious resistance. Also, the support that was considered in the range of 0.195 to 0.180 dollars has been associated with a positive reaction. Considering the low volume of transactions, we cannot expect an upward trend yet.
The price of this currency can have a range trend for some time between the specified levels. Also, the range is completely clear in the 4-hour time frame of this trend. Therefore, the price should return above the $0.26 level for the trend to be bullish again. The nearest minor resistance is in the range of $0.237-$0.247, and hitting this range could be accompanied by a reaction. As you can see, the bearish trend is going on inside a bearish channel, and to get bullish, it is necessary to break the channel's midline and the mentioned resistances.


IOTX 125% PROFIT POTENTIALiotx moving as expected 30% profit just in 1 day
analysis was shared yesterday today running in 30% profit
this is you can earn by learning with patience and consistancy