IOTA/USDT – Major Breakout from Long-Term Downtrend!📊 Chart Overview
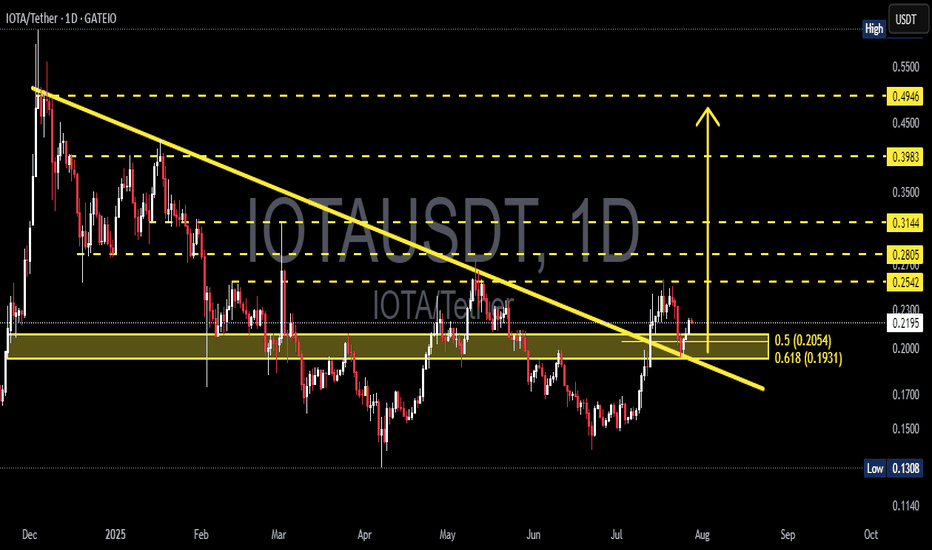
After spending several months under pressure within a long-term descending trendline since December 2024, IOTA has finally shown a highly promising technical signal. The recent breakout didn’t just pierce the trendline — it was confirmed by a successful retest of the golden Fibonacci zone, a classic reversal trigger in technical analysis.
> This is a classic early sign of a potential trend reversal, often followed by strong momentum plays.
---
🧠 Structure & Pattern: Signs of a Macro Reversal
✅ Descending Trendline Breakout
Price has broken through a major downtrend line that had held for over 7 months, signaling a shift in market dynamics from sellers to buyers.
✅ Fibonacci Golden Pocket Retest (0.5–0.618)
The pullback landed perfectly at the golden pocket (0.2054–0.1931), a highly watched confluence area for reversals. Price bounced right from this support, showing buy-side strength.
✅ Demand Zone Activation
The yellow box highlights a previous accumulation zone that now acts as strong demand, reinforcing the potential for an upward continuation.
---
🟢 Bullish Scenario (Structured Upside Potential)
If the price holds above 0.2054:
Short-Term Targets:
📈 0.2542 → Minor resistance & previous breakout area
📈 0.2805 → Key psychological zone and past rejection area
Mid–Long-Term Targets:
💰 0.3144 → Historical resistance
💰 0.3983 → Fibonacci extension zone
💰 0.4946 → Final major resistance before the previous macro downtrend
Confirmation:
A daily candle close above 0.2542 with increasing volume would strongly validate the bullish continuation.
---
🔴 Bearish Scenario (Potential Fakeout Risk)
If the price fails to hold above the 0.1931 zone:
⚠️ It may turn into a fake breakout, indicating that buyers weren’t strong enough to sustain the breakout.
Downside targets to watch:
🧱 0.1700 → Minor psychological support
🧱 0.1308 → Previous macro low and critical support
---
🎯 Conclusion & Trading Strategy
IOTA is currently at a critical decision point, balancing between a confirmed macro reversal and a possible fakeout. However, the technical breakout above a long-standing trendline — combined with a retest of the golden pocket zone — puts bulls in a favorable position for a potential rally.
🔍 What to watch next:
Price action above 0.2200–0.2540
Volume confirmation on breakout levels
This setup is ideal for early trend traders, swing traders, or position traders looking to ride a larger bullish wave with well-defined risk.
#IOTAUSDT #CryptoBreakout #MacroReversal #FibonacciSupport #BullishSetup #AltcoinAnalysis #CryptoTechnicalAnalysis #TrendlineBreak #BuyTheDip
IOTAUSDTPERP
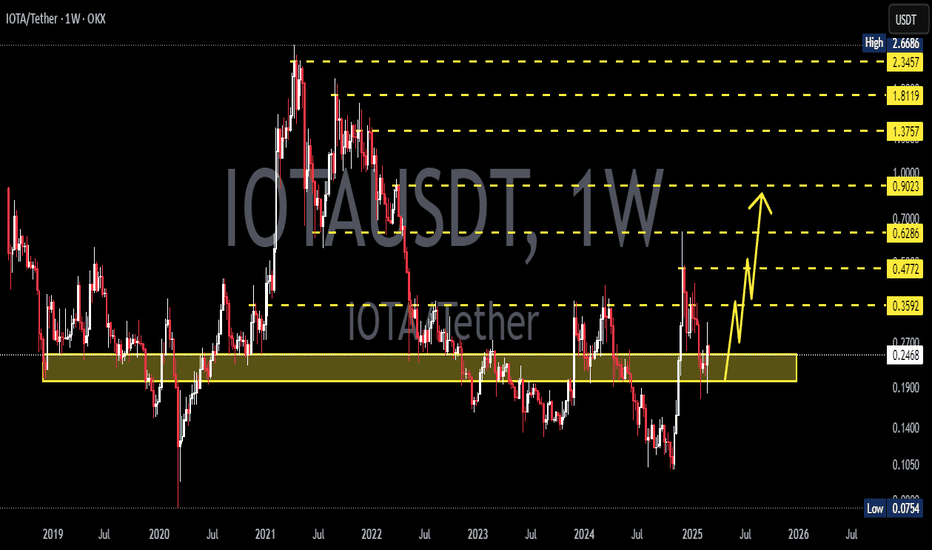
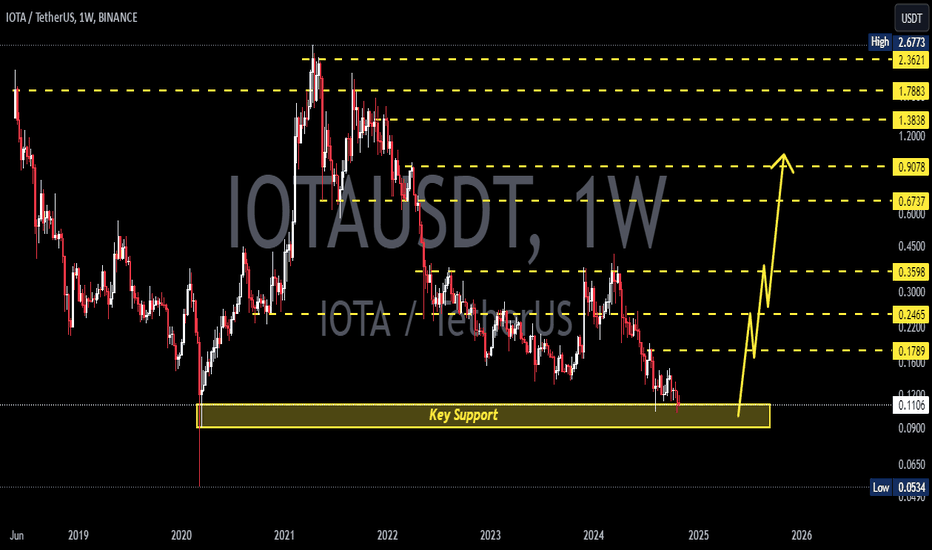
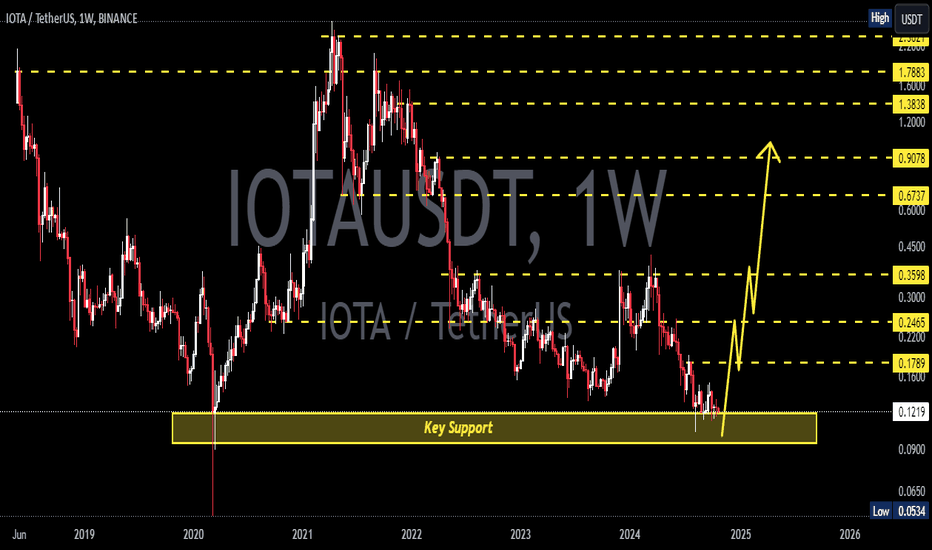
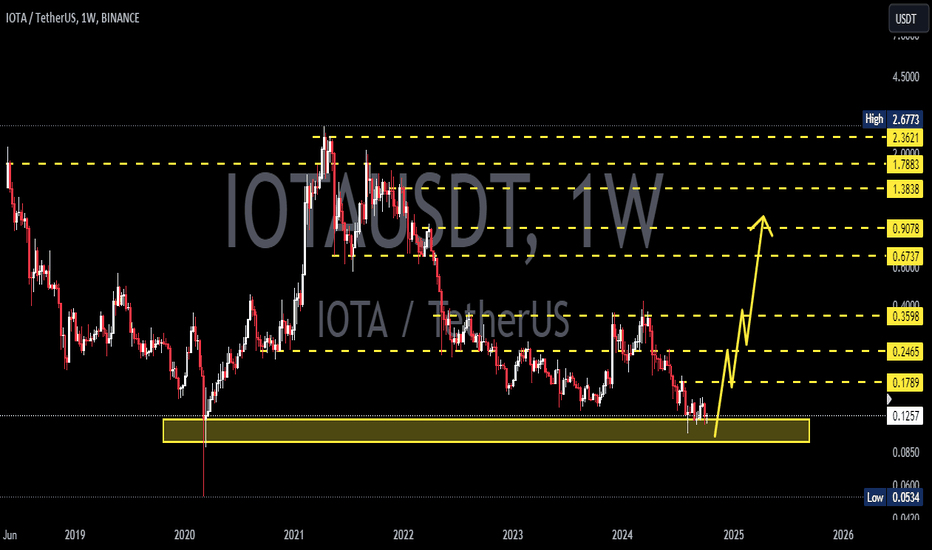
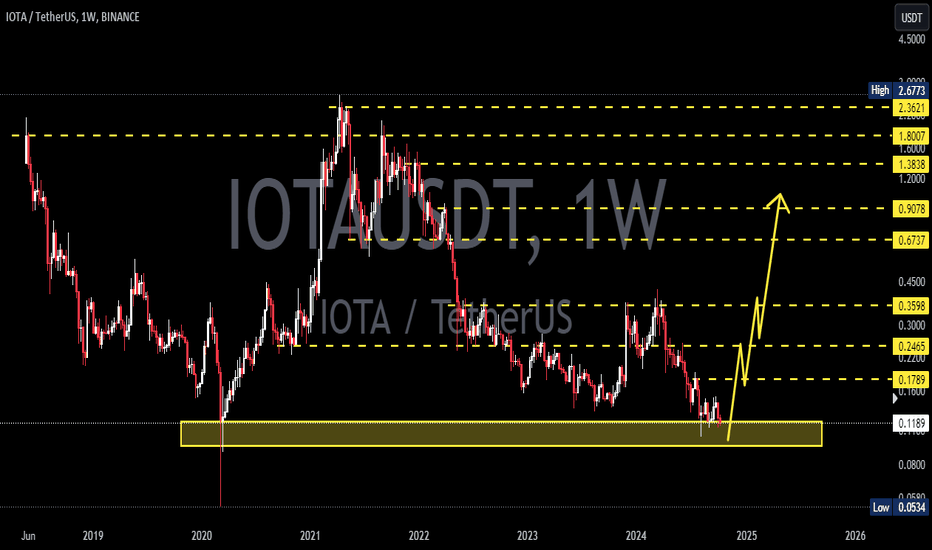
IOTA/USDT Weekly Analysis – Critical Support Retest
📊 Pattern & Price Structure:
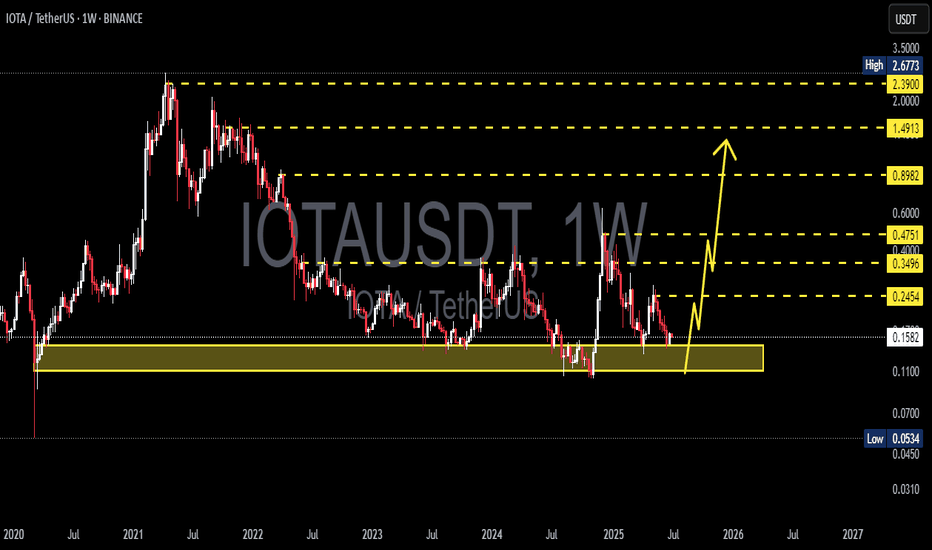
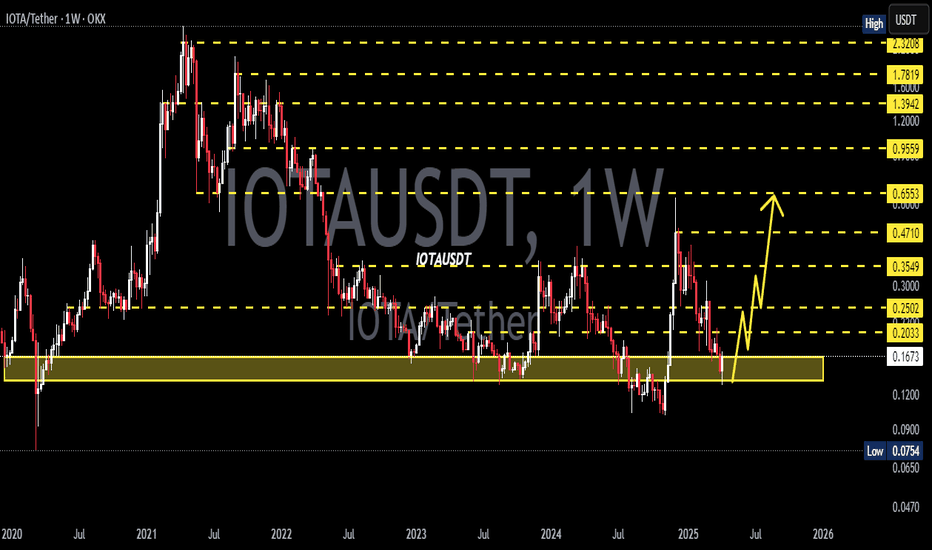
The chart indicates that IOTA is currently retesting a major historical demand zone in the range of $0.110 – $0.160, which has served as a strong support since 2020. The price has bounced off this area multiple times in the past, reinforcing it as a solid accumulation zone.
There is also a potential formation of a double bottom or accumulation range around this level, which often acts as the foundation for a major reversal if accompanied by volume and momentum.
🟢 Bullish Scenario:
If this support holds and buyers show strength:
1. The price could rebound and test key resistance levels:
$0.2454 (initial resistance)
$0.3496
$0.4000
$0.4751
2. A breakout beyond those levels may trigger further upside targets at:
$0.8982 (weekly key resistance)
$1.4913
$2.000
$2.390 and potentially even $2.677
3. Bullish catalysts such as positive fundamental news, rising market sentiment, or visible accumulation volume could spark an explosive move.
🔴 Bearish Scenario:
If the price fails to hold the $0.110 – $0.160 support zone:
1. A breakdown could lead to a decline toward previous extreme lows around:
$0.0700 – $0.0534
2. This would signal a loss of long-term buyer interest and open the door to deeper bearish continuation.
⚠️ Technical Conclusion:
The yellow zone is a make-or-break level — bulls must defend this to maintain any bullish structure.
As long as IOTA stays above $0.110, the risk-reward favors a bullish reversal.
A confirmed bullish weekly candle and volume spike would strengthen the bullish outlook.
📌 Key Levels:
Major Support Zone: $0.110 – $0.160
Resistance Levels to Watch:
$0.2454 → $0.3496 → $0.4000 → $0.4751 → $0.8982 → $1.4913 → $2.000 → $2.390 → $2.677
#IOTA #IOTAUSDT #CryptoAnalysis #AltcoinBreakout #TechnicalAnalysis #BullishReversal #CryptoSetup #SupportAndResistance
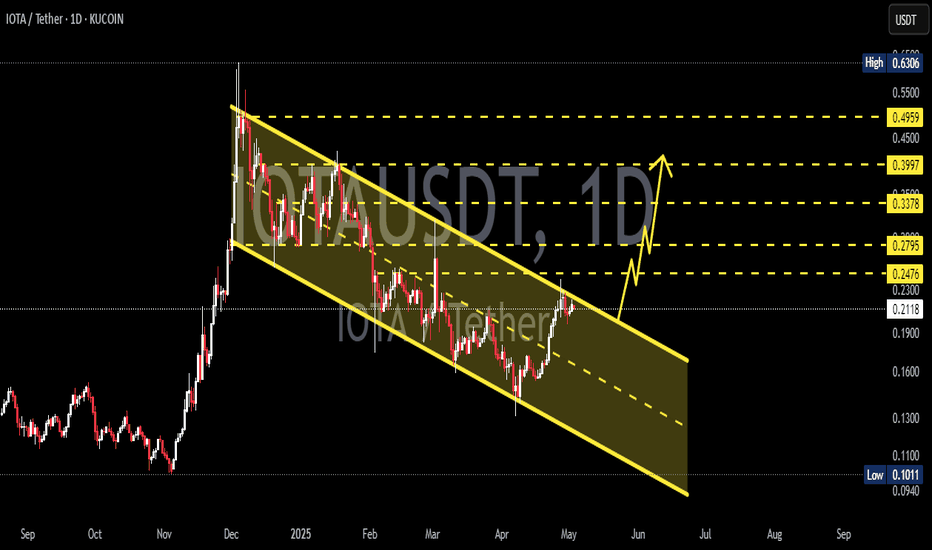
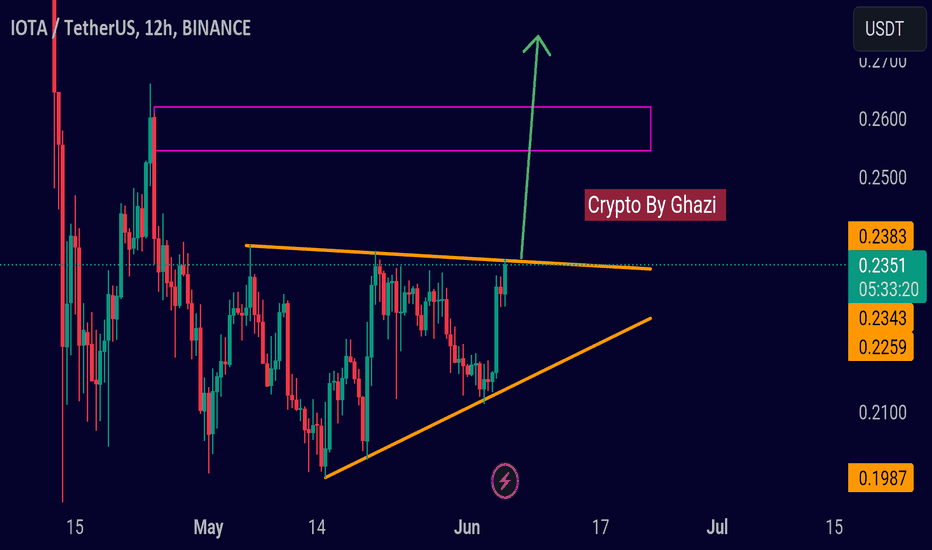
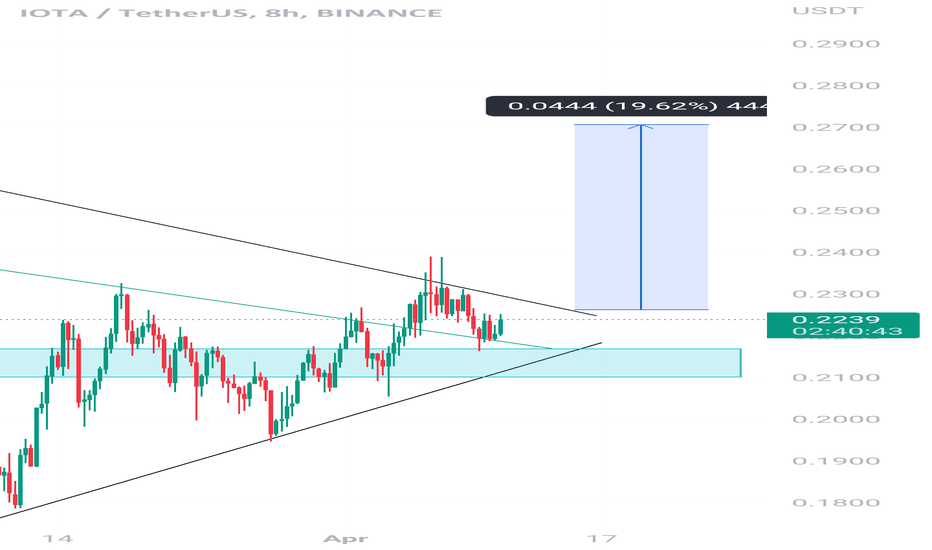
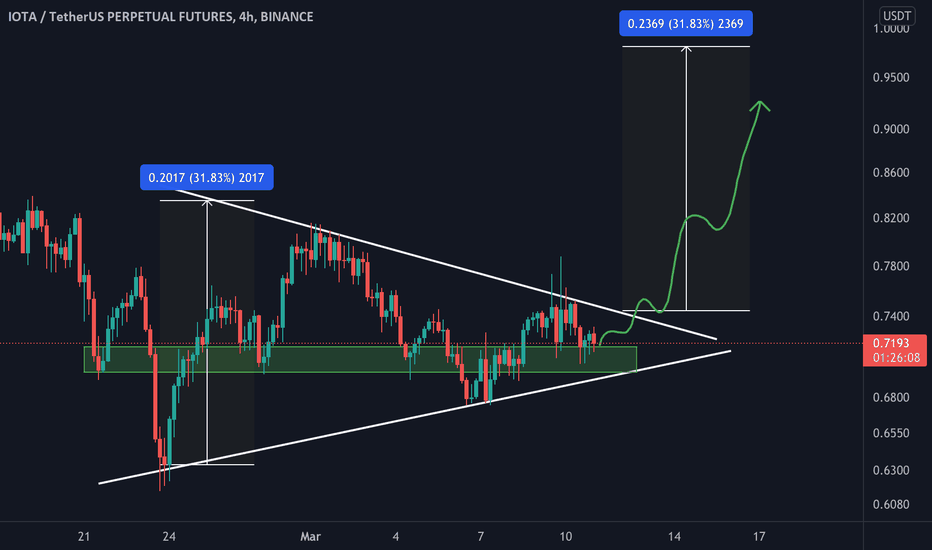
Iota/Usdt On The Verge Of BreakoutIota/USDT appears to be exhibiting strength in the short term. All that is required now is to wait for a breakout of this pattern. In the event of a successful breakout, a 15-30% bullish move can be anticipated. It is important to note that this is not financial advice; please conduct your own research (DYOR).
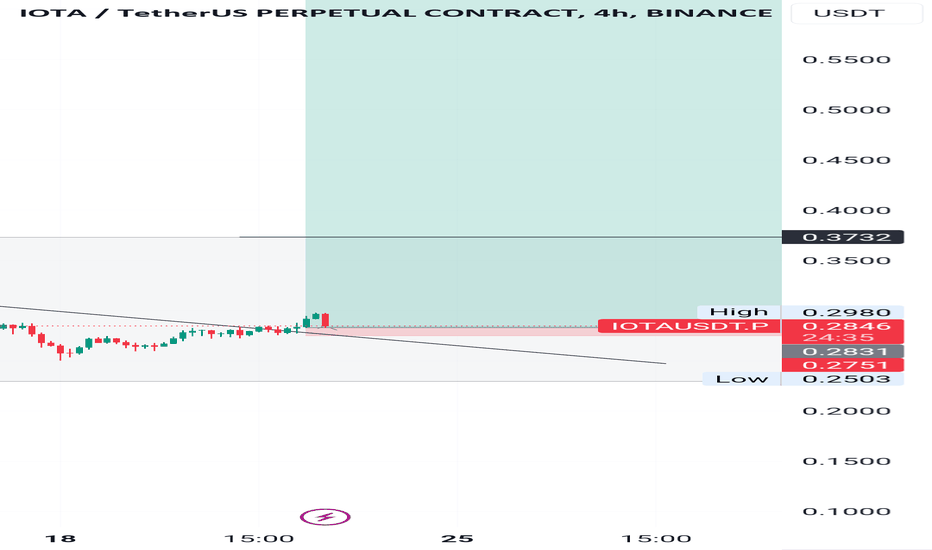
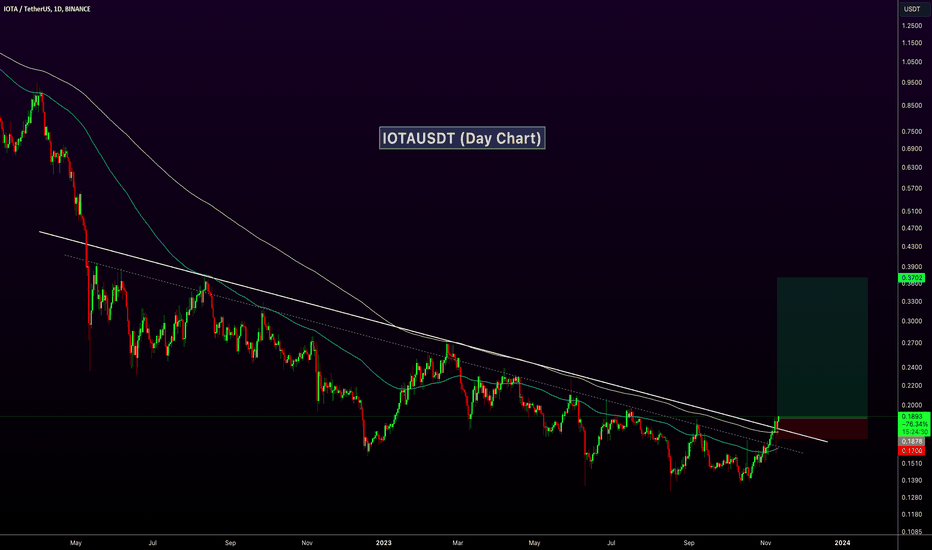
IOTA Possible Long Scenario IOTAusdt here looks interesting i think it can push higher from here.
Longing here 2800-2850
Stoploss very tight at 2750
High risk but if RR is very solid from here if it holds here.
Can be switched to swing long too later.
Initial target marked 0.3700
DYOR
Note: Not a Financial Advice.
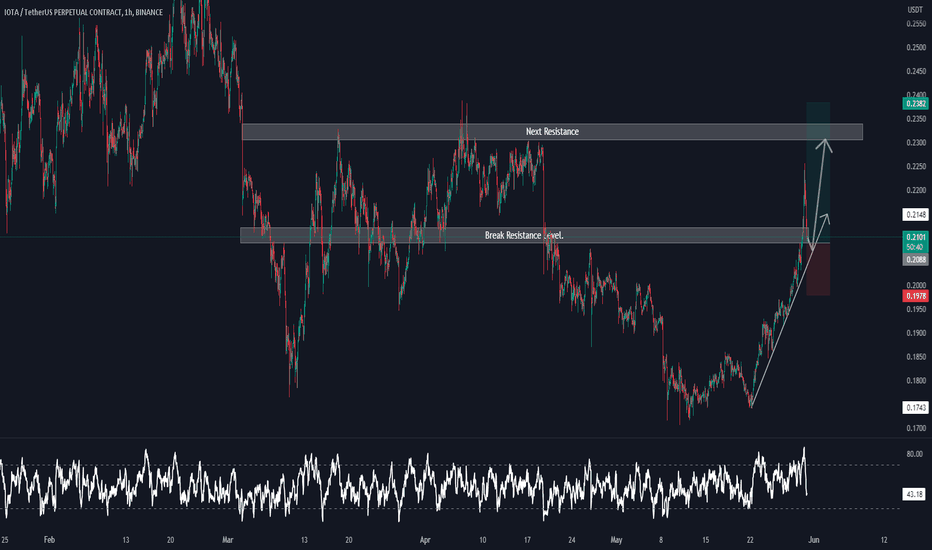
IOTA Long Setup 1 HR TFBINANCE:IOTAUSDT.P Long Setup: The price has now retested the previous level. This is a bullish sign, as it suggests that the price is ready to continue its uptrend. This suggests that the bulls are still in control and that the price is ready to continue its uptrend.
Entry Price and SL mentioned.
Iotausdt Most Probably IOAUSDT
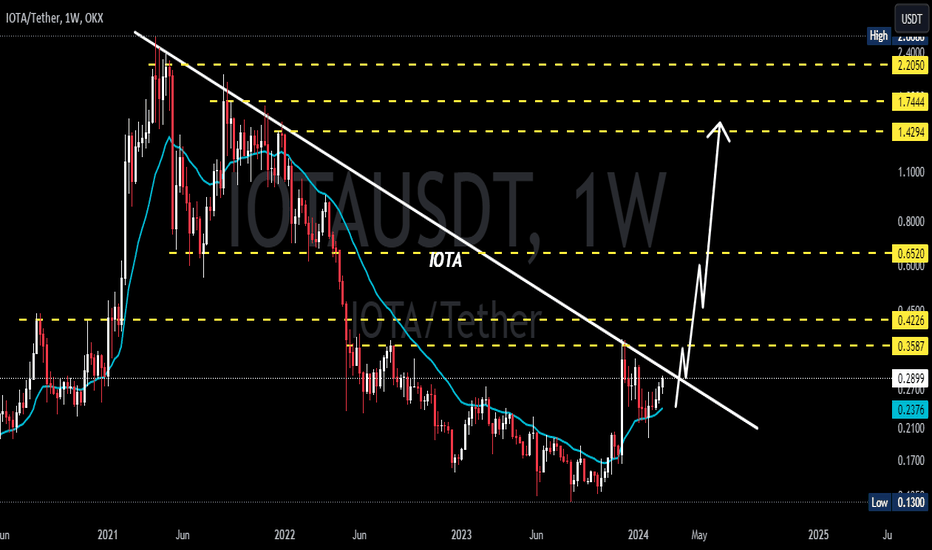
has recently confirmed the trendline resistance breakout and retest, and a symmetrical bullish pattern has emerged on the 8-hour timeframe. This pattern indicates a potential bullish move to the upside if a successful breakout occurs.
It is recommended to wait for confirmation of the breakout before taking any positions. Proper risk management is important to avoid losses in case of a false breakout or a sudden market reversal. If the breakout is successful, the price is likely to move 30-50% higher from the breakout level. Traders should keep a close eye on the price action and adjust their positions accordingly.
If You Are Satisfied With Our Work Join us
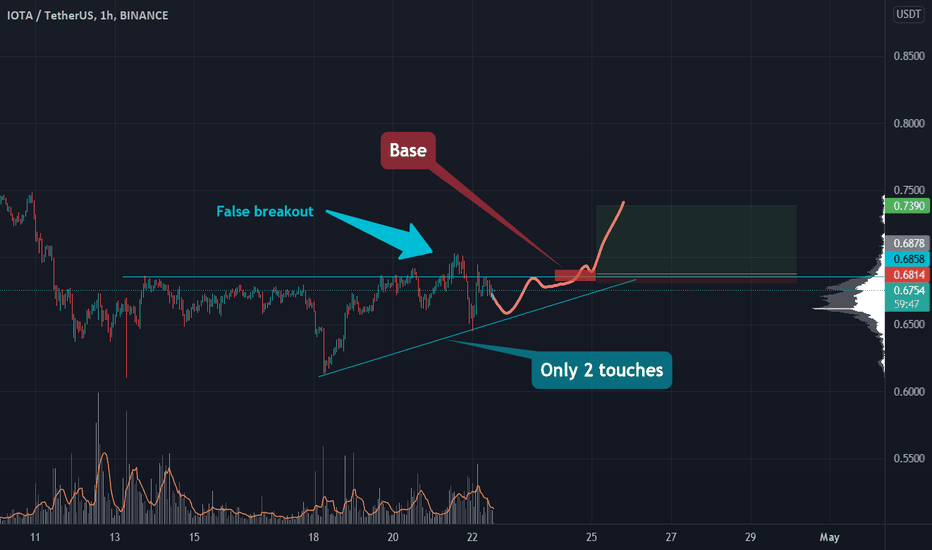
IOTA - In case BTC will be bullish..BTC direction is uncertain, so use only half of usual volume.
- Level is clearly visible
- Multiple touches
- False breakout
- With only two touches of support chances of breaking down are slim. Will break down only if BTC goes that way
- Will enter when price squeezes to the level on lower timeframes, the base will form and the strip will get faster.
What do you think of this idea? What is your opinion? Share it in the comments📄🖌
If you like the idea, please give it a like. This is the best "Thank you!" for the author 😊
P.S. Always do your own analysis before a trade. Put a stop loss. Fix profit in parts. Withdraw profits in fiat and reward yourself and your loved ones
IOTA/USDT WILL BE PUMPED Hi guys, This is CryptoMojo, One of the most active trading view authors and fastest-growing communities.
Do consider following me for the latest updates and Long /Short calls on almost every exchange.
I post short mid and long-term trade setups too.
Let’s get to the chart!
I have tried my best to bring the best possible outcome in this chart, Do not consider it as an
IOTA/USDT is making the symmetrical triangle pattern.
Entry: CMP and more add above $0.0712
Targets: 25% to 30%
LEVERAGE: 5X TO 10X
Stop Loss: $0.7
This chart is likely to help you in making better trade decisions, if it did do consider upvoting this chart.
Would also love to know your charts and views in the comment section.
Thank you
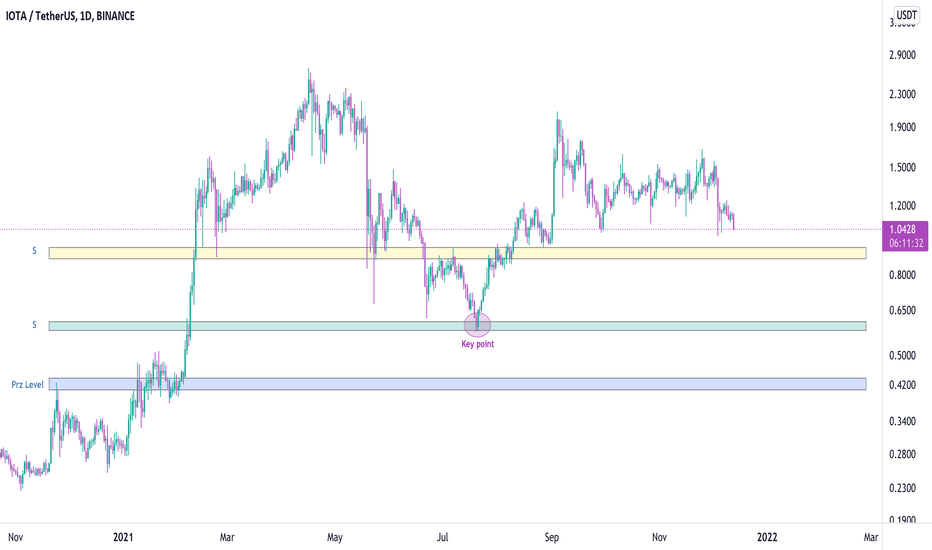
IOTAUSDT, We are going toward support zone areaHello everybody
According to the chart you can see the the price is in correction-downward trend and we have 2 scenario that can be happen, one of them is we are made AB of elliott correction and now we are ready to making C of the correction ABC or another theory is we finish the ABC correction and we made wave 1 and we are in coorection 2 of the first wave , the 2nd scenario is more valid than the others because its not attractive that the price drop more to prz level and its not good because if the 1st theory want to happen the btc should dump more to 30K and at this time its not happen
According to the chart the both of the support (S) zone area its good to buy in 2 step and reduce average purchase and wait until the target reach.
We will update targets in future
Good Luck
Abtin
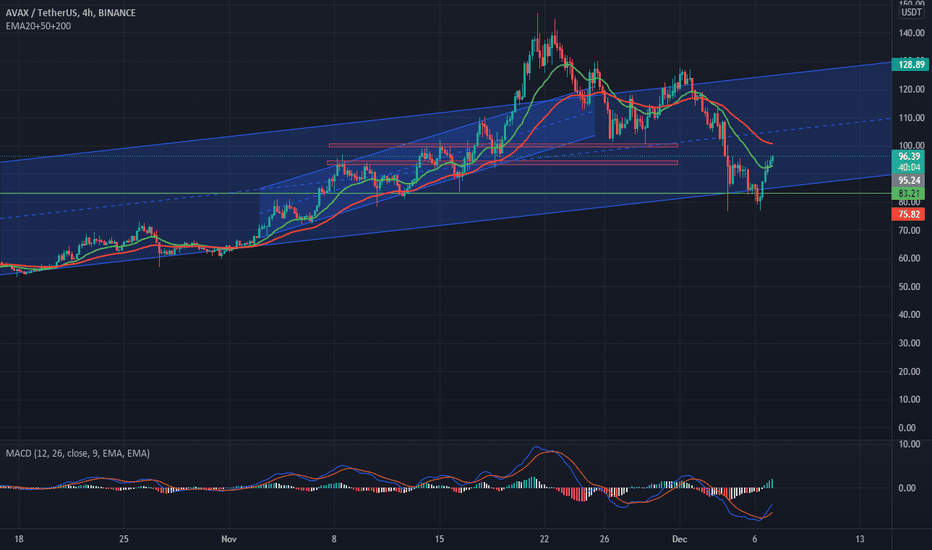
IOTA/USDT bullishWell, this seems like a very less ideal trade to take, the risk reward is below average (rr 1:3)
Iota has been on a very nice uptrend Support with potential 36% rise to the top again.
to lower the risk due to btc uncertainty in the market, we can wait and let price fall back to 83.21 before taking a position..
For those considering a futures trade on IOTA/USDT.
High recommend staying within the range of 2x to 5x nothing more nothing less
