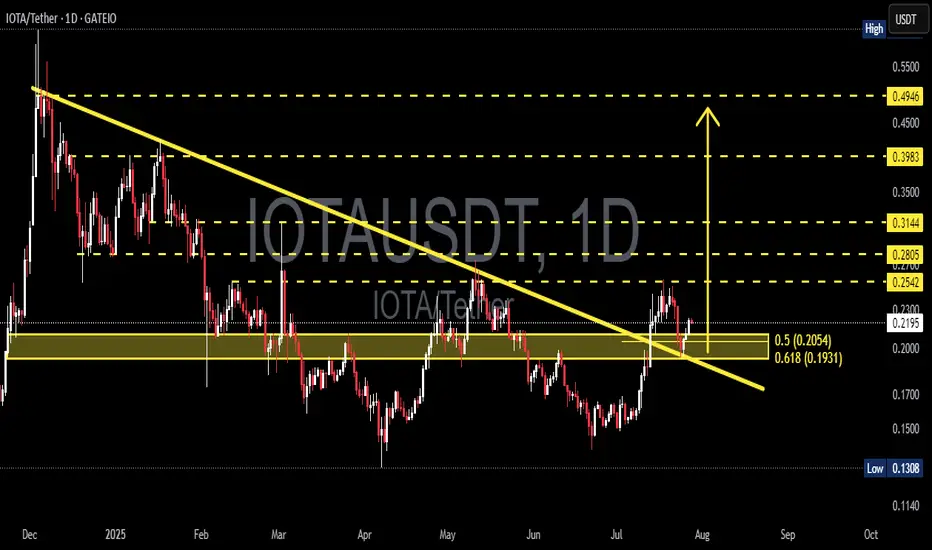
IOTA/USDT – Major Breakout from Long-Term Downtrend!📊 Chart Overview
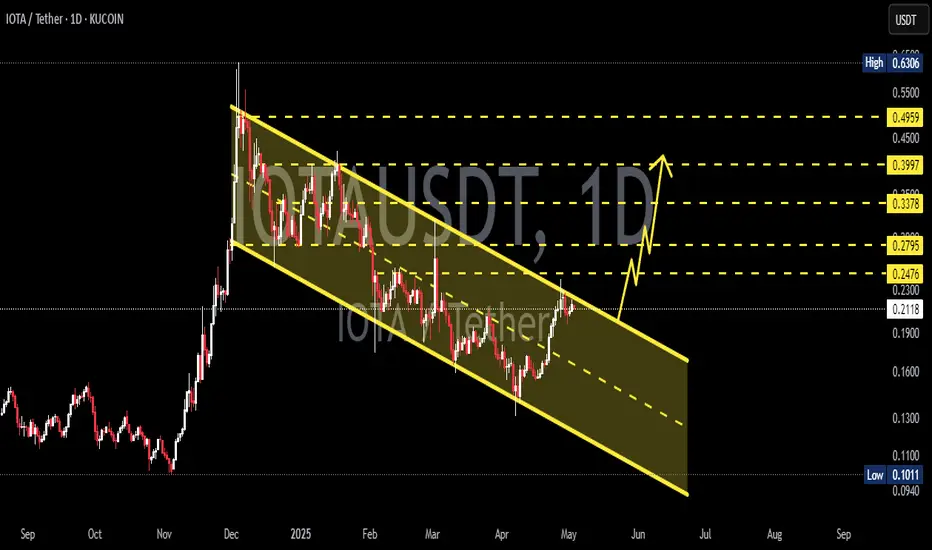
After spending several months under pressure within a long-term descending trendline since December 2024, IOTA has finally shown a highly promising technical signal. The recent breakout didn’t just pierce the trendline — it was confirmed by a successful retest of the golden Fibonacci zone, a classic reversal trigger in technical analysis.
> This is a classic early sign of a potential trend reversal, often followed by strong momentum plays.
---
🧠 Structure & Pattern: Signs of a Macro Reversal
✅ Descending Trendline Breakout
Price has broken through a major downtrend line that had held for over 7 months, signaling a shift in market dynamics from sellers to buyers.
✅ Fibonacci Golden Pocket Retest (0.5–0.618)
The pullback landed perfectly at the golden pocket (0.2054–0.1931), a highly watched confluence area for reversals. Price bounced right from this support, showing buy-side strength.
✅ Demand Zone Activation
The yellow box highlights a previous accumulation zone that now acts as strong demand, reinforcing the potential for an upward continuation.
---
🟢 Bullish Scenario (Structured Upside Potential)
If the price holds above 0.2054:
Short-Term Targets:
📈 0.2542 → Minor resistance & previous breakout area
📈 0.2805 → Key psychological zone and past rejection area
Mid–Long-Term Targets:
💰 0.3144 → Historical resistance
💰 0.3983 → Fibonacci extension zone
💰 0.4946 → Final major resistance before the previous macro downtrend
Confirmation:
A daily candle close above 0.2542 with increasing volume would strongly validate the bullish continuation.
---
🔴 Bearish Scenario (Potential Fakeout Risk)
If the price fails to hold above the 0.1931 zone:
⚠️ It may turn into a fake breakout, indicating that buyers weren’t strong enough to sustain the breakout.
Downside targets to watch:
🧱 0.1700 → Minor psychological support
🧱 0.1308 → Previous macro low and critical support
---
🎯 Conclusion & Trading Strategy
IOTA is currently at a critical decision point, balancing between a confirmed macro reversal and a possible fakeout. However, the technical breakout above a long-standing trendline — combined with a retest of the golden pocket zone — puts bulls in a favorable position for a potential rally.
🔍 What to watch next:
Price action above 0.2200–0.2540
Volume confirmation on breakout levels
This setup is ideal for early trend traders, swing traders, or position traders looking to ride a larger bullish wave with well-defined risk.
#IOTAUSDT #CryptoBreakout #MacroReversal #FibonacciSupport #BullishSetup #AltcoinAnalysis #CryptoTechnicalAnalysis #TrendlineBreak #BuyTheDip
Iotausdtsignal
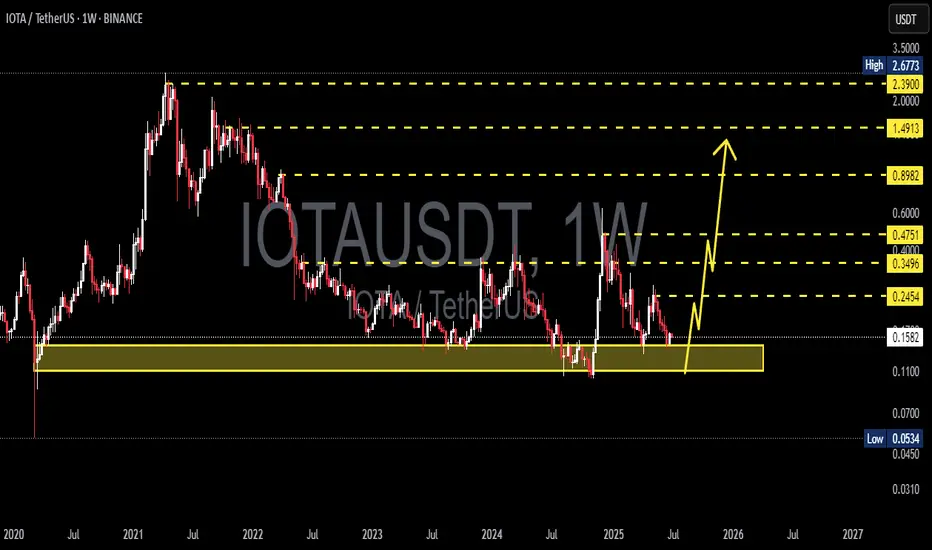
IOTA/USDT Weekly Analysis – Critical Support Retest
📊 Pattern & Price Structure:
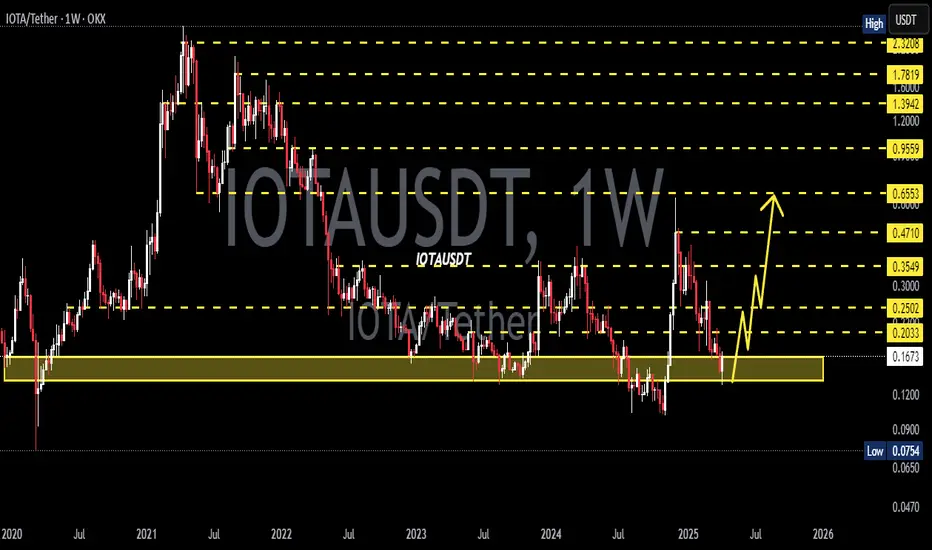
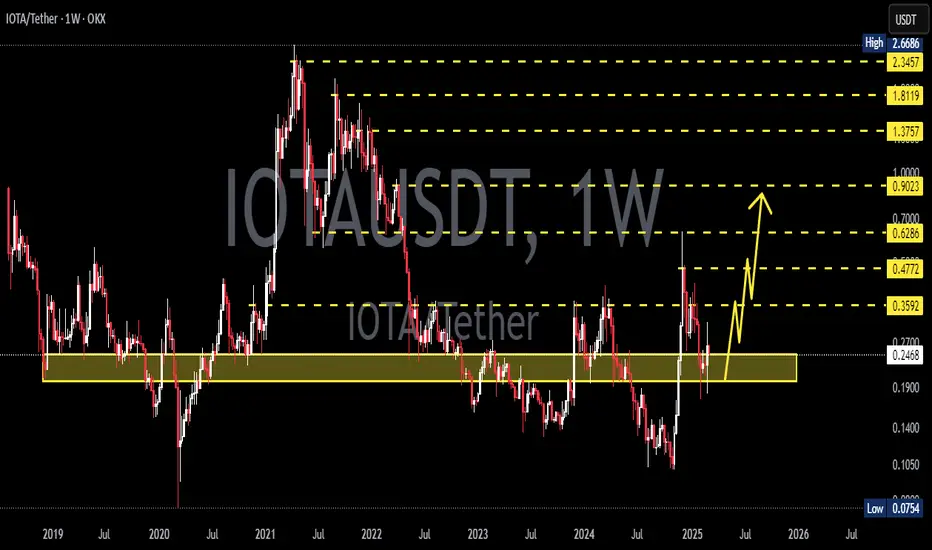
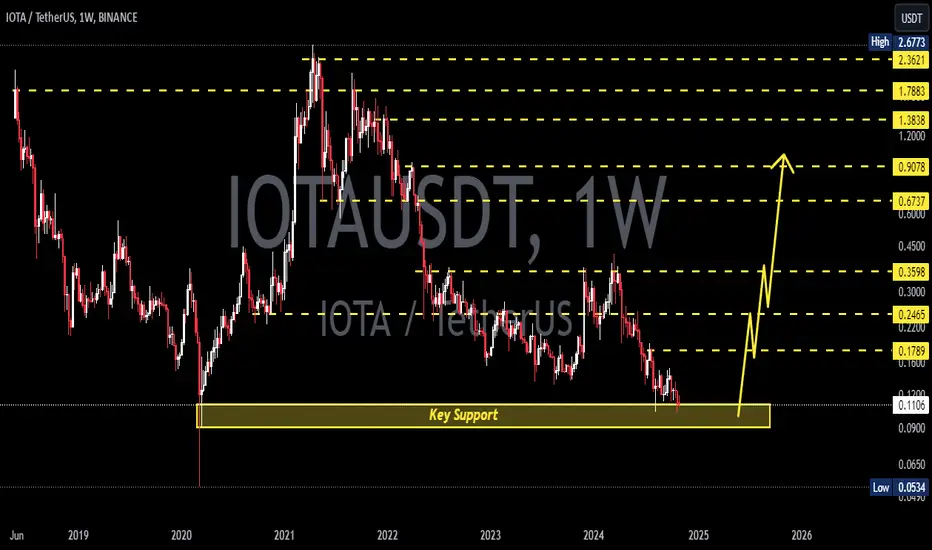
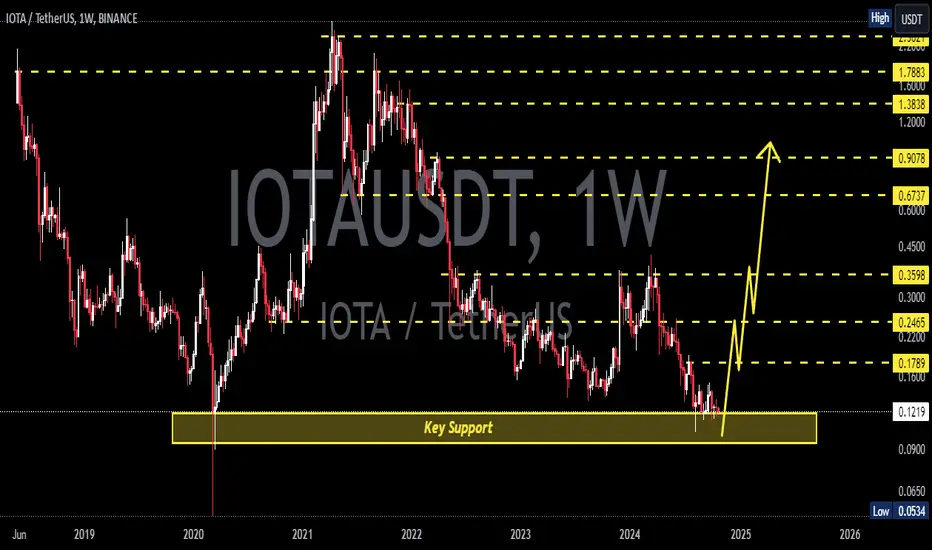
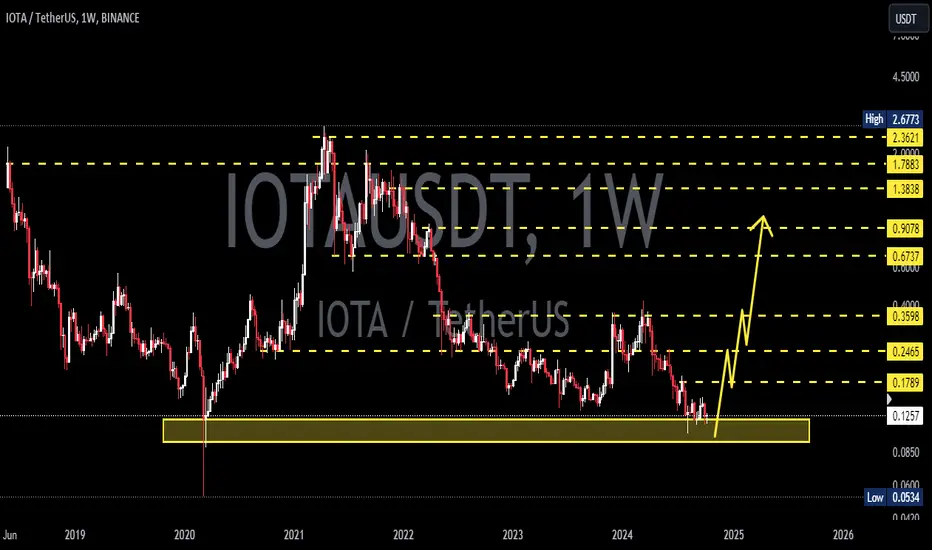
The chart indicates that IOTA is currently retesting a major historical demand zone in the range of $0.110 – $0.160, which has served as a strong support since 2020. The price has bounced off this area multiple times in the past, reinforcing it as a solid accumulation zone.
There is also a potential formation of a double bottom or accumulation range around this level, which often acts as the foundation for a major reversal if accompanied by volume and momentum.
🟢 Bullish Scenario:
If this support holds and buyers show strength:
1. The price could rebound and test key resistance levels:
$0.2454 (initial resistance)
$0.3496
$0.4000
$0.4751
2. A breakout beyond those levels may trigger further upside targets at:
$0.8982 (weekly key resistance)
$1.4913
$2.000
$2.390 and potentially even $2.677
3. Bullish catalysts such as positive fundamental news, rising market sentiment, or visible accumulation volume could spark an explosive move.
🔴 Bearish Scenario:
If the price fails to hold the $0.110 – $0.160 support zone:
1. A breakdown could lead to a decline toward previous extreme lows around:
$0.0700 – $0.0534
2. This would signal a loss of long-term buyer interest and open the door to deeper bearish continuation.
⚠️ Technical Conclusion:
The yellow zone is a make-or-break level — bulls must defend this to maintain any bullish structure.
As long as IOTA stays above $0.110, the risk-reward favors a bullish reversal.
A confirmed bullish weekly candle and volume spike would strengthen the bullish outlook.
📌 Key Levels:
Major Support Zone: $0.110 – $0.160
Resistance Levels to Watch:
$0.2454 → $0.3496 → $0.4000 → $0.4751 → $0.8982 → $1.4913 → $2.000 → $2.390 → $2.677
#IOTA #IOTAUSDT #CryptoAnalysis #AltcoinBreakout #TechnicalAnalysis #BullishReversal #CryptoSetup #SupportAndResistance
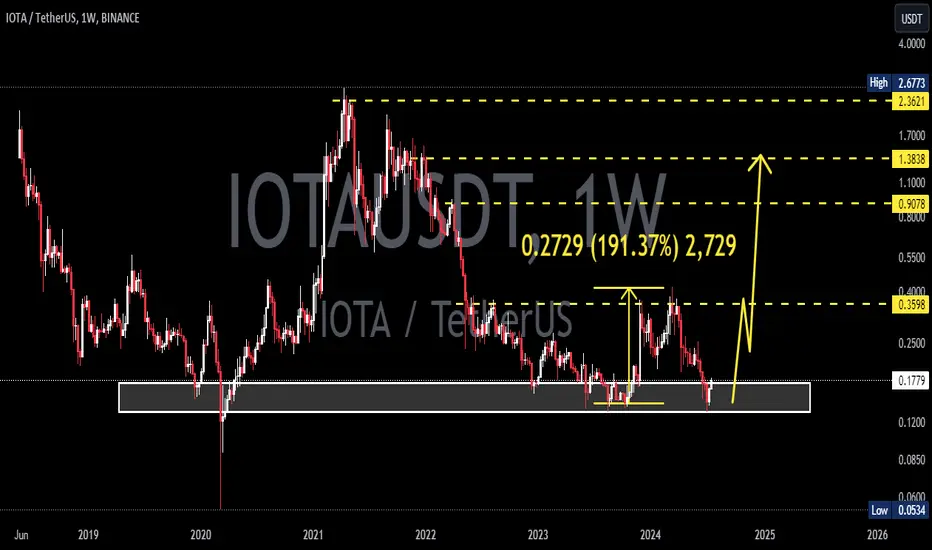
IOTAUSDT 1W AnalysisIOTA ~ 1W Analysis
#IOTA Buy back gradually from here if you still have confidence in this coin with a short term target of at least 20%+ from here.
IOTAUSDT 1D AnalysisIOTA ~ 1D Analysis
#IOTA Buy after successfully penetrating this resistant line with a short -term target of at least 10%+ from here.
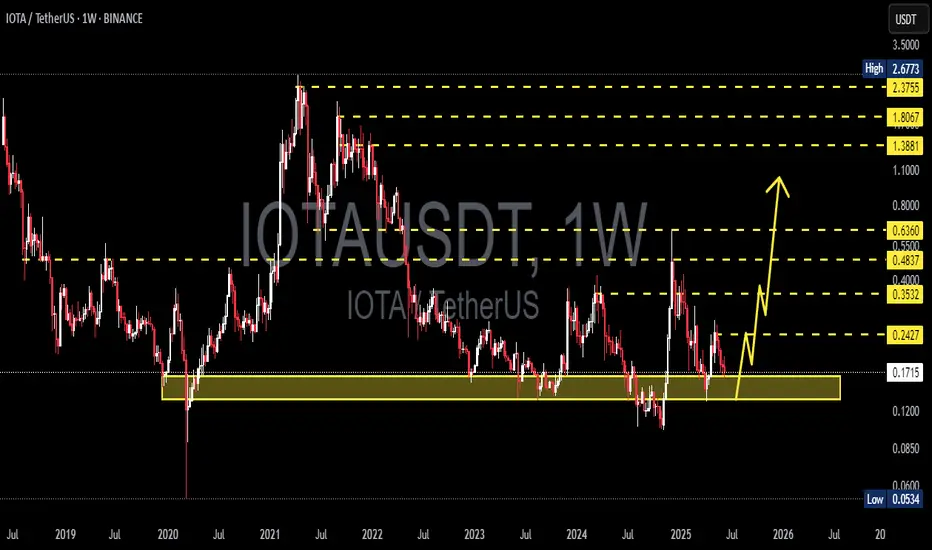
IOTAUSDT 1WIOTA ~ 1W Analysis
#IOTA Buy gradually from here if you still have a Conviction on this coin with a short -term target of at least 20%+.
IOTAUSDT 1WIOTA ~ 1W Analysis
#IOTA Buy gradually from here if you still have a Conviction on this Coin.
With a short -term target of at least 20%+.
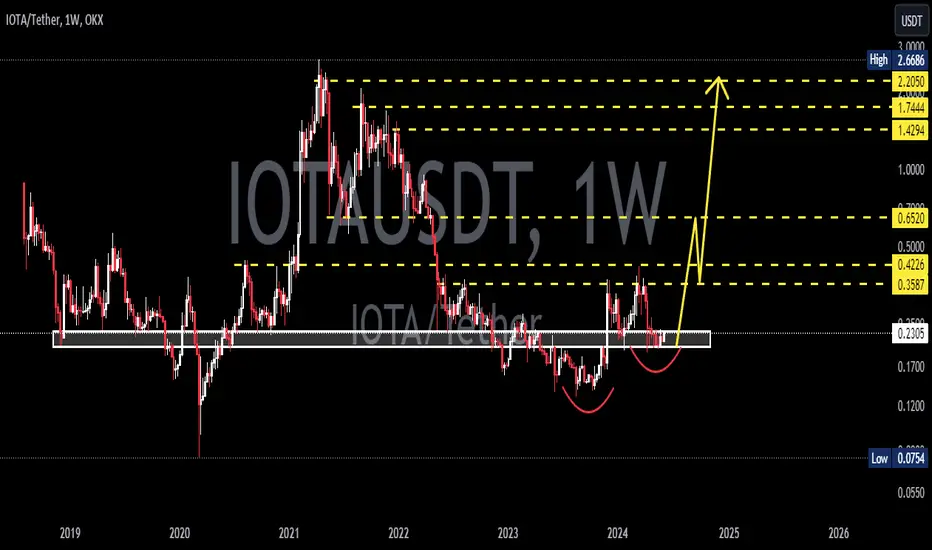
IOTAUSDTIOTA ~ 1W
#IOTA this is the lowest support block on this coin. Buy in stages with a minimum target of 20%++. Don't miss this lowest price.
IOTAUSDTFWB:IOTA ~ 1W
#IOTA If you have Conviction on this coin,. This support block would be a very good buy for now.
IOTAUSDTIOTA ~ 1W
#IOTA If you have Conviction on this coin,. This support block would be a very good buy for now.
IOTAUSDTIOTA ~ 1W
#IOTA If you have Conviction on this coin,. This support block would be a very good buy for now.

IOTAUSDT 1WIOTA ~ 1W
#IOTA Very interesting support block to start accumulation. at least for a minimum 20%+ increase from here.
IOTAUSD 1WIOTA ~ 1W
#IOTA Make purchases gradually on this support block, with a minimum target of 20%+
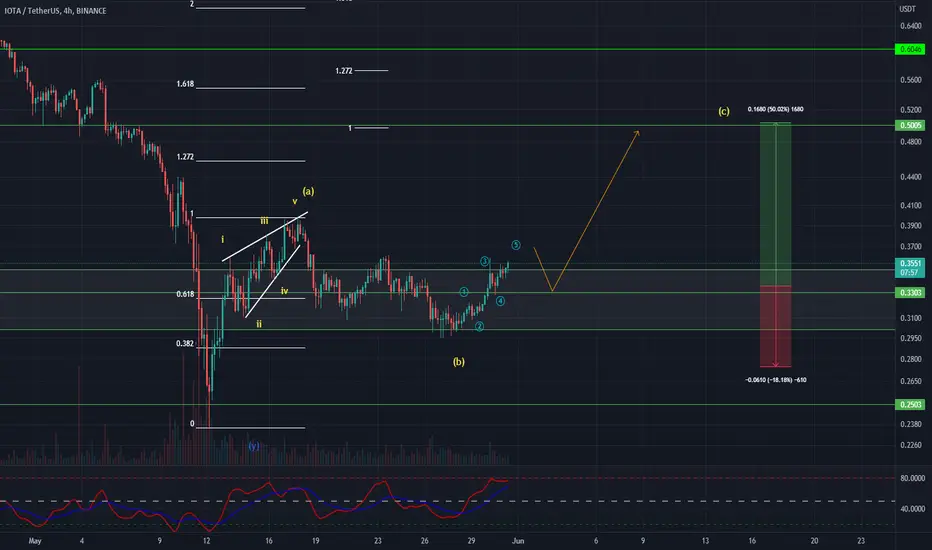
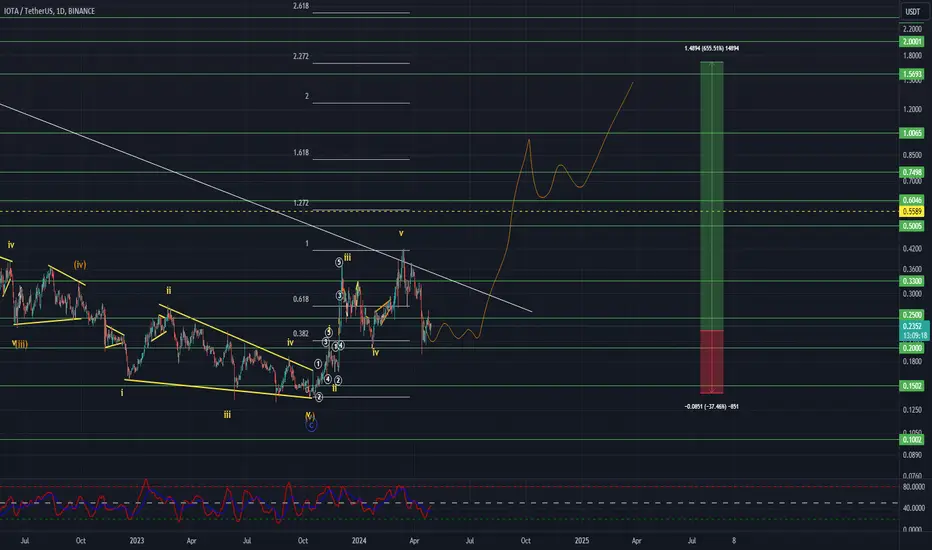
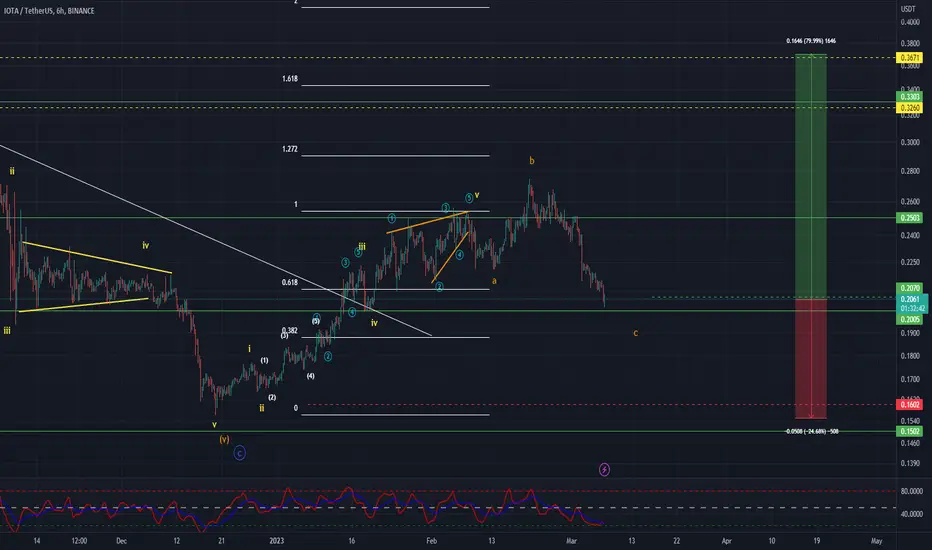
IOTAUSDT Elliott Waves AnalysisHello friends.
Please support my work by clicking the LIKE button👍(If you liked). Also i will appreciate for ur activity.
Everything on the chart.
Entry: Market and lower
Targets: 0.5 - 0.75 - 1.1 - 1.7
after first target reached move ur stop to breakeven
Stop: under 0.14 (depending of ur risk). ALWAYS follow ur RM .
RR: 1 to 15
risk is justified
It's not financial advice.
DYOR!
IOTA/USDT In the crucial support area, it requires to bounce!💎 IOTA has indeed showcased notable market dynamics recently. It's currently bouncing from a support area, suggesting a potential upward movement to test the supply area.
💎 If it successfully breaks through the supply area, it could pave the way for a return to the strong resistance zone.
💎 However, if IOTA fails to hold the support area and breaks down, it could indicate a bearish momentum.
💎 In such a scenario, the price may continue its downward trajectory, potentially reaching lower levels.
MyCryptoParadise
iFeel the success🌴
IOTA/USDT It need to bounce on the demand for back to upward!💎 IOTA has recently experienced significant market dynamics, potentially leading it back to the demand zone for a retest after facing a strong rejection from the key resistance area.
💎 If IOTA manages to bounce convincingly from the demand zone, it could signal a resurgence in bullish momentum. This bounce might pave the way for another attempt to break above the key resistance area.
💎 A successful breakout above this level would confirm a bullish trend for IOTA and could facilitate a move towards our target area.
💎 However, if IOTA fails to find support at the demand zone and continues to decline, the next significant level to watch is the support area. In this scenario, IOTA must bounce from the support area and reclaim the price above the demand zone to sustain any upward momentum.
💎 Should IOTA fail to bounce from the support area and instead break below it, it could indicate further downside potential for the price, with the possibility of continued downward movement.

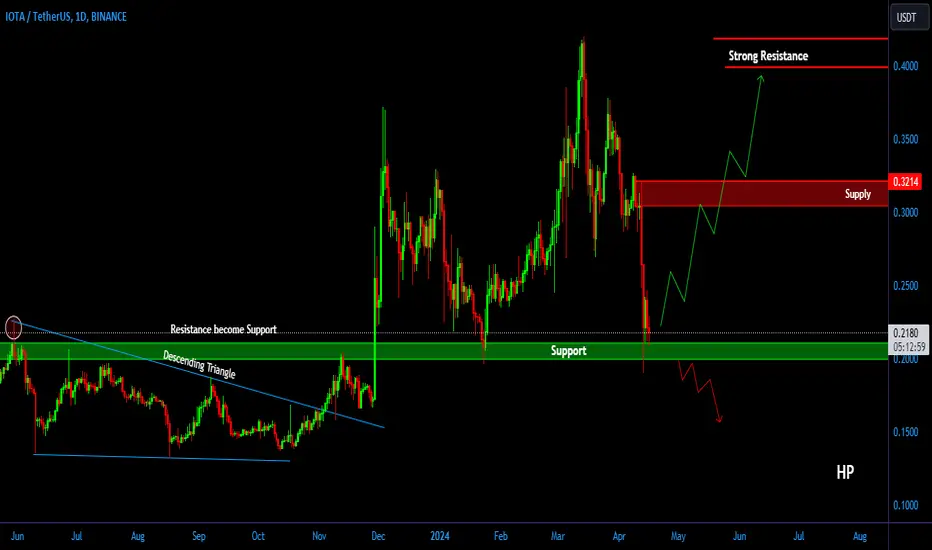
IOTA/USDT Keep an eye, If breakout is success, Back to upward!💎 IOTA has recently displayed significant market dynamics. Currently, IOTA remains in a sideways trend after reclaiming the demand area.
💎 There are two potential scenarios: either IOTA breaks out of the bullish flag pattern without retesting the demand area, or it undergoes a retesting phase before breaking the pattern.
💎 In the event of a successful breakout, we could witness a significant upward movement, probability leading to a retest of our target strong resistance area.
💎 However, if IOTA retraces back to the demand area at $0.23 - $0.22 and breaks below it, the price may resume its downward movement. The next key level of support would be tested, and if it fails to hold, the price could decline further. In such a scenario, IOTA might revisit the strong support area for potential stabilization.

IOTAUSDT Elliott Waves AnalysisHello friends.
Please support my work by clicking the LIKE button👍(If you liked). Also i will appreciate for ur activity. Thank you!
Everything on the chart.
Entry: Market and lower
Targets: 0.33 - 0.37 - 0.41
Stop: under 0.2 (depending of ur risk).
RR: 1 to 3
ALWAYS follow ur RM.
risk is justified
Good luck everyone!
Follow me on TRADINGView, if you don't want to miss my next analysis or signals.
It's not financial advice.
Dont Forget, always make your own research before to trade my ideas!
Open to any questions and suggestions

IOTA/USDT Need to break the pattern or Back to strong support ??💎 IOTA has certainly captured our interest, standing at a pivotal point. Currently navigating within a descending channel, IOTA is striving to breach the pattern's resistance, facing setbacks. Overcoming this boundary is essential for confirming IOTA's bullish momentum.
💎 A few weeks ago, IOTA encountered a robust support zone following a descent triggered by breaking a bearish flag pattern.
💎 This formidable area has repeatedly proven its strength, preventing further declines in IOTA's value on numerous occasions, observable on weekly or daily charts. Each interaction with this solid support has historically propelled IOTA into substantial rebounds, exemplified by the recent surge that led it to the pattern's resistance.
💎 However, should IOTA remain unable to shatter the channel's confines in the coming days, it might retreat, seeking solace in the familiar territory of its strong support zone, thereby testing its resilience once more.

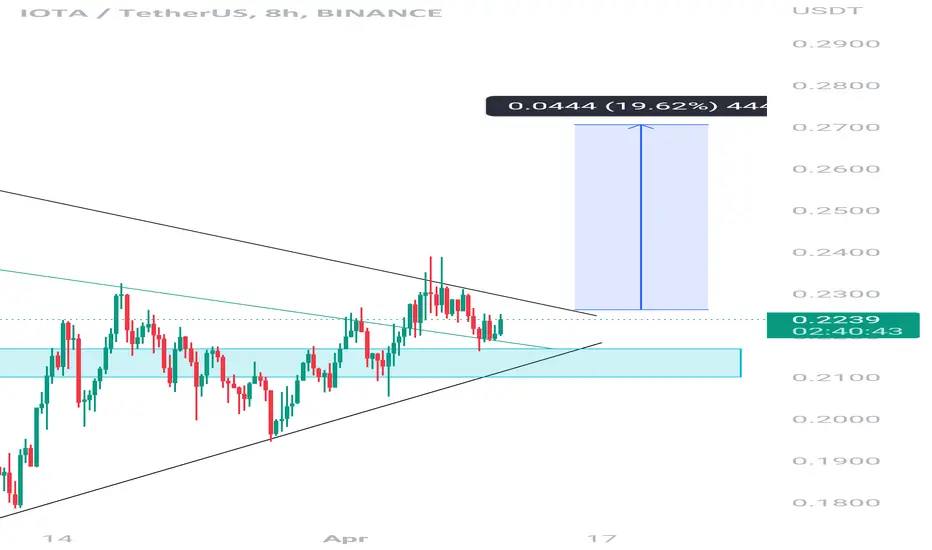
Iotausdt Most Probably IOAUSDT
has recently confirmed the trendline resistance breakout and retest, and a symmetrical bullish pattern has emerged on the 8-hour timeframe. This pattern indicates a potential bullish move to the upside if a successful breakout occurs.
It is recommended to wait for confirmation of the breakout before taking any positions. Proper risk management is important to avoid losses in case of a false breakout or a sudden market reversal. If the breakout is successful, the price is likely to move 30-50% higher from the breakout level. Traders should keep a close eye on the price action and adjust their positions accordingly.
If You Are Satisfied With Our Work Join us
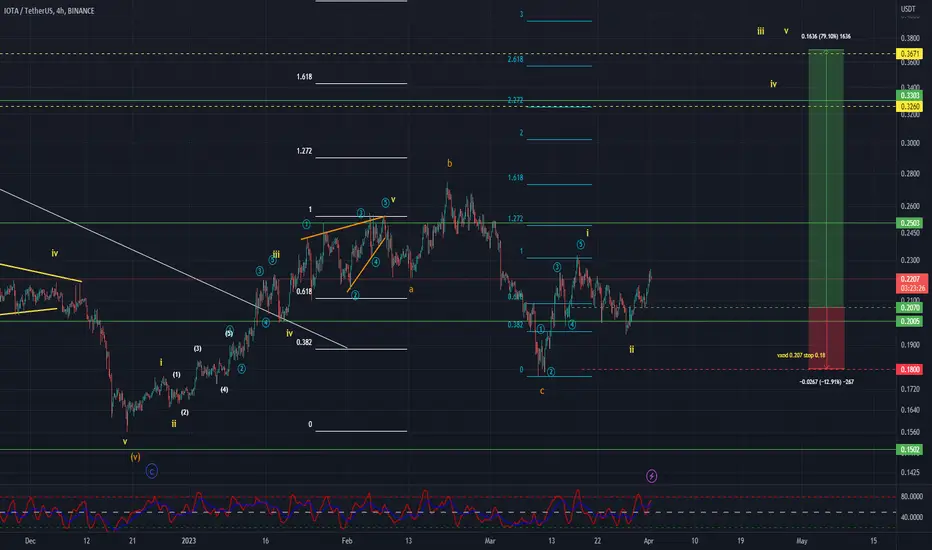
IOTAUSDT Elliott Waves AnalysisHello friends.
Please support my work by clicking the LIKE button👍(If you liked). Also i will appreciate for ur activity. Thank you!
Everything on the chart. (update)
Entry: market and lower
Targets: 0.28 - 0.33 - 0.36
after first target reached move ur stop to breakeven
Stop: ~0.18 (depending of ur risk). ALWAYS follow ur RM .
RR: 1 to 7
risk is justified
Good luck everyone!
Follow me on TRADINGView, if you don't want to miss my next analysis or signals.
It's not financial advice.
Dont Forget, always make your own research before to trade my ideas!
Open to any questions and suggestions
IOTAUSDT Elliott Waves AnalysisHello friends.
Please support my work by clicking the LIKE button👍(If you liked). Also i will appreciate for ur activity. Thank you!
Everything on the chart.
Entry: market and lower
Targets: 0.28 - 0.33 - 0.36
after first target reached move ur stop to breakeven
Stop: ~0.155 (depending of ur risk). ALWAYS follow ur RM .
RR: 1 to 3
risk is justified
Good luck everyone!
Follow me on TRADINGView, if you don't want to miss my next analysis or signals.
It's not financial advice.
Dont Forget, always make your own research before to trade my ideas!
Open to any questions and suggestions
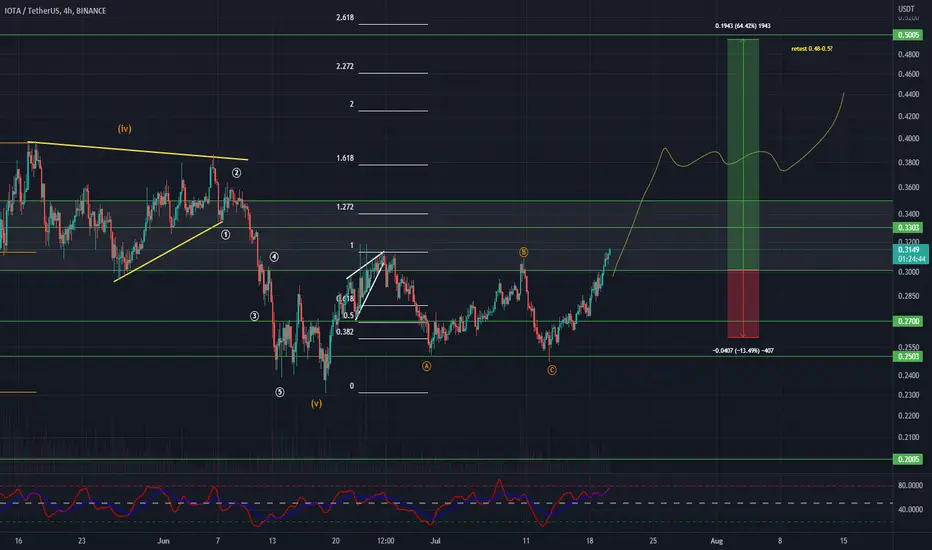
IOTAUSDT Analysis (LOCAL VISION)Hello friends.
Please support my work by clicking the LIKE button👍(If you liked). Also i will appreciate for ur activity. Thank you!
Everything on the chart.
Entry: market and lower
Target: 0.36 - 0.4 - 0.44 and maybe even ~0.49
after first target reached move ur stop to breakeven
Stop: ~0.26 (depending of ur risk). ALWAYS follow ur RM .
Risk/Reward: 1 to 5
risk is justified
Good luck everyone!
Follow me on TRADINGView, if you don't want to miss my next analysis or signals.
It's not financial advice.
Dont Forget, always make your own research before to trade my ideas!
Open to any questions and suggestions.
IOTAUSDT Analysis (LOCAL VISION)Hello friends.
Please support my work by clicking the LIKE button👍(If you liked). Also i will appreciate for ur activity. Thank you!
Everything on the chart.
Entry: market and lower
Target zone: 0.45 - 0.5$
after first target reached move ur stop to breakeven
Stop: ~0.27 (depending of ur risk). ALWAYS follow ur RM .
Risk/Reward: 1 to 3
risk is justified
Good luck everyone!
Follow me on TRADINGView, if you don't want to miss my next analysis or signals.
It's not financial advice.
Dont Forget, always make your own research before to trade my ideas!
Open to any questions and suggestions.