IOTX/USDT Weekly – Massive Bullish Setup Forming at Historical🔍 Technical Analysis Breakdown:
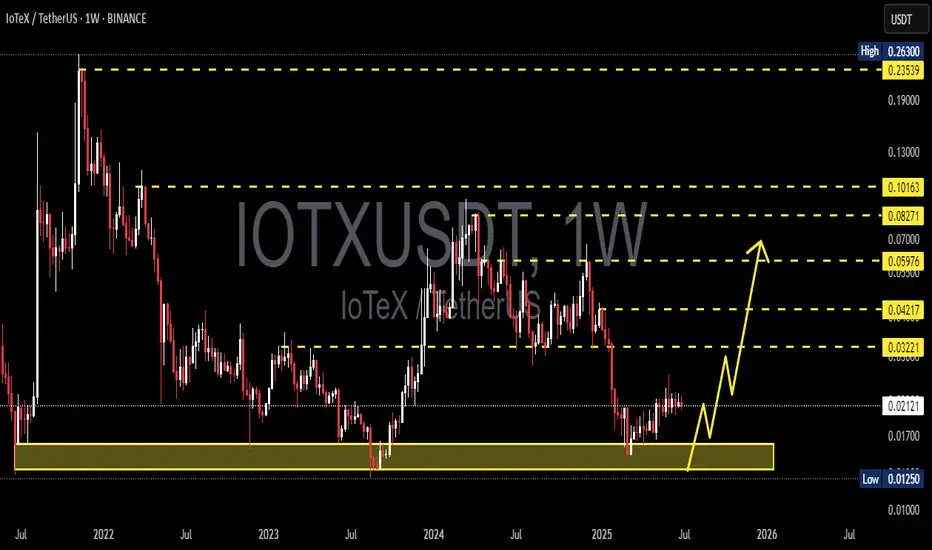
The IOTX/USDT pair is currently consolidating inside a strong historical accumulation zone between $0.0125 and $0.0172, which has served as a critical support area multiple times since 2021. This zone is marked by long-term investor interest, making it a potential launchpad for a major trend reversal.
What makes this zone particularly significant is that it aligns with a potential Double Bottom formation on the weekly timeframe — a classic bullish reversal pattern indicating that sellers are exhausted, and buyers are regaining control.
The projected price path on the chart shows a possible multi-leg breakout scenario, with higher highs forming in a wave structure that hints at a medium-to-long-term bullish trend.
✅ Bullish Scenario – Path of Least Resistance:
If the price successfully holds above the key demand zone and breaks above the first resistance level at $0.03221, the next upside targets to watch are:
1. 🟡 $0.04217 – Weekly resistance from a prior consolidation phase.
2. 🟡 $0.05976 – A psychological resistance and former breakdown zone.
3. 🟡 $0.08271 – $0.10163 – Strong supply zones from the 2022 bearish structure.
4. 🟢 $0.23539 (Final Target) – All-time high region, could be tested in a full bull cycle.
This bullish structure suggests a potential +800% upside from current levels if macro and market sentiment align in favor.
❌ Bearish Scenario – Caution if Support Breaks:
If IOTX loses the key support zone (closes weekly below $0.0125), then:
The market could re-enter a bearish accumulation, risking a move toward new all-time lows.
Momentum would shift back in favor of sellers, invalidating the double bottom structure.
Traders should then wait for signs of re-accumulation or divergence before re-entering.
📉 Volume & Momentum Insight:
Volume remains low but stable, signaling that smart money may be accumulating quietly.
If breakout occurs with a volume spike, this will act as strong confirmation for bullish continuation.
🧠 Conclusion:
IOTX is showing early signs of a major bullish reversal from a well-respected accumulation base. With multiple targets layered above and a clean invalidation zone below, this setup offers high reward-to-risk potential. Watch for a confirmed breakout above $0.032 to validate the beginning of a strong uptrend.
#IOTX #IOTXUSDT #CryptoBreakout #AltcoinAnalysis #TechnicalAnalysis #CryptoSetup #BullishCrypto #IoTeX #CryptoTrading #AccumulationZone
Iotxusdtbuy
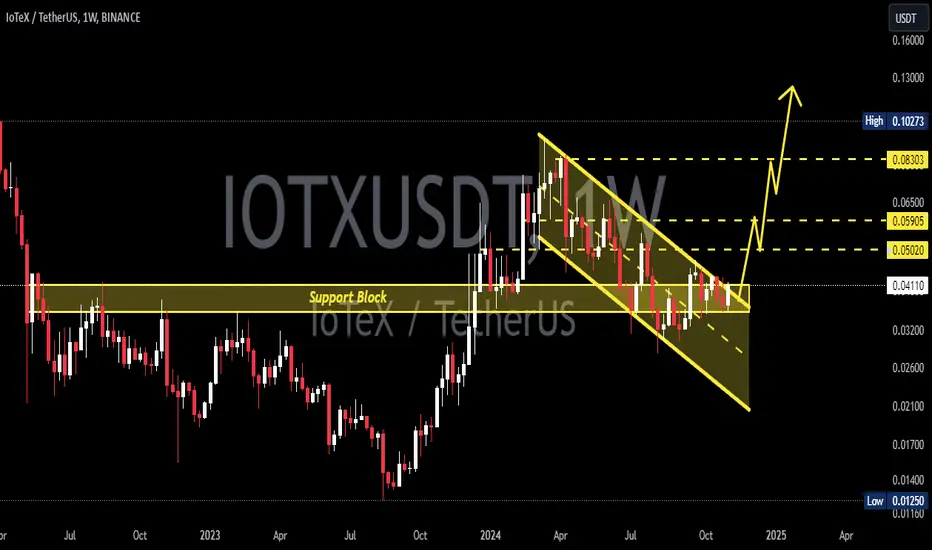
IOTXUSDT 1WIOTX ~ 1W Analysis
#IOTX Buy gradually from here if you still have a Conviction on this Coin with a minimum target of 15%+
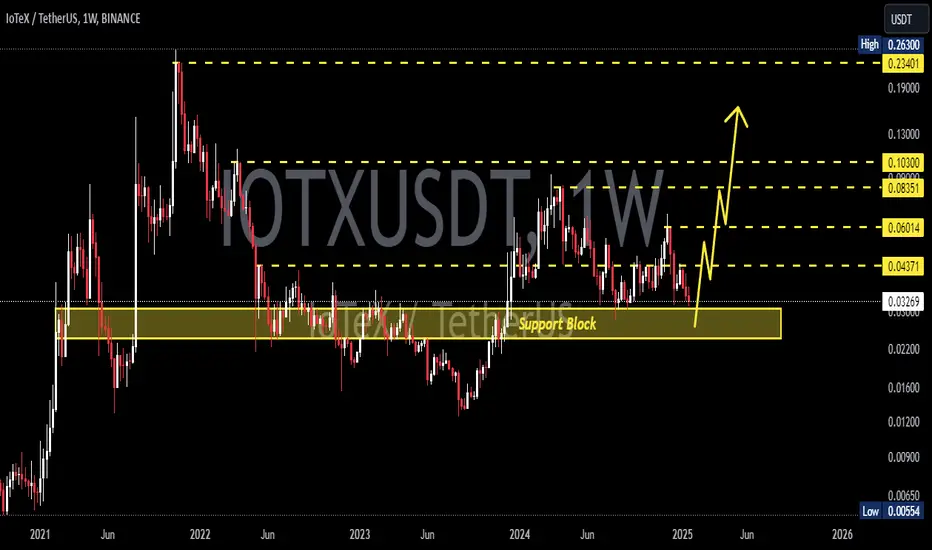
IOTXUSDT 1WIOTX ~ 1W Analysis
#IOTX If you still have Conviction on this coin,. This support block would be a very good buying spot for now with a target of at least 20%+
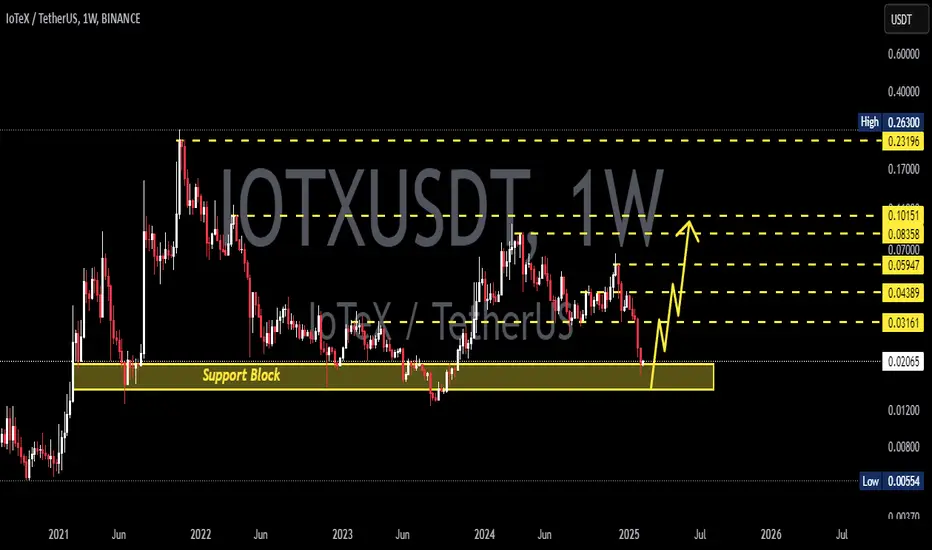
IOTXUSDT 1WIOTX~ 1W
#IOTX If you still have Conviction on this coin, Buy it on this support block. Minimum target 20%++. Bullish will dominate after this.
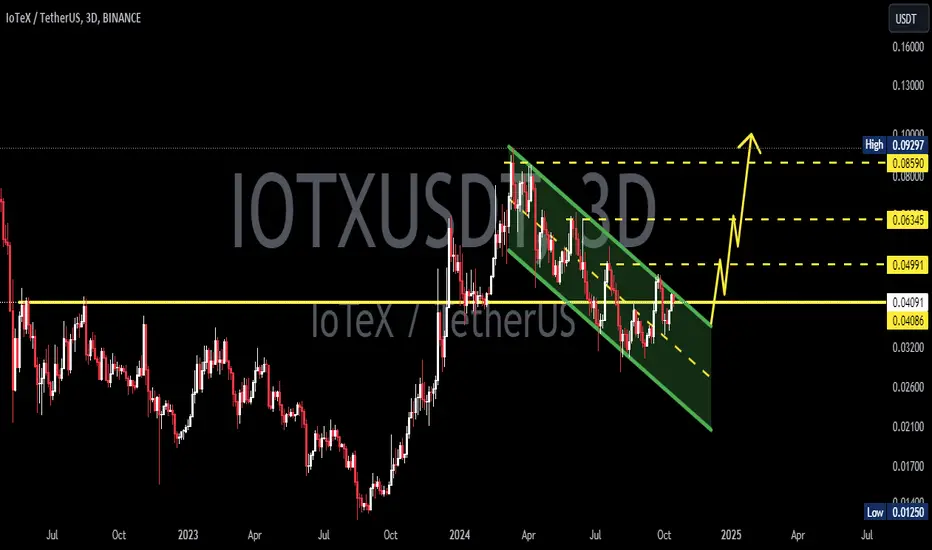
IOTXUSDTIOTX ~ 3D
#IOTX moving in a descending pattern. Wait for this pattern to be successfully broken to start making purchases gradually.

IOTXUSDTIOTX ~ 3D
#IOTX moving in a descending pattern. Wait for this pattern to be successfully broken to start making purchases gradually.
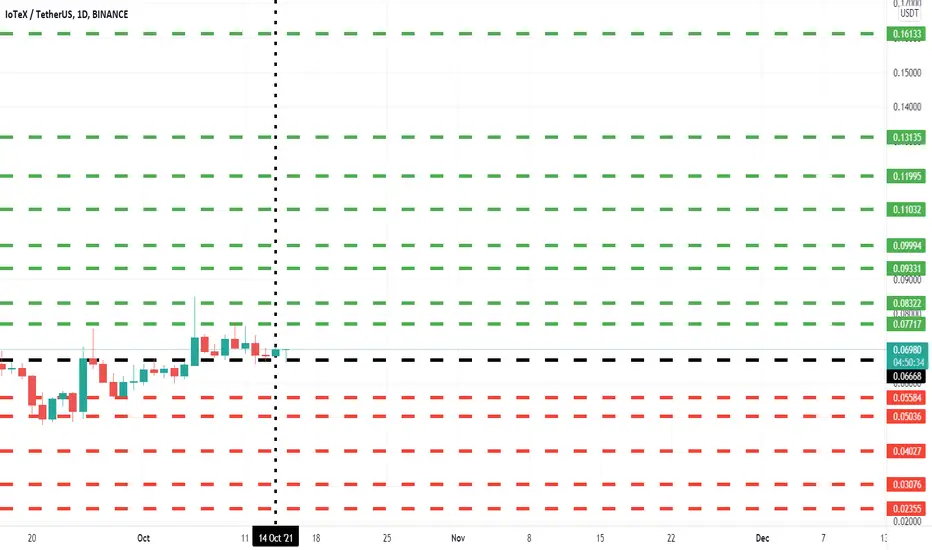
IOTXUSDT Daily TimeframeSNIPER STRATEGY (new version)
It works ALMOST ON ANY CHART.
It produces Weak, Medium and Strong signals based on consisting elements.
NOT ALL TARGETS CAN BE ACHIEVED, let's make that clear.
TARGETS OR ENTRY PRICES ARE STRONG SUPPORT AND RESISTANCE LEVELS SO THEY CAN ACT LIKE PIVOT POINTS AND REVERSE THE WAVE (or act like a mirror that can reflects light) BASED ON STRENGTH OF THAT LEVEL.
ENTRY PRICE BLACK COLOR
MOST PROBABLE SCENARIOS TARGETS GREEN COLOR
LEAST PROBABLE SCENARIOS TARGETS RED COLOR
TARGETS ARE NOT EXACT NUMBERS THEY ARE MORE LIKE A ZONE.
DO NOT USE THIS STROTEGY FOR LEVERAGED TRADING.
It will not give you the whole wave like any other strategy out there but it will give you a huge part of the wave.
The BEST TIMEFRAMES for this strategy are Daily, Weekly and Monthly however it can work on any timeframe.
Consider those points and you will have a huge advantage in the market.
There is a lot more about this strategy.
It can predict possible target and also give you almost exact buy or sell time on the spot.
I am developing it even more so stay tuned and start to follow me for more signals and forecasts.
START BELIEVING AND GOOD LUCK
HADIMOZAYAN
Triangle PatternCrypto Analysis: IOTXUSDT has formed the triangle pattern looks good buy around marked demand areas with bottom level as stop loss for given target and profit percentage..
Let's see..
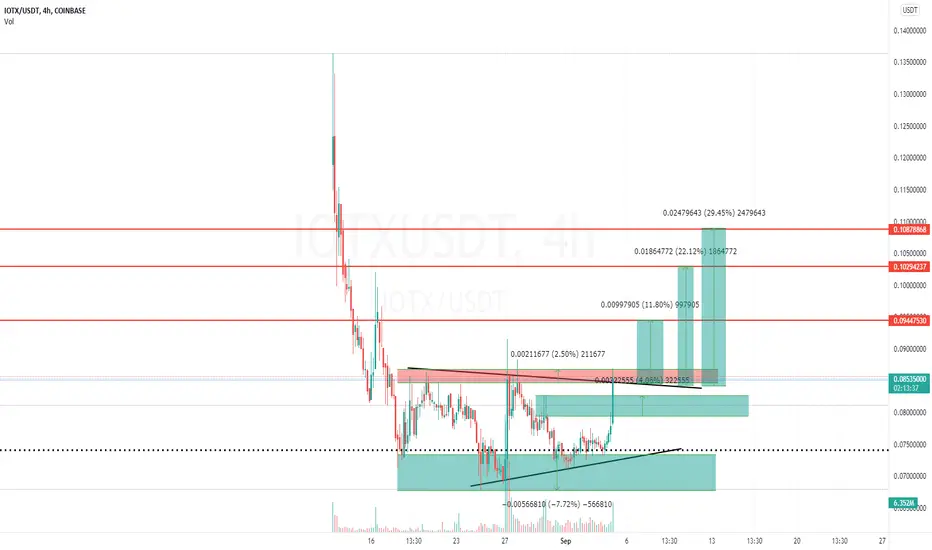
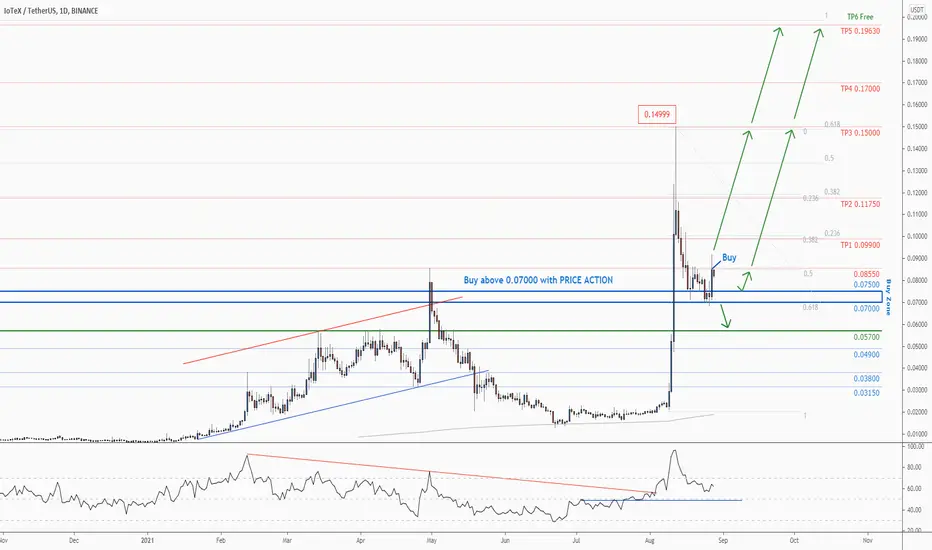
💡Don't miss the great buy opportunity in IOTXUSDTMidterm forecast:
0.057000 is major support, while this level is not broken, the Midterm wave will be uptrend.
Technical analysis:
While the RSI support #1 at 49 is not broken, the probability of price decrease would be too low.
A trough is formed in daily chart at 0.068550 on 08/26/2021, so more gains to resistance(s) 0.085500, 0.099000, 0.117500 and more heights is expected.
Price is above WEMA21, if price drops more, this line can act as dynamic support against more losses.
Relative strength index ( RSI ) is 64.
Take Profits:
TP1= @ 0.099000
TP2= @ 0.117500
TP3= @ 0.150000
TP4= @ 0.170000
TP5= @ 0.196300
❤️ If you find this helpful and want more FREE forecasts in TradingView
. . . . . Please show your support back,
. . . . . . . . Hit the 👍 LIKE button,
. . . . . . . . . . Drop some feedback below in the comment!
❤️ Your support is very much 🙏 appreciated!❤️
💎 Want us to help you become a better Forex / Crypto trader?
Now, It's your turn!
Be sure to leave a comment; let us know how you see this opportunity and forecast.
Trade well, ❤️
ForecastCity English Support Team ❤️