IOUSDT — Descending Triangle at Key Demand Zone!✨ Overview
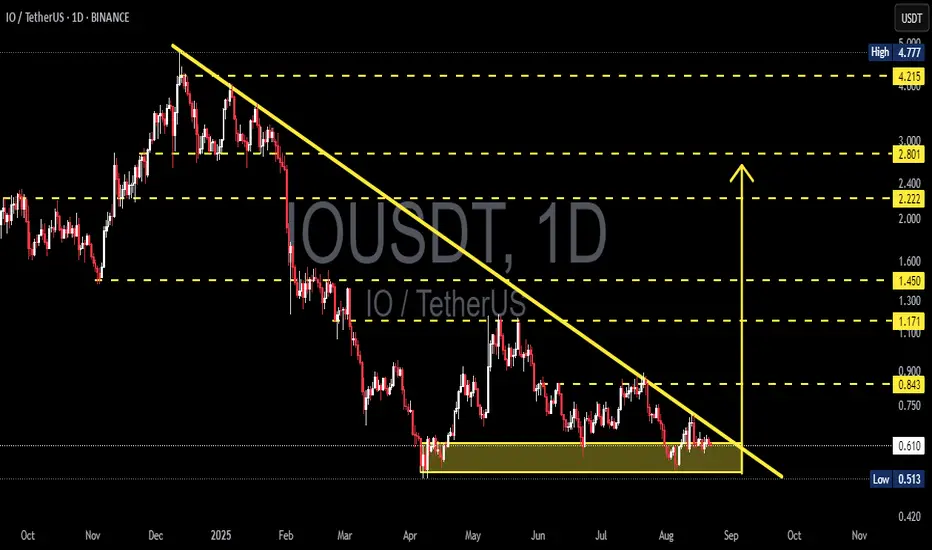
The IOUSDT chart on the daily timeframe is showing a critical consolidation phase after a prolonged downtrend. Price is currently sitting inside the major demand zone 0.53–0.65, forming a descending triangle pattern — a classic setup that often leads to a decisive breakout move.
The falling trendline (yellow) is pressing down a series of lower highs, while the horizontal support around 0.60 remains intact. This reflects a supply vs demand compression: once this battle ends, the market usually delivers a strong directional move.
---
📈 Bullish Scenario (Breakout Potential)
1. Trendline Breakout
A daily close above the descending trendline would be the first signal that sellers are losing control.
Stronger confirmation comes with a successful reclaim of 0.843 (nearest horizontal resistance).
2. Bullish Targets
If a breakout occurs, price could aim for the following resistances step by step:
0.843 → breakout validation.
1.171 → psychological resistance.
1.450 → prior supply zone.
2.222 – 2.801 → expansion zone.
4.215 → major resistance & mid-term target.
3. Why Buyers May Be Confident
The 0.53–0.65 demand zone has held firmly since April 2025.
Bearish momentum is weakening, as sellers have failed to print significantly lower lows.
---
📉 Bearish Scenario (Breakdown Continuation)
1. Support Breakdown
A daily close below 0.513 would confirm a breakdown from the descending triangle.
The projected measured move points towards 0.37–0.40 as the next major target.
2. Retest Setup
After a breakdown, price may retest the 0.53–0.60 zone as new resistance before continuing lower.
Aggressive traders could look for short opportunities here.
3. Bearish Risk Factor
If a false breakdown occurs and price quickly recovers above 0.53–0.60, sellers may get trapped, potentially triggering a short squeeze rally.
---
🔑 Key Technical Takeaways
Descending Triangle → Typically bearish continuation, but an upside breakout can flip it into a strong bullish reversal signal.
Demand Zone 0.53–0.65 → The make-or-break area for buyers to defend.
Downtrend Line → As long as it remains unbroken, mid-term structure still favors sellers.
---
🎯 Conclusion
IOUSDT is now at a make-or-break junction:
Bullish case: breakout above trendline + reclaim of 0.843 could fuel momentum towards 1.171 and even 2.222.
Bearish case: daily close below 0.513 may unlock further downside into the 0.37 area.
Patience is key — waiting for a confirmed breakout or breakdown will provide clarity for the next strong move.
#IOUSDT #IO #CryptoAnalysis #DescendingTriangle #BreakoutSetup #BearishOrBullish #SupportResistance #PriceAction #TrendlineBreakout #CryptoTrading #TechnicalAnalysis
Iousdtlong
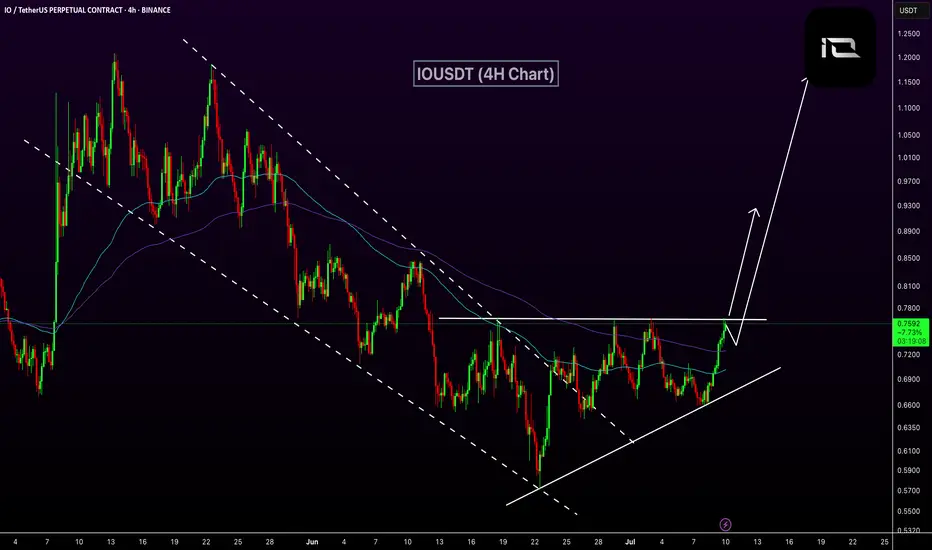
IOUSDT Reversal SignalBINANCE:IOUSDT has broken out of a falling wedge on the 4H chart, signaling a potential trend reversal.
The price is trading above both the 50 EMA and 100 EMA, indicating growing bullish momentum.
A successful retest of the breakout zone could lead to a sharp move toward the $0.85–$1.10 level.
Resistance 1: $0.88
Resistance 2: $1.10
Stop Loss: $0.655
IOUSDT: Inverse Head & Shoulders Breakout – The Reversal is RealBINANCE:IOUSDT has just completed a textbook Inverse Head and Shoulders pattern, one of the most reliable reversal setups in technical analysis. After a prolonged downtrend that left the asset oversold and undervalued, the market has begun to shift. We’ve now seen a clean breakout above the neckline and a healthy retracement back to it. A classic confirmation signal that often precedes strong bullish moves.
This shift is further supported by the emergence of higher highs and higher lows on the smaller timeframes, suggesting that bullish momentum is building. With the downtrend now exhausted, BINANCE:IOUSDT looks poised to begin a new uptrend that could offer solid upside potential for early entrants.
As always, risk management is key. While the pattern setup is strong, it’s crucial to place stop losses just below the right shoulder or neckline to protect against unexpected volatility. The market doesn’t offer guarantees, but this setup offers high-probability conditions worth paying attention to.
BINANCE:IOUSDT Currently trading at $0.98
Buy level : Above $0.95
Stop loss : Below $0.76
Target : $2.65
Max leverage 3x
Always keep stop loss
Follow Our Tradingview Account for More Technical Analysis Updates, | Like, Share and Comment Your thoughts
