IPCA Laboratories – Weekly Technical Analysis 📈 IPCA Laboratories – Weekly Technical Analysis (For Study Purpose Only)
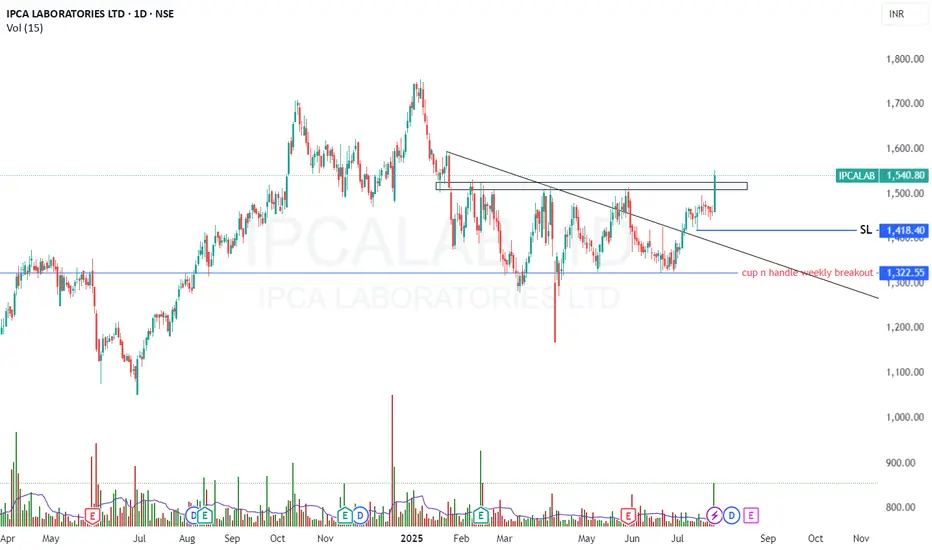
Ipca Labs has successfully completed a Cup and Handle breakout on the weekly chart, indicating a strong bullish setup after a prolonged consolidation phase.
After forming a double top and undergoing a nearly 6-month consolidation, the stock recently broke out above the neckline and range of ₹1320–₹1510, followed by a textbook retest of the breakout zone, which further strengthens the breakout's validity.
🔍 Key Technical Highlights:
✅ Pattern Formed: Weekly Cup and Handle retest and 6 month range breakout
📉 Previous Structure: Double top ➜ breakdown ➜ 6-month range consolidation
🔼 Breakout & Retest Zone: ₹1320–₹1510
✅ Retest Completed: Confirmed on weekly chart with supportive volume and price stability
🎯 Upside Targets:
Short-term: ₹1600
Medium-term: ₹1700
Long-term: New All-Time High (above ₹1750+)
🛑 Risk Management:
Stop-Loss: ₹1480 or (below retest zone)
📊 Supporting Indicators:
RSI trending upward, currently above 60 (bullish zone)
MACD crossover confirms positive momentum
Volume confirms strength during breakout
📌 Disclaimer: This analysis is for educational and study purposes only. Not a buy/sell recommendation.
Ipca
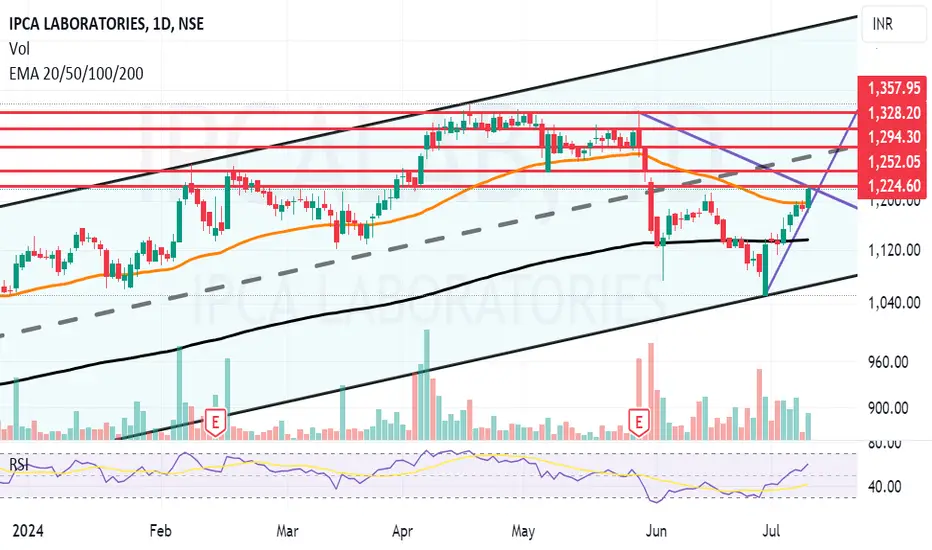
Can IPCA Break the trend?Ipca Laboratories Ltd. engages in the manufacturing, marketing, research, and development of pharmaceutical products. Its products include Hydroxychloroquine Sulphate, Artemether and Lumefantrine and Acceclofenac and its combinations. The Company has 18 manufacturing units in India manufacturing API's and formulations for the world market.
Ipca Laboratories Ltd CMP 1220.75. The positive aspects of the company are Mutual Funds Increased Shareholding in Past Month, Company with Low Debt, Company with Zero Promoter Pledge and FII / FPI or Institutions increasing their shareholding. The Negative aspects of the company are High PE (PE=56.6), MFs decreased their shareholding last quarter, Declining Net Cash Flow : Companies not able to generate net cash and De-growth in Revenue, Profits and Operating Profit Margin in recent results.
Entry can be taken after closing above 1225. Targets in the stock will be 1252 and 1294. The long-term target in the stock will be 1328 and 1357. Stop loss in the stock should be maintained at Closing below 1136.
The above information is provided for educational purpose, analysis and paper trading only. Please don't treat this as a buy or sell recommendation for the stock. We do not guarantee any success in highly volatile market or otherwise. Stock market investment is subject to market risks which include global and regional risks. We will not be responsible for any Profit or loss that may occur due to any financial decision taken based on any data provided in this message.
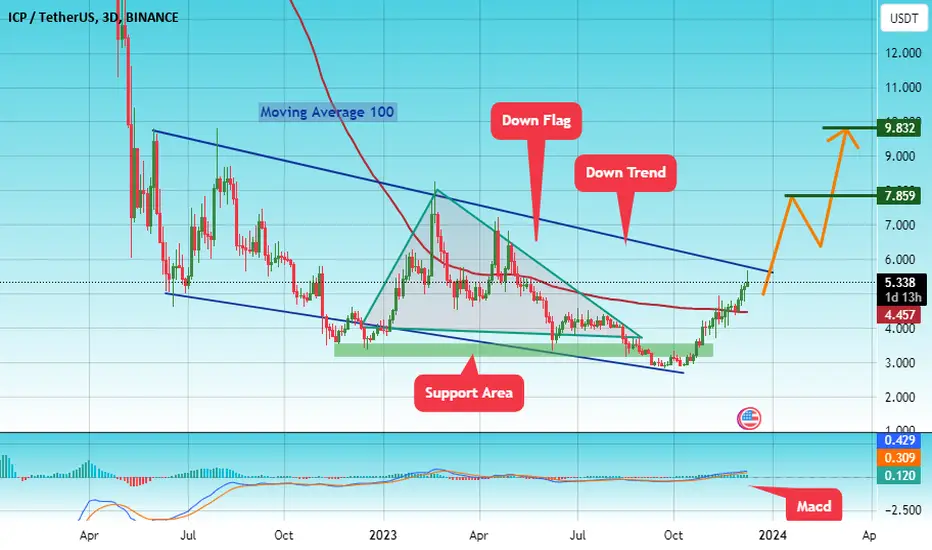
#IPC/USDT#IPC
The price has been moving in a bearish flag since April 2022
We have a strong support area from which the price rebounded
We're about to go up
This rise is supported by the moving average 100 breaking
The price now is 5.33
First goal 7.85
Second goal 7.83
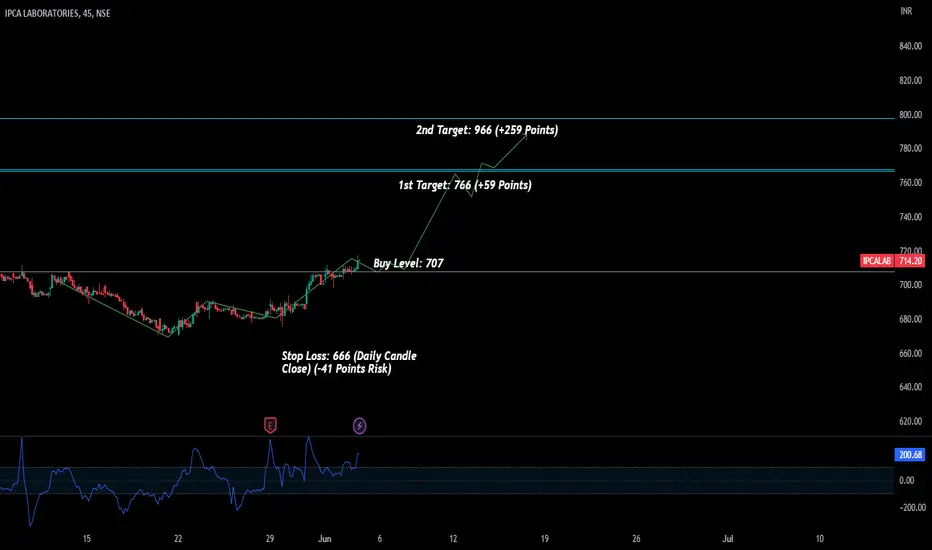
IPCALAB Low Risk Big Profit IdeaAs per my analysis, 707 level was strong resistance of NSE:IPCALAB . Now resistance has been brake and sustained above 707. My idea is to take buy entry at level of 707 with stop loss of 666 (-41 Points Risk). My expected upside target would be 766 (+59) & 966 (+259 Points).
It could be jackpot idea.
Note: This is my personal analysis, only to learn stock market behavior. Thanks.
Good Long Term idea: IPCA LABS. IPCA Labs CMP 2176.
Looks good for X/2 entry at CMP and second X/2 entry above 2265.
Targets: 2453, 2600 and 2700+ (long Term)
Stop Loss: Below 1850 closing.
Also there will be stock split soon 2:1 in IPCA.

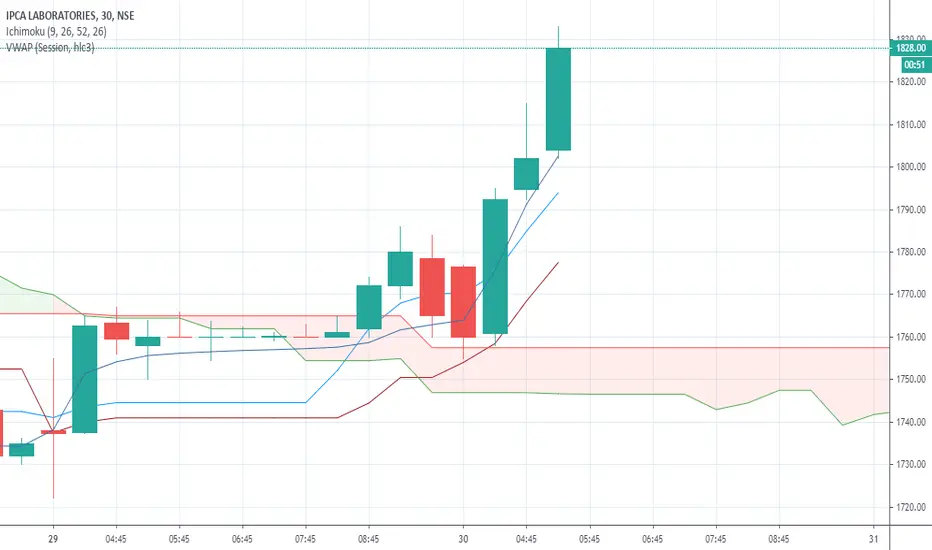
R-0111 IPCA LAB moving towards 1900 and beyondBuy IPCA lab at the CMP with SL 1776 for intraday and SL 1730 for short term and for TGT >1900
MACD cross over
TK cross over
Huge volume buy
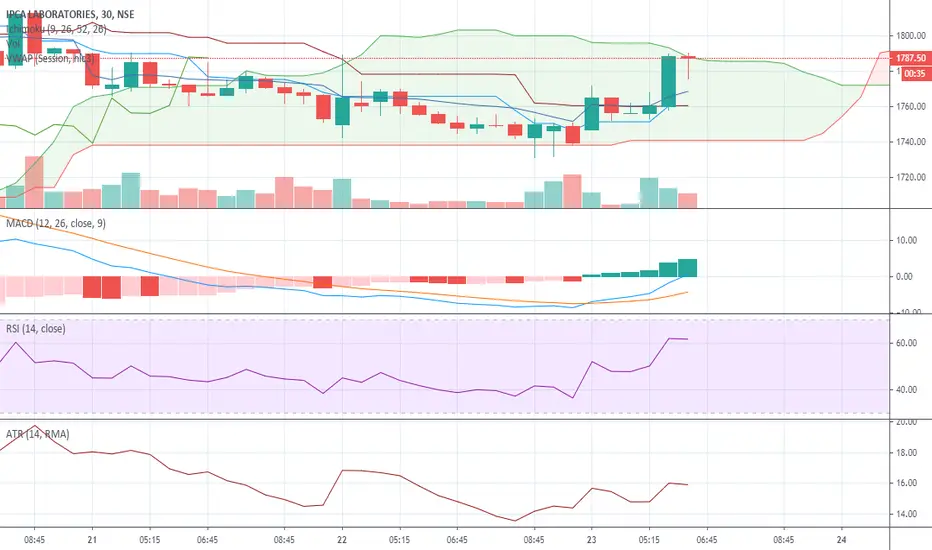
R-0081 Cash Buy IPCALAB @1778.00-1780 SL 1744 TGT 1840Short Term Cash Buy IPCALAB @1778.00-1780 SL 1744 TGT 1840
TK cross over with MACD buy with good volume
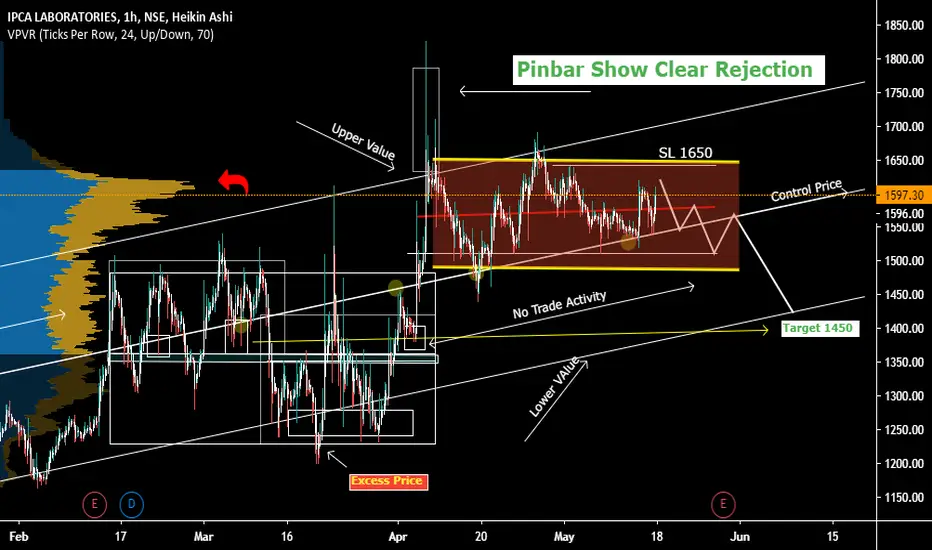
Short Setup of IPCA In day or weekly Time Frame !Lol I know Its confusion getting lots of lines but don't worry you can IPCA lab with stop loss 1650.
Looks weekly :
Shown rejection in weekly
Conclusion: in All tie frame It's looking for Short opportunity.
Thanks
IPCA LABORATORIES : BEARISH FOR SHORT TERM Hey guys,
IPCA is trending stocks nowadays
I am bearish in a short time frame due to the monthly time frame
expected to touch at 1200-1300 level
What do you think?
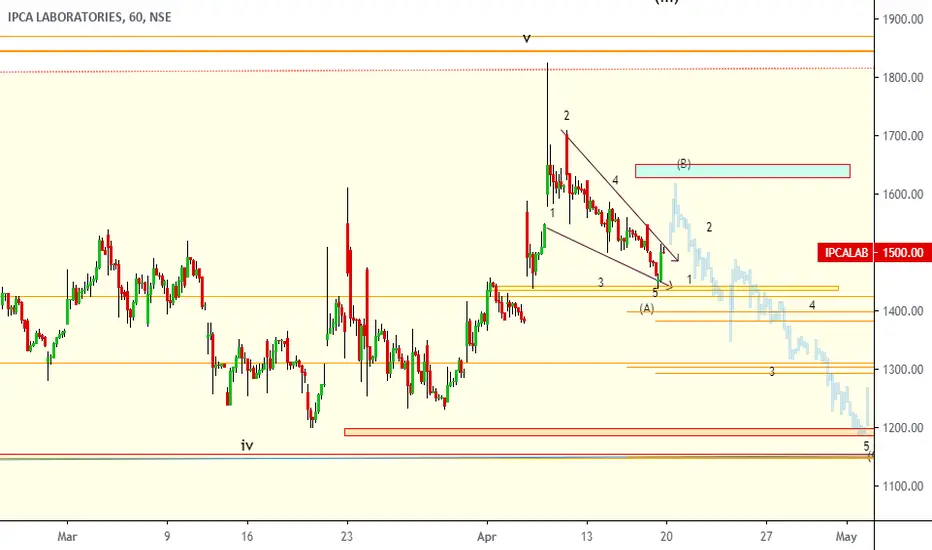
IPCALABS nearing Primary 4th wave completion. IPCALABS nearing Primary 4th wave completion. Invest around 450-400 levels.
