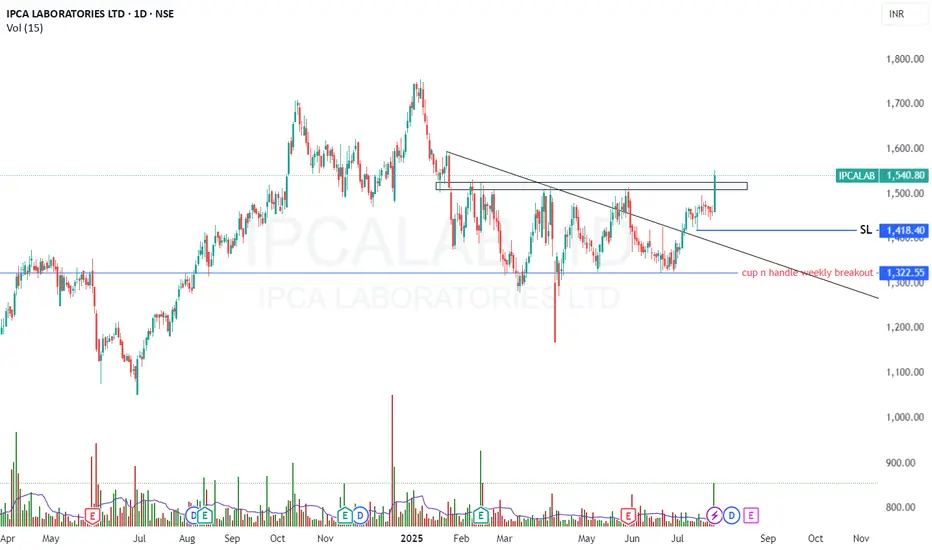
pcalabs BreakoutNSE:IPCALAB is making a Multi-month High. You can buy once it crosses 1552 and 1st Target would 1666. You can keep Second Target as 1800, provided try to achieve the same using Trailing Stoploss.
Ipcalabbuy
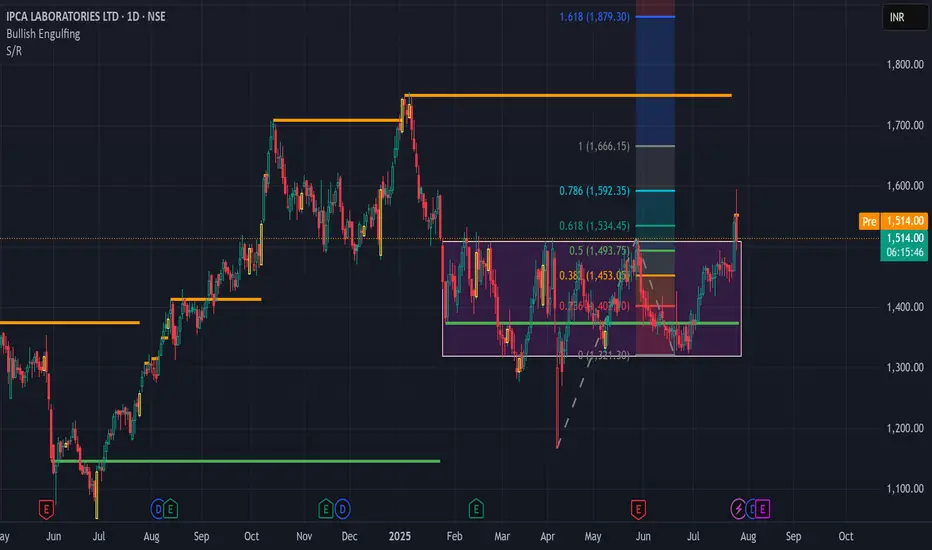
IPCA Laboratories – Weekly Technical Analysis 📈 IPCA Laboratories – Weekly Technical Analysis (For Study Purpose Only)
Ipca Labs has successfully completed a Cup and Handle breakout on the weekly chart, indicating a strong bullish setup after a prolonged consolidation phase.
After forming a double top and undergoing a nearly 6-month consolidation, the stock recently broke out above the neckline and range of ₹1320–₹1510, followed by a textbook retest of the breakout zone, which further strengthens the breakout's validity.
🔍 Key Technical Highlights:
✅ Pattern Formed: Weekly Cup and Handle retest and 6 month range breakout
📉 Previous Structure: Double top ➜ breakdown ➜ 6-month range consolidation
🔼 Breakout & Retest Zone: ₹1320–₹1510
✅ Retest Completed: Confirmed on weekly chart with supportive volume and price stability
🎯 Upside Targets:
Short-term: ₹1600
Medium-term: ₹1700
Long-term: New All-Time High (above ₹1750+)
🛑 Risk Management:
Stop-Loss: ₹1480 or (below retest zone)
📊 Supporting Indicators:
RSI trending upward, currently above 60 (bullish zone)
MACD crossover confirms positive momentum
Volume confirms strength during breakout
📌 Disclaimer: This analysis is for educational and study purposes only. Not a buy/sell recommendation.
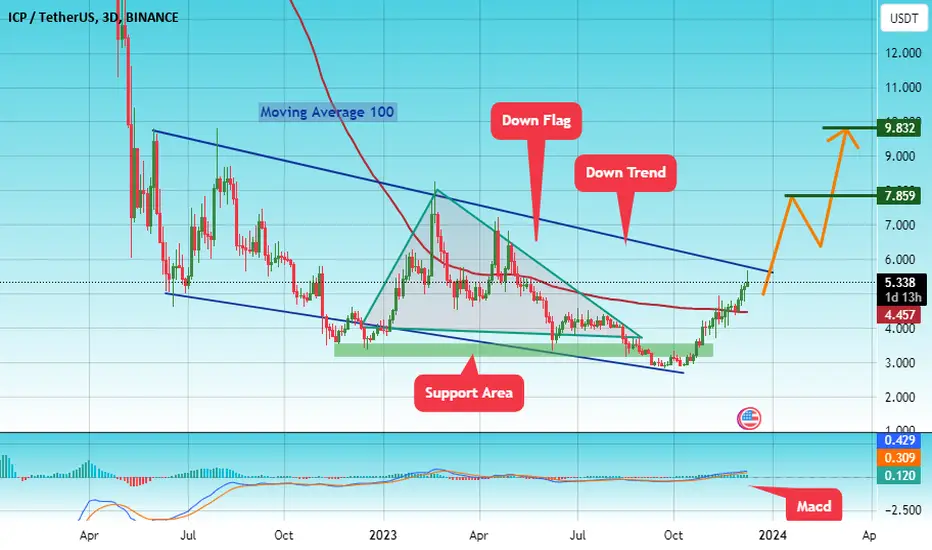
#IPC/USDT#IPC
The price has been moving in a bearish flag since April 2022
We have a strong support area from which the price rebounded
We're about to go up
This rise is supported by the moving average 100 breaking
The price now is 5.33
First goal 7.85
Second goal 7.83
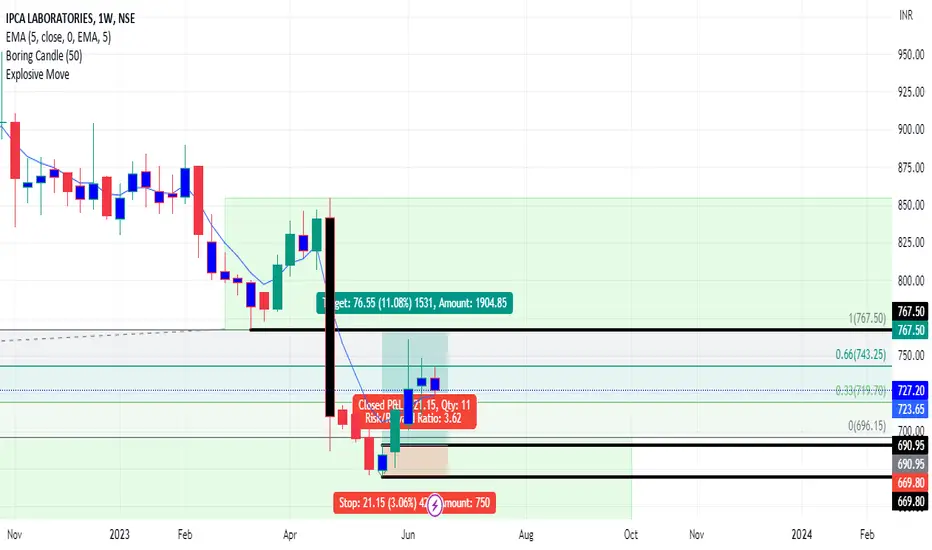
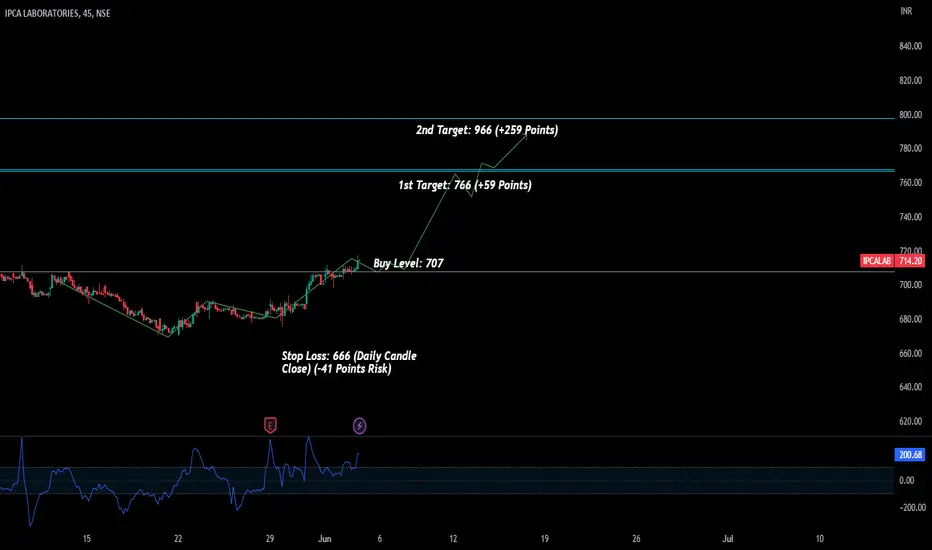
IPCALAB Low Risk Big Profit IdeaAs per my analysis, 707 level was strong resistance of NSE:IPCALAB . Now resistance has been brake and sustained above 707. My idea is to take buy entry at level of 707 with stop loss of 666 (-41 Points Risk). My expected upside target would be 766 (+59) & 966 (+259 Points).
It could be jackpot idea.
Note: This is my personal analysis, only to learn stock market behavior. Thanks.
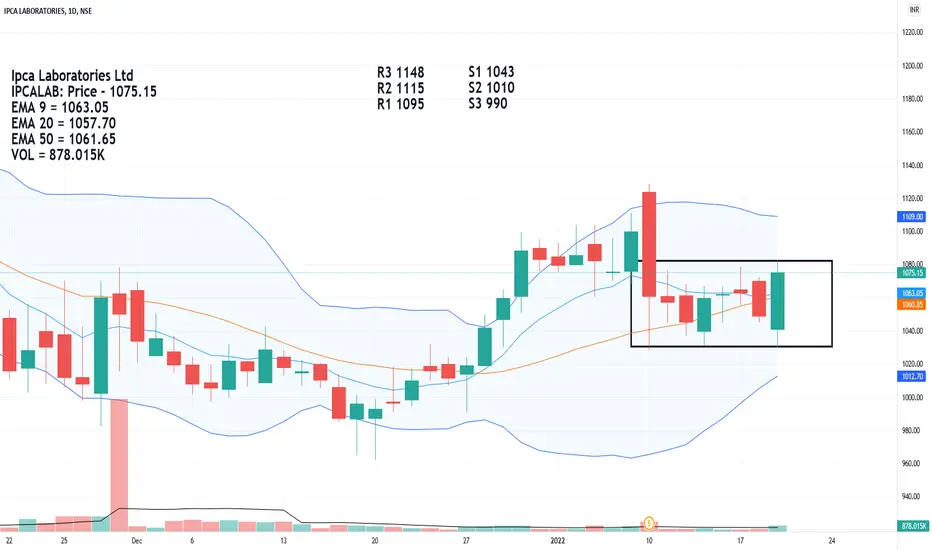
IPCALAB - Bullish engulfingA bullish engulfing candle has been formed on the daily time frame suggesting a good move in the upward direct is very much possible.
There is a good consolidation zone being formed and a breach of the zone(resistance) would surely give a good upward movement in this counter.
For buying the stock should be trading above the levels of 1069 and on the other hand if prices fall below 1056 we could see support areas.
Do not look at the huge red candle as that was the stock split.
Above the zone any big buying that happens will take the price up.
All the best
Your feedback is highly appreciated