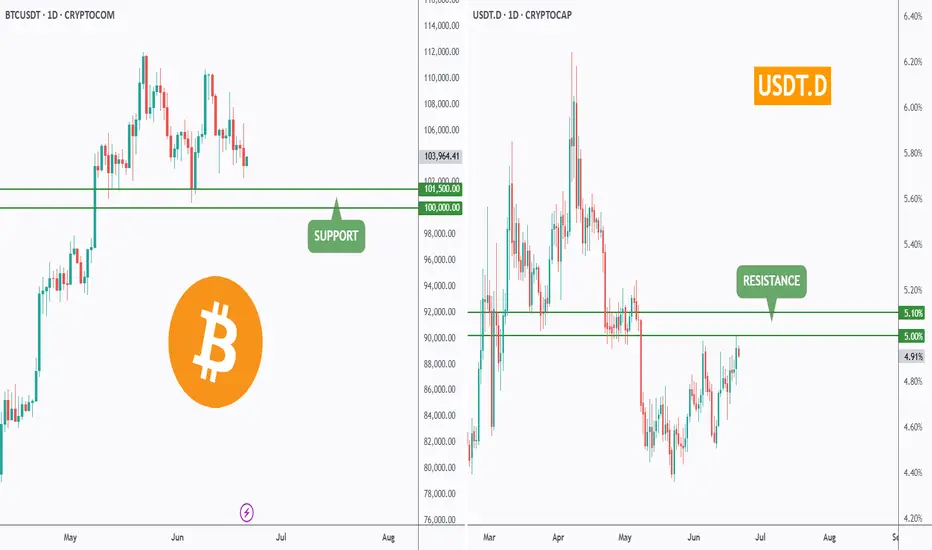
BTC & USDT.D => Bullish Correction Incoming?Hello TradingView Family / Fellow Traders. This is Richard, also known as theSignalyst.
Both BTC and USDT.D are sitting around key rejection zones.
💰 BTC is hovering near the $100,000 level — a major previous low and a psychological round number.
📊 Meanwhile, USDT.D is testing the 5% resistance — a supply zone and another critical round number.
As long as $100,000 holds as support on BTC and 5.1% holds as resistance on USDT.D, we could expect a bullish correction across the crypto market.
What do you think? Will these levels hold or break? 🤔
📚 Always follow your trading plan regarding entry, risk management, and trade management.
Good luck!
All Strategies Are Good; If Managed Properly!
~Rich
Iran
Down the road - Gold Outlook June 30 - July 24, 2025FX_IDC:XAUUSD
📰 The past weeks has been a wild ride for gold prices, caught between the fiery conflict in the Middle East and a deluge of crucial economic data from the U.S. 📈 Adding to this, a detailed technical analysis provides a deeper look into gold's immediate future.
**Geopolitical Drama Unfolds & Peace Prevails!** 🕊️ ceasefire negotiations.
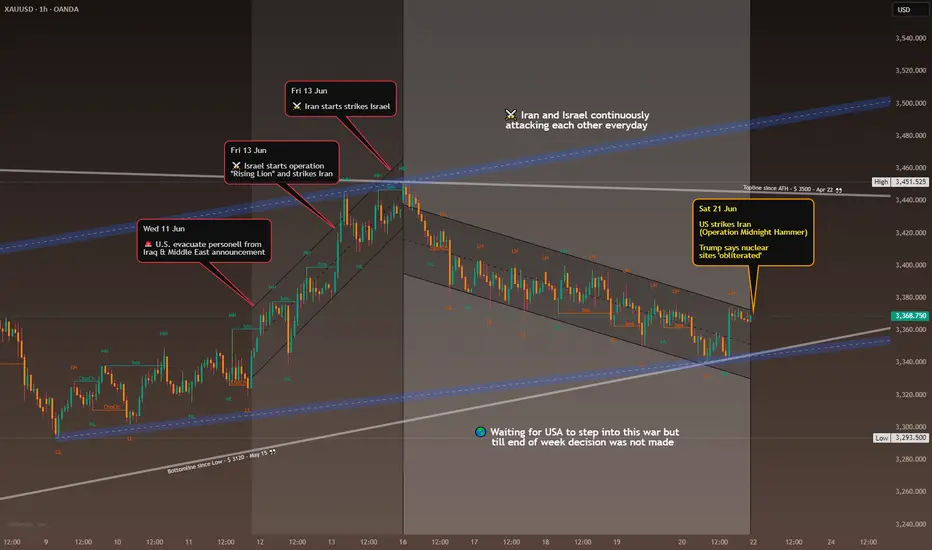
Initially, gold was shrouded in uncertainty 🌫️ due to the Iran-Israel war, with markets bracing for potential U.S. involvement and a full-blown escalation. Daily tit-for-tat attacks between Iran and Israel kept everyone on edge, and the question of U.S. intervention remained a nail-biter 😬, though President Trump did announce a 14-day "timeout".
Then came the dramatic twist on June 21st: "Operation Midnighthammer" saw the U.S. unleash bunker-buster bombs on Iranian uranium enrichment facilities. 💥 Short time later, the U.S. declared mission accomplished, stating their goal of destroying these sites was achieved, and no further attacks would follow.
Iran's response, "Operation Annunciation of Victory," on the following Monday, involved missile strikes on U.S. military bases in Qatar and Iraq. 🚀 Interestingly, these attacks were pre-announced, allowing for safe evacuations and thankfully, no casualties. 🙏
The biggest surprise came from President Trump as he declared, "Congratulations world, it's time for peace!" 🎉 He then brokered a ceasefire between Israel and Iran, which, despite being fragile, largely held, leading to the war's end.🤝 Both nations, as expected, officially claimed victory – a common move to satisfy their citizens. 🏅
Personally, I was genuinely surprised that the U.S.President mediated ceasefire, actually brought the conflict to a close – but it's a welcome outcome! 🙏
**Economic Data & Fed's Steady Hand** 💹🏛️
The cessation of hostilities triggered a steady downward slide in gold prices from June 24th to 27th. ⬇️ This dip initially met some market resistance but it ultimately prevailed, especially with the release of mixed U.S. economic data, which, despite being varied, was generally interpreted positively by the market.
The spotlight also shone on the Federal Reserve, with several representatives speaking and Fed Chair Jerome Powell undergoing a two-day Senate hearing. 🎤👨⚖️ Powell meticulously explained the Fed's rationale for holding interest rates steady, despite market pressures. 🤷 However, recent whispers suggest the Federal Reserve might actually cut rates in September! 😮
## Geopolitical News Landscape 🌍📰
India / Pakistan
Pakistan rejected claims that it supported militant groups active in Indian Kashmir. India issued a formal protest but reported no fresh border clashes during the week.
Outlook 🔮: De-escalation is possible in the short term. However, unresolved disputes over water rights (Indus Treaty) could reignite tensions.
Gaza Conflict
Heavy Israeli airstrikes killed dozens in Gaza, including civilians near aid centers. The UN warned that U.S.-backed aid systems are failing. Humanitarian corridors remain blocked.
Outlook 🔮: Ceasefire talks may resume in July, but success depends on international pressure and safe humanitarian access.
Russia / Ukraine
Russia advanced 36 sq mi in eastern Ukraine, deploying outdated T-62 tanks. Ukraine reinforced defensive lines, aided by Western military packages.
Outlook 🔮: The front remains volatile. Sustained Western support will be key to halting further Russian gains.
U.S. – China Trade War
A breakthrough deal was signed for China to fast-track rare-earth exports to the U.S. Talks on tech transfer and tariffs continue behind closed doors.
Outlook 🔮: A phased de-escalation is possible, but deep trust issues linger, especially over semiconductors and AI.
🌐 Global Trade War
Several countries, including Brazil and Thailand, imposed fresh restrictions on Chinese imports, echoing the U.S. stance. Global supply chains remain fragmented.
Outlook 🔮: Trade blocs like the EU and Mercosur may take on greater importance as countries hedge against rising protectionism.
Trump vs. Powell
Fed Chair Powell resisted political pressure, stating rate cuts are unlikely before September. Trump called him “stubborn” and demanded immediate easing.
Outlook 🔮: The Fed’s independence is under strain. If Trump wins re-election, major policy shifts could follow.
📈 U.S. Inflation
Despite tariffs, core inflation remains elevated. Powell warned of persistent price pressures. Trump insists the Fed should cut rates to boost growth.
Outlook 🔮: A rate cut later in 2025 is possible—if labor market data weakens. Until then, inflation will remain politically explosive.
## Technical View 📐📈
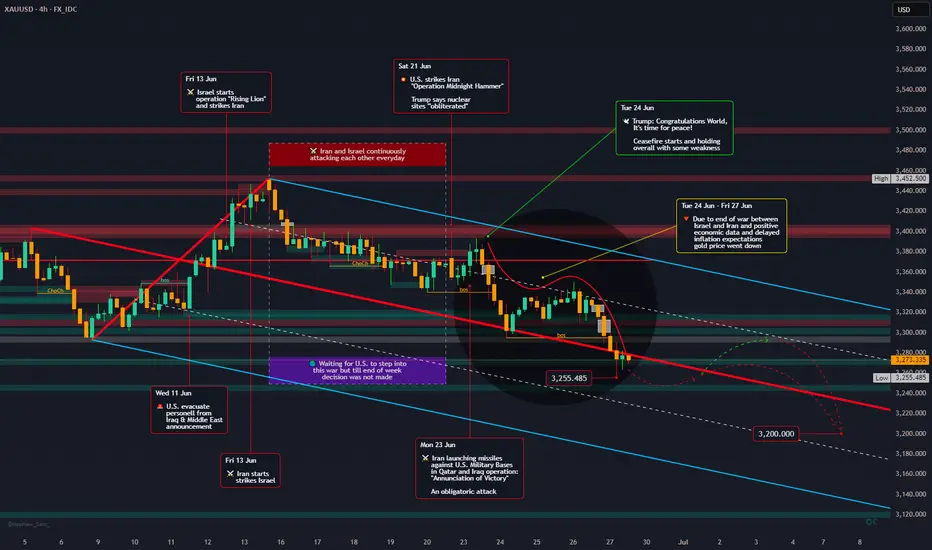
**Current Market Context:** Gold plummeted to $3,273.67 USD/t.oz on June 27, 2025, marking a 1.65% drop from the previous day, which confirms the strong bearish momentum. The price action shows a significant retreat from recent highs around $3,400.
**ICT (Inner Circle Trader) Methodology Analysis:**
* **Market Structure:**
The trend is clearly bearish, with a definitive break of structure (BOS) to the downside.
* **Order Blocks:**
Several bearish order blocks have been identified at prior resistance levels, specifically in the $3,380-$3,400 range.
* **Fair Value Gaps (FVG):**
The aggressive sell-off has created multiple imbalances, particularly in the $3,350-$3,320 range.
* **Liquidity Pools:**
Buy-side liquidity above $3,400 has been swept. Sell-side liquidity is now accumulating below the $3,270 lows, which is the current target zone.
* **Session Analysis:**
The London session showed aggressive selling, followed by a continuation of bearish momentum in the New York session. The Asia session could see consolidation or further declines.
* **Smart Money Concepts:**
Heavy selling pressure suggests "smart money" distribution. There's been strong bearish displacement from $3,380 down to $3,270, indicating the market is currently in a "sell program" phase.
**Gann Analysis:**
* **Gann Angles & Time Cycles:**
The primary 1x1 Gann angle has been broken, pointing to continued weakness. Key price squares indicate resistance at $3,375 (25²) and support at $3,249 (57²). Daily cycles suggest a potential turning point around June 30-July 1, while weekly cycles indicate continued pressure through early July.
* **Gann Levels:**
* Resistance: $3,375, $3,400, $3,481 (59²)
* Support: $3,249, $3,136, $3,025
**Fibonacci Analysis:**
* **Key Retracement Levels (from recent swing high to low):**
* 78.6%: $3,378 (Strong resistance)
* 61.8%: $3,348 (Key resistance zone)
* 50.0%: $3,325 (Psychological level)
* 38.2%: $3,302 (Minor resistance)
* 23.6%: $3,285 (Current area of interest)
* **Fibonacci Extensions (Downside Targets):**
* 127.2%: $3,245
* 161.8%: $3,195
* 261.8%: $3,095
* **Time-Based Fibonacci:**
The next significant time cluster is July 2-3, 2025, with a major cycle completion expected around July 15-17, 2025.
**Institutional Levels & Volume Analysis:**
* **Key Institutional Levels:**
* Major Resistance: $3,400 (psychological + institutional)
* Secondary Resistance: $3,350-$3,375 (order block cluster)
* Primary Support: $3,250-$3,270 (institutional accumulation zone)
* Major Support: $3,200 (monthly pivot area)
* **Volume Profile Analysis:**
* High Volume Node (HVN): $3,320-$3,340 (fair value area)
* Low Volume Node (LVN): $3,280-$3,300 (potential acceleration zone)
* Point of Control (POC): Currently around $3,330
**Central Bank & Hedge Fund Levels:**
Based on recent COT data and institutional positioning, heavy resistance is seen at $3,400-$3,430, where institutions likely distributed. An accumulation zone for "smart money" re-entry is anticipated at $3,200-$3,250.
**Cycle Timing Analysis:**
* **Short-Term Cycles (Intraday):**
Bearish momentum is expected to continue for another 12-18 hours. A daily cycle low is likely between June 29-30, with a potential reversal zone on July 1-2 for the 3-day cycle.
* **Medium-Term Cycles:**
The current weekly cycle is in week 3 of a 4-week decline. The monthly cycle indicates a mid-cycle correction within a larger uptrend. For the quarterly cycle, Q3 2025 could see a major low formation.
* **Seasonal Patterns:**
July-August is typically a weaker period for gold ("Summer Doldrums"). September has historically been strong for precious metals ("September Effect"), setting up for a potential major move higher in Q4 2025 ("Year-End Rally").
**Trading Strategy & Levels:**
* **Bearish Scenario (Primary):**
* Entry: Sell rallies into the $3,320-$3,350 resistance zone.
* Targets: $3,250, $3,200, $3,150.
* Stop Loss: Above $3,380.
* **Bullish Scenario (Secondary):**
* Entry: Buy support at $3,250-$3,270 with confirmation.
* Targets: $3,320, $3,375, $3,400.
* Stop Loss: Below $3,230.
**Key Events to Watch:**
* **US PCE Data:**
Fresh downside risks could emerge ahead of the US Personal Consumption Expenditures (PCE) Price Index data release.
* **Fed Communications:**
Any hawkish rhetoric from the Federal Reserve could further pressure gold.
* **Geopolitical Developments:**
Ongoing global events could trigger safe-haven demand.
**Conclusion:**
The technical picture for gold suggests continued short-term weakness, with the metal testing its 2025 trend line at $3,290 following last week's rejection at the $3,430 resistance. However, the longer-term outlook remains constructive, given gold's robust performance year-to-date. Key support at $3,250-$3,270 will be crucial in determining the next significant price movement.
**Upcoming Week's Economic Calendar (June 29 - July 4, 2025):** 🗓️🌍
🗓️ Get ready for these important economic events (EDT)
* ** Sunday , June 29, 2025**
* 21:30 CNY: Manufacturing PMI (Jun) - Forecast: 49.6, Previous: 49.5
* ** Monday , June 30, 2025**
* 09:45 USD: Chicago PMI (Jun) - Forecast: 42.7, Previous: 40.5
* ** Tuesday , July 1, 2025**
* 05:00 EUR: CPI (YoY) (Jun) - Forecast: 2.0%, Previous: 1.9%
* 09:30 USD: Fed Chair Powell Speaks
* 09:45 USD: S&P Global Manufacturing PMI (Jun) - Forecast: 52.0, Previous: 52.0
* 10:00 USD: ISM Manufacturing PMI (Jun) - Forecast: 48.8, Previous: 48.5
* 10:00 USD: ISM Manufacturing Prices (Jun) - Forecast: 70.2, Previous: 69.4
* 10:00 USD: JOLTS Job Openings (May) - Forecast: 7.450M, Previous: 7.391M
* ** Wednesday , July 2, 2025**
* 08:15 USD: ADP Nonfarm Employment Change (Jun) - Forecast: 80K, Previous: 37K
* 10:30 USD: Crude Oil Inventories - Forecast: -5.836M
* ** Thursday , July 3, 2025**
* Holiday: United States - Independence Day (Early close at 13:00) 🇺🇸⏰
* 08:30 USD: Average Hourly Earnings (MoM) (Jun) - Forecast: 0.3%, Previous: 0.4%
* 08:30 USD: Initial Jobless Claims - Forecast: 239K, Previous: 236K
* 08:30 USD: Nonfarm Payrolls (Jun) - Forecast: 129K, Previous: 139K
* 08:30 USD: Unemployment Rate (Jun) - Forecast: 4.2%, Previous: 4.2%
* 09:45 USD: S&P Global Services PMI (Jun) - Forecast: 53.1, Previous: 53.1
* 10:00 USD: ISM Non-Manufacturing PMI (Jun) - Forecast: 50.3, Previous: 49.9
* 10:00 USD: ISM Non-Manufacturing Prices (Jun) - Forecast: 68.7
* ** Friday , July 4, 2025**
* All Day: Holiday - United States - Independence Day 🎆
**Gold Price Forecast for the Coming Week** 🔮💰
Given last week's market movements, there's a strong likelihood that the downward trend in gold prices will continue.🔽 However, fresh news can always flip the script! 🔄 As of now, I expect gold to dip further to $3255 by mid-next week. Yet, a brief rebound towards $3300 isn't out of the question before a potential drop to $3200 by week's end or early the following week. 🤞
Please take the time to let me know what you think about this. 💬
-------------------------------------------------------------------------
This is just my personal market idea and not financial advice! 📢 Trading gold and other financial instruments carries risks – only invest what you can afford to lose. Always do your own analysis, use solid risk management, and trade responsibly.
Good luck and safe trading! 🚀📊
Gold Bounces from Demand Zone – Next Targets in Sight!By analyzing the gold chart on the 4-hour timeframe, we can see that today, price once again dipped into our key demand zone (Bullish Rejection Block) between $3245 and $3262, where it faced strong buying pressure and rallied up to $3296.
Currently, gold is trading around $3281, and as long as price holds above $3273, we expect further upside. The next potential targets are $3294, $3300, and $3309.
🎥 If you enjoyed this video analysis and found it helpful, please show your support with a LIKE and COMMENT below!
These video-style breakdowns take time and effort, and I’ll only continue them with your support 🙌
Your engagement is my biggest motivation to keep going 💛
Thanks for being part of the journey!

Natural Gas plummets - Israel and Iran PeaceIran and Israel de escalation is causing nat gas to plummet.
Fear of the "Hormuz Strait" closing have slipped away!
Roughly 20% of global liquefied natural gas (LNG) trade flows through the Strait of Hormuz, primarily from Qatar (~9.3 Bcf/d) with smaller volumes from the UAE (~0.7 Bcf/d)
In 2024, approximately 83–84% of those LNG volumes were destined for Asian markets—China, India, South Korea

GOLD H4 Accumulation Fractal Target is 4 000 USD 🏆 Gold Market Mid-Term Update
📉 Gold Pullback: XAU/USD drifted below $3,350, falling to around $3,325–$3,330 amid easing Middle East tensions and a firmer U.S. dollar.
🤝 Ceasefire Effect: De-escalation in Israel-Iran hostilities reduced safe-haven demand, capping gold’s upside.
💵 Fed & USD Dynamics: Fed Chair Powell reaffirmed that policymakers aren’t in a rush to cut rates. A softer dollar provided some support, but intraday USD strength weighed on gold.
📊 Technical Watch: Gold remains in a bearish short-term structure below the 200-period SMA. Resistance lies near $3,368–$3,370; support cluster begins around $3,300, with potential slide to $3,245–$3,200 if broken.
🔮 Forecast Updates:
• Citi Research flagged that gold may have peaked and could undergo further softening in Q3-2025.
• WSJ notes gold posting weekly gains, with futures steadying at $3,339/oz.
• Another WSJ report suggests potential for new highs later this year—forecasting an average of $3,210/oz in 2025, a 35% increase.
⚠️ Market Split: Opinions are fragmented—Wall Street sees mixed short-term direction, while Main Street maintains a bullish stance ahead of key U.S. data (GDP, PCE, jobless claims).
🏠 Central Bank Demand: Sustained demand from central banks reinforces gold’s structural support.
🔮 Live Price Snapshot: Futures are up ~0.2%, trading at $3,339.20/oz today.
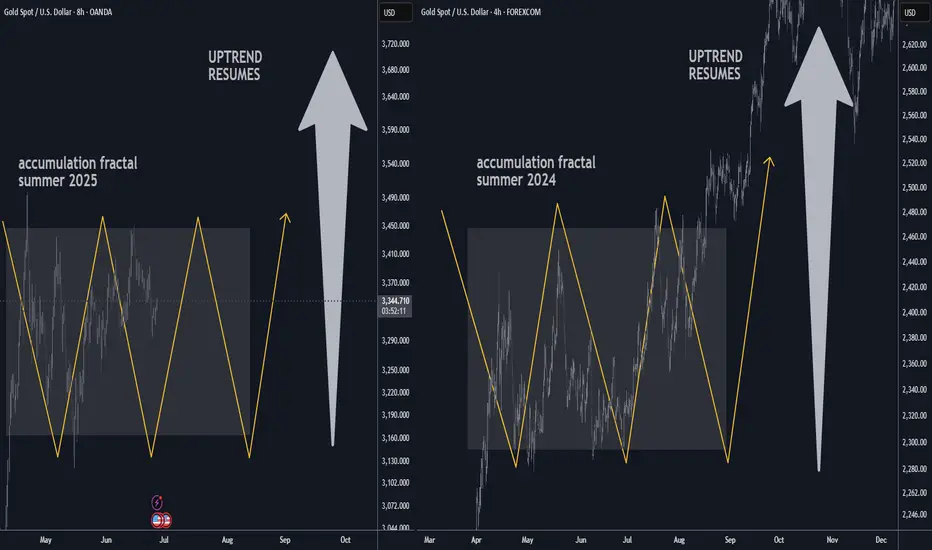
📊 Technical Outlook Update
🏆 Bull Market Overview
▪️ A pullback is currently unfolding
▪️ Heavy resistance seen at $3,500
▪️ Possible re-accumulation underway
▪️ Scenario mirrors summer 2024
▪️ Accumulation before breakout
▪️ Downside protected around $3,150
▪️ Short-term range trading in progress
▪️ Bulls maintain strategic upper hand
⭐️ Recommended Strategy
▪️ Buy dips within the range
▪️ Look for entries near $3,150 S/R zone
▪️ Long-term bullish target of $4K remains intact
Gold Holding Strong – Eyes on $3400 and Beyond! (READ)By analyzing the gold chart on the 4-hour timeframe, we can see that after our last analysis, the price corrected down to $3341, then rallied back up to $3399. Currently, gold is trading around $3373, and if it manages to hold above $3355, we can expect further upside movement.
Potential bullish targets are $3400, $3417, $3450, and $3468.

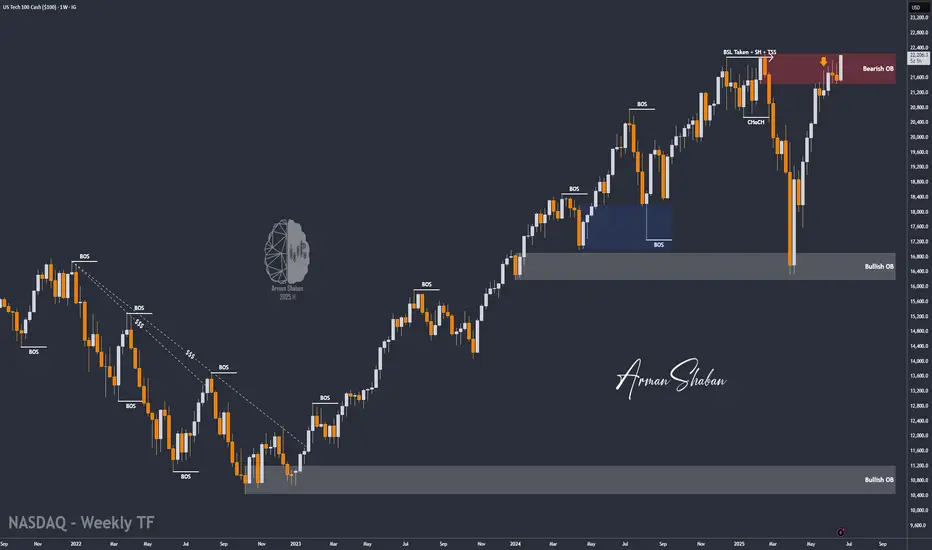
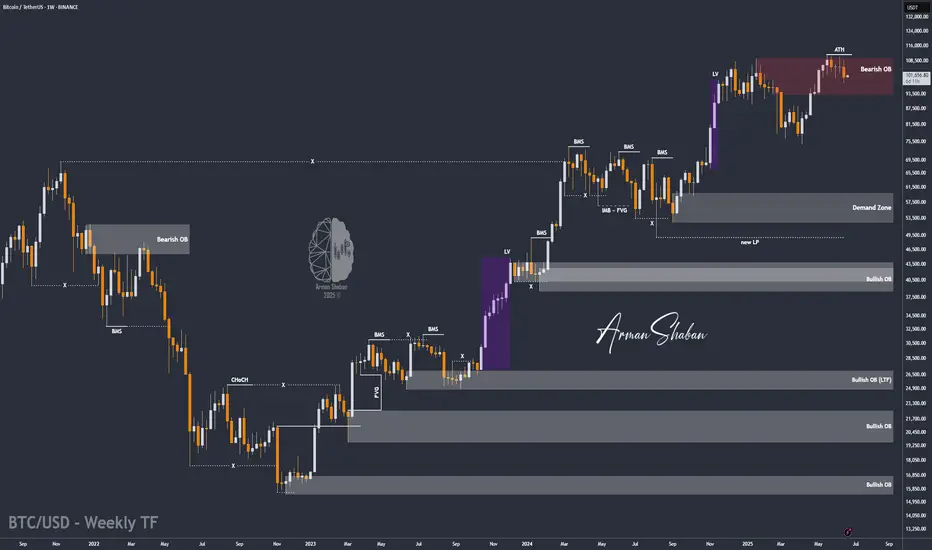
Nasdaq Surges on Ceasefire Hopes – New All-Time Highs Ahead?By analyzing the #Nasdaq chart on the weekly timeframe, we can see that the index experienced a strong rally following the ceasefire announcement between Iran and Israel, climbing as high as 22,200 so far. If the ceasefire holds and tensions continue to ease, we could see a new all-time high for the Nasdaq.
Potential bullish targets for this move are 22,400, 23,200, and 24,000.
Please support me with your likes and comments to motivate me to share more analysis with you and share your opinion about the possible trend of this chart with me !
Best Regards , Arman Shaban
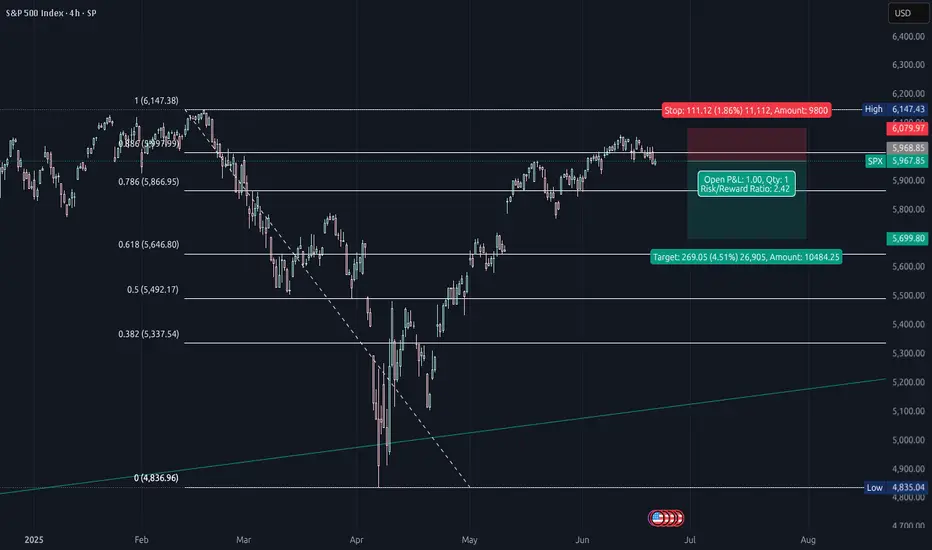
SPX short analysisLike I wrote in my EUR/USD analysis you never know what could happened.
USA bombed Iran!
This could have huge impact on the US market next week.
My guess is temporarily short... At least to close this gap in spot price of SPX.
Since we're still in bearish market, until we see new highs, and this could be catalyst for another sell off. So the jump could be even bigger and we could see new ATH this year.
For now, I'm seeking a position to short tomorrow after market is open.
This is my entry mark.
There will be higher volatility. However, I expect US market to open in the red, close the gap and to sell off again.
We shall see!
Trade safe this one :)
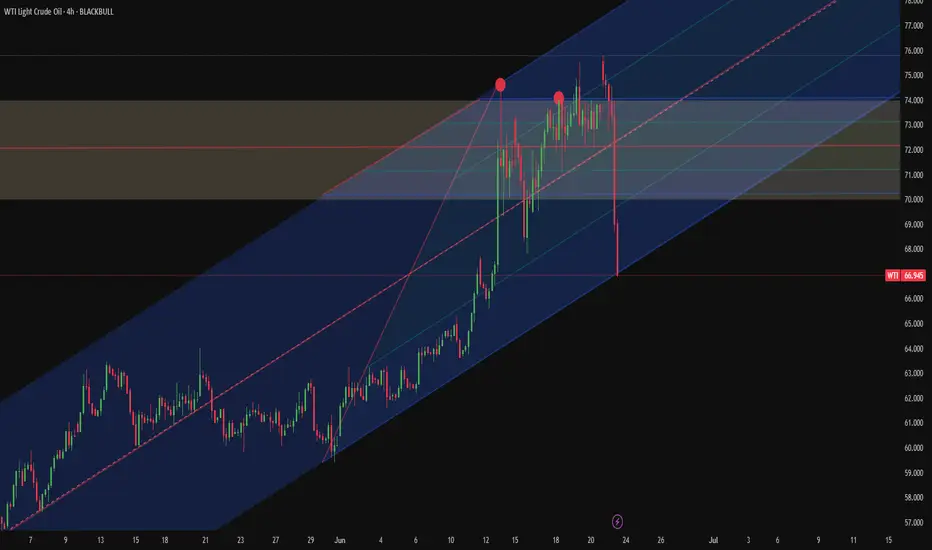
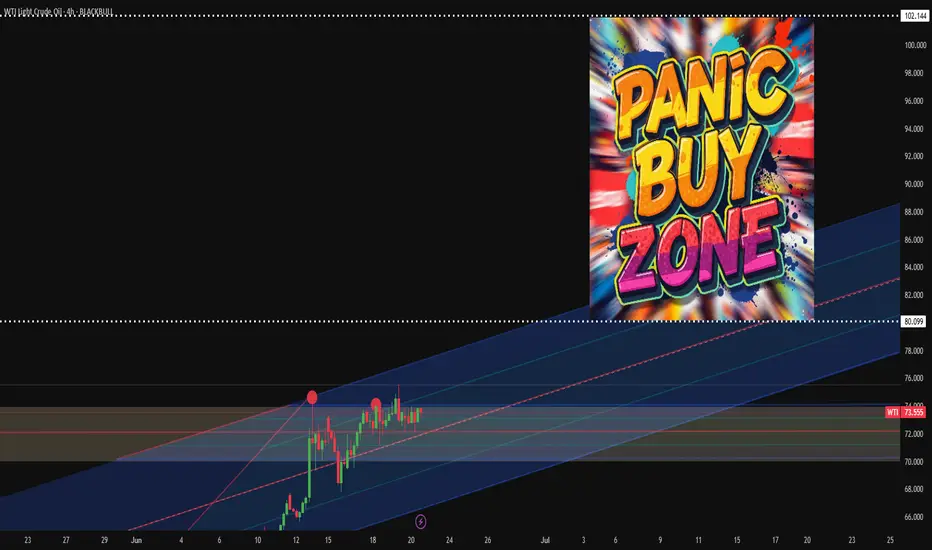
Is the oil market signalling de-escalation?After an initial 6% spike at the open, U.S. crude oil futures reversed sharply—falling into negative territory—as markets priced in the possibility that Iran's latest retaliation may be more symbolic than escalatory.
According to President Donald Trump, Iran gave advance notice before launching missiles at a U.S. base in Qatar, allowing defences to intercept the attack and resulting in no reported casualties.
While Tehran publicly described the strike as “devastating and powerful,” the lack of impact on the ground and the pre-warning have fuelled speculation that Iran was aiming to save face without triggering a broader conflict.
The swift reversal in oil prices reflects that sentiment. For now, the market appears to be signaling that escalation may pause here.
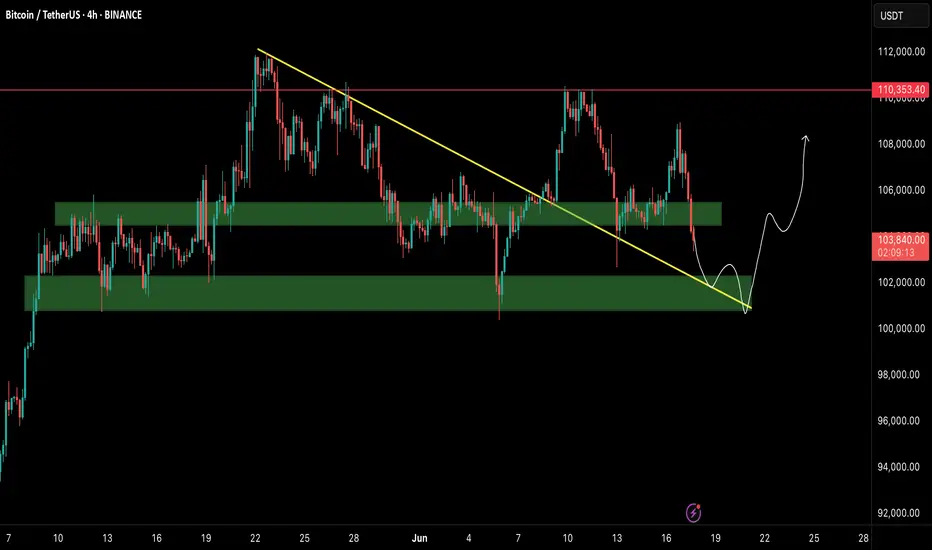
BTCUSDT Update — Big Macro Forces In Play!!Hey Traders!
If you’re finding value in this analysis, smash that 👍 and hit Follow for high-accuracy trade setups that actually deliver!
Bitcoin once again testing key support levels as global tensions continue to fuel uncertainty in the markets.
Chart Overview:
BTC broke down from short-term resistance and is now retesting the major support zone between $102K–$103K. The structure still remains within a broader consolidation range, but this support zone is absolutely critical for bulls to defend.
Immediate Resistance: $106K → $110K
Immediate Support: $102K → $100K
A breakdown below $100K could trigger deeper liquidations towards $95K–$98K, while a successful defense here could push BTC back toward previous highs.
Geopolitical Impact:
Global headlines are heavily influencing risk assets right now:
🇮🇱 Israel-Iran tensions are escalating.
🇺🇸 The US is signaling stronger involvement diplomatically, adding more fear to markets.
📉 Traditional markets have already started to show signs of caution.
Bitcoin, as a risk asset, remains vulnerable to these global macro shocks in the short term.
The Game Plan Right Now:
If we see sustained support at $102K–$103K, there’s still room for a relief bounce towards $106K–$110K in the near term.
However, if global tensions escalate further, expect increased volatility with downside liquidity grabs.
Stay cautious with tight risk management. Macro headlines are still driving sudden sentiment shifts.
📊 My Bias:
Watching for potential sweep of $102K with possible reversal structure forming. Any clear reclaim of $105K may signal a local bottom.
📝 Key Takeaway:
Global narratives are bigger than technicals right now. The next few days could dictate whether BTC holds or faces another sharp liquidation event.
Stay patient. Stay disciplined. And most importantly: manage your risk.
👉 Follow for more real-time updates as we track both price action and macro headlines impacting crypto.
Bitcoin at Risk: Will Geopolitical Tensions Push BTC Below $90K?By analyzing the #Bitcoin chart on the weekly timeframe, we can see that the price continued its correction amid rising tensions and conflict between Iran and Israel, dropping to as low as $98,000. Currently, Bitcoin is trading around $101,000, and if these tensions escalate further — especially if Iran decides to close the Strait of Hormuz — it could significantly impact global markets, and Bitcoin would not be an exception.
If BTC fails to hold above $100,000 by the end of the week, a continuation of the drop toward $90,000 is possible.
Please support me with your likes and comments to motivate me to share more analysis with you and share your opinion about the possible trend of this chart with me !
Best Regards , Arman Shaban
WTI Short PositionBelieve stability within the Middle East market will bring the price down so it could rebound back up once liquidity has been cleared
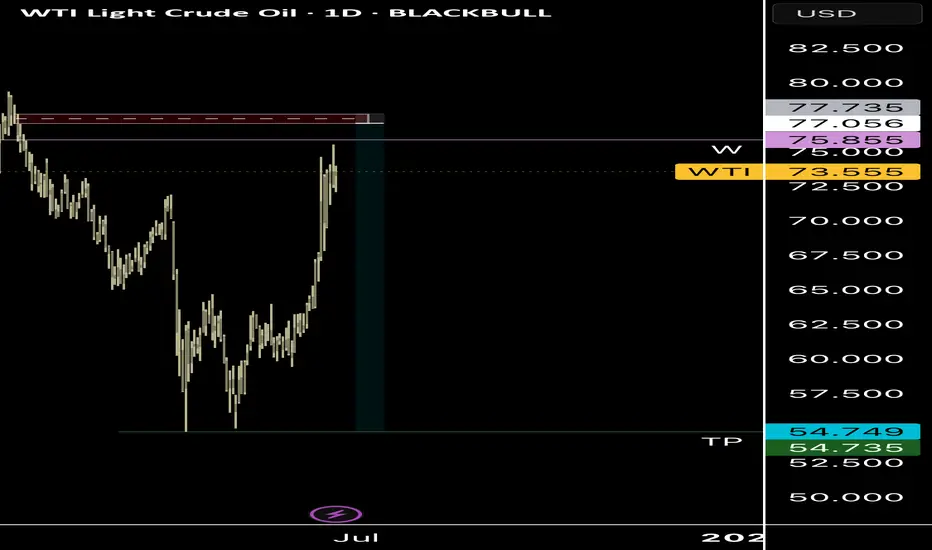
Oil panic buying after Iran Strikes?President Donald Trump has confirmed that the U.S., in coordination with Israel, has conducted three strikes on Iranian nuclear facilities.
Will there be panic buying of WTI and Brent at the open?
In response, Iran’s parliament has approved a proposal to close the Strait of Hormuz, a key global oil shipping route. The final decision lies with Iran’s Supreme National Security Council and Supreme Leader Ayatollah Ali Khamenei.
If a blockade is enforced, oil prices could rise sharply. ClearView Energy Partners estimates a short-term closure could add between $8 and $31 per barrel. JP Morgan has suggested that a full-scale conflict and complete shutdown could drive prices to $130.
Can 6 Holes in a mountain move gold this week? 23-27 June 2025Hello fellow traders of OANDA:XAUUSD
All about last week here
Since Israel's attack on Iran on Friday, June 13th, aimed at destroying all facilities for potential nuclear weapons production, the gold price initially rose to $3450. This surge lasted until Monday, June 16th, during the European session, but then began to fall from there. 📉🔻
Signs of potential peace talks and a swift end to the conflict largely made investors hesitant to invest. Throughout the week, the gold price mostly reacted negatively to higher prices due to investor uncertainty. This was further exacerbated by the fact that the US had not yet entered this war, which Israel initiated. 🕊️😟
However, since the US attack with bunker-busting bombs on the nuclear facilities on June 21st, they are now part of the conflict. Not least for this reason, they might become the target of retaliatory strikes, as already announced by the Iranian regime. 💣💥
If one looks at the timeline of news and announcements regarding potential US involvement in this war, and the two-week waiting period announced by President Trump, it will certainly become clear that this was nothing more than tactics. It was foreseeable that the US would become involved in the conflict, not least because the Israelis lack the appropriate weapons. The possibility of the US providing these weapons to the Israelis was also in the news; however, it then became clear that this specific bomb could only be used by the Stealth Bomber B2. This made it evident that it was only a matter of timing when it would happen, and they naturally wanted to keep that secret – anything else would be nonsensical anyway. 🤫✈️
What's to be expected next? Regarding this conflict, I hope for a swift end. 🕊️🙏 As for the gold price, well, I still believe in a new All-Time High (ATH). 🚀🌟 Will it come this week? Possibly. But the much more important question is whether the Iranian regime will truly dare to attack the US and exact revenge. 🤔⚔️
Market Structure:
The chart shows a clear shift from bullish 🐂 to bearish 🐻 structure. We see a significant high around June 13th at approximately $3,451, followed by a break of structure with lower highs and lower lows forming. 📉
Key Levels: 🔑
Premium levels: The area around $3,440-$3,451 represents premium pricing where institutional selling likely occurred. 💎
Fair Value Gaps: There appear to be several imbalances/gaps that price may seek to fill, particularly around the $3,380-$3,400 zone. 🎯
Order Blocks: The consolidation areas around $3,320-$3,340 and $3,380-$3,400 represent potential institutional order blocks. 🧱
Institutional Levels: 🏦
Psychological resistance: $3,450 level acted as significant resistance. 🚧
Current support cluster: $3,320-$3,340 area showing multiple touches. 🛡️
Liquidity zones:
The recent lows around $3,293 represent buy-side liquidity that institutions may target. 💧
Fibonacci Analysis: 📏
Based on the major swing from the low around June 9th ($3,300) to the high on June 13th ($3,451):
50% retracement: ~$3,375 (already tested and failed) 📉
61.8% retracement: ~$3,357 (near current price action) ✨
78.6% retracement: ~$3,337 (aligns with support cluster) ✅
Gann Concepts: 🔢
The timing shows potential significance around the June 13th high, with subsequent price action following geometric price relationships. The current price action around $3,328 suggests we're testing important Gann square relationships from the cycle highs. 📐
Cycle Timing: ⏰
The approximately 10-day cycle from low to high to current retracement suggests we may be in a corrective phase that could extend into late June, with potential for cycle lows around the June 25-27 timeframe based on typical precious metals cycles. 🗓️
Current Assessment:
Price appears to be in a corrective phase testing the $3,320-$3,340 institutional support zone. A break below could target the cycle lows, while a hold here with reclaim of $3,380 could indicate accumulation for the next leg higher. ⚖️🔍
Please take the time to let me know what you think about this. 💬
-------------------------------------------------------------------------
This is just my personal market idea and not financial advice! 📢 Trading gold and other financial instruments carries risks – only invest what you can afford to lose. Always do your own analysis, use solid risk management, and trade responsibly.
Good luck and safe trading! 🚀📊
Beyond the Headlines - Gold Outlook June 16-20, 2025Beyond the Headlines: Gold's Ascent Amidst Global Shifts & Key Technicals 🌐🚀
Everything about the last week can be found here:
OANDA:XAUUSD 💰📈
We all know what's going on, I believe. Israel struck Iran 💥, and this conflict will likely take a bit before things cool down. 🥶
---
## Geopolitical News Landscape 🌍📰
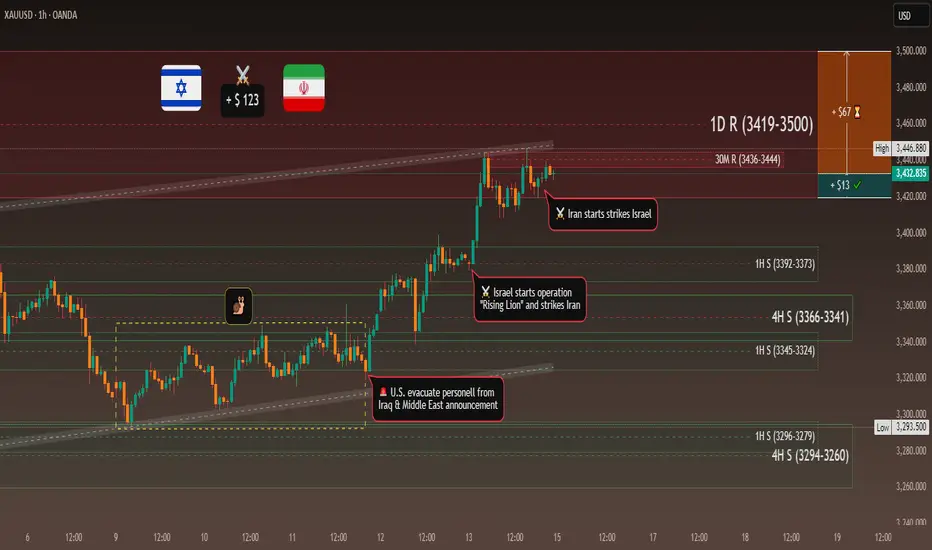
### Israel / Iran
Since June 12, Israel launched "Operation Rising Lion," targeting Iranian nuclear sites like Natanz and Esfahan – over 128 killed, Iran claims. 🇮🇷 retaliated with missile and drone strikes on Haifa and Tel Aviv, killing at least 10. 🚀
**Outlook:** 🔥 Tensions are spiraling. Without urgent mediation, full-scale regional war remains a real risk. 💣
### India / Pakistan
Since the May ceasefire, few clashes have occurred. However, both navies increased readiness, signaling potential escalation at sea. 🚢
**Outlook:** ⚖️ Peace is fragile. A strategic dialogue is key to avoiding a renewed border or maritime conflict. 🙏
### Gaza Conflict
Between June 7–15, Israeli strikes killed at least 41 Palestinians, including 8 near an aid center in Rafah. Over 55,000 total deaths, and famine is looming. 💔
**Outlook:** 🆘 Gaza remains a humanitarian catastrophe. Global pressure for access and a ceasefire must intensify. 🕊️
### Russia / Ukraine
June 13–15: Russia returned the bodies of 1,200 Ukrainian soldiers in a rare POW swap gesture. 🤝 Fighting remains intense in Sumy and Toretsk; Russia hit a major oil refinery. 🏭
**Outlook:** 🕊️ While symbolic moves continue, no peace is in sight – battlefield outcomes will shape diplomacy. ⚔️
### U.S. - China Trade War
The U.S. hiked tariffs to 55% on key Chinese goods. 🇺🇸🇨🇳 responded with 10% on U.S. imports. Talks yielded a partial truce, but military-use rare earths remain unresolved. 💻
**Outlook:** 🔧 Tech remains the battleground. Without progress on critical materials, the trade war may deepen. 📉
### Global Trade War
The OECD revised global growth downward due to rising tariffs from the U.S. targeting 🇨🇳, 🇲🇽, 🇨🇦. Global trade volume is expected to shrink by 0.2–1.5%. 📉
**Outlook:** ⛓️ Supply chain disruption is spreading. Global trade will stay under pressure without coordinated policy. 🌍➡️🌍
### Trump vs. Powell
Trump labeled Powell a "numbskull" for not cutting rates, suggesting he might "force something" if re-elected. 🗳️ The Fed maintains policy independence ahead of a critical June decision. 🏛️
**Outlook:** ⚔️ Political pressure on the Fed is mounting. Expect more friction as the election cycle heats up. 🔥
### U.S. Inflation
CPI rose 2.4% YoY in May (from 2.3%); Core CPI held steady at 2.8%. Monthly growth was modest at 0.1%. Key rises were seen in healthcare and vehicle prices. 🚗🏥
**Outlook:** Inflation is stable but sticky. 🚦 The Fed will likely hold rates steady until clearer disinflation signals appear. 📊
---
## Technical View 📐📈
### Market Structure:
Gold shows a clear **bullish market structure** with higher highs and higher lows. ⬆️ Recent price action suggests we're in a strong uptrend with institutional buying pressure. 🏦
### Key Levels:
* The chart shows a significant low around the **$3,245 area** (marked as "Low") which could act as a key institutional support level. 💪
* The current high near **$3,446** represents a potential institutional resistance zone. 🛑
* Look for potential **order blocks** around the **$3,380-$3,400 range** where price consolidated before the recent breakout. 🧱
### Fair Value Gaps (FVG):
There appear to be several gaps in the price action during volatile moves, particularly during strong rally phases. These could act as future support/resistance areas. 📉📈
### Gann Analysis:
The price movement shows strong adherence to Gann principles:
* The rally from the low follows a steep angle, suggesting strong momentum. 🚀
* Key Gann angles would place support around the **$3,300-$3,320 zone**. 📐
* The current price near **$3,436** is testing natural resistance levels based on Gann square calculations. 📏
### Fibonacci Levels:
From the significant swing low to the current high:
* 23.6% retracement: ~$3,395 📉
* 38.2% retracement: ~$3,370 📉
* 50% retracement: ~$3,345 📉
* 61.8% retracement: ~$3,320 📉
The golden ratio levels suggest key support on any pullback would be around the **$3,370-$3,345 zone**. ✨
### Institutional Levels:
* **Weekly/Monthly Levels:** The **$3,400** and **$3,450** areas appear to be significant institutional levels based on round numbers and previous price action. 🏦💰
* **Smart Money:** The accumulation pattern before the breakout suggests institutional participation. 🧠💡
### Cycle Timing:
Based on the timeframe (appears to be 30-minute bars from May 26-June 15):
* We're seeing approximately **3-week cycles** in the major moves. 🗓️
* The current rally phase appears to be in its mature stage. 🌳
* The next potential cycle turn could be approaching, suggesting caution for new longs at current levels. ⚠️
---
### Trading Considerations:
* Watch for rejection at current levels near **$3,446**. 📉
* Key support confluence around **$3,370-$3,345** for potential re-entry. 🎯
* Volume and momentum divergences would be critical for timing any reversal. 📊🔄
Other indicators tend to show bullish scenario enhancements. 🚀
Gold has formed a ** Standard Bullish Flag pattern ** over a time from early April till today. 🚩🐂
Also, the structure of a ** reverse Head & Shoulders ** is existing and has broken the neckline! 🔄🗣️
Another indicator is an existing "** Ascending Bull Flag **." ⬆️🚩
Please take the time to let me know what you think about this. 💬
-------------------------------------------------------------------------
This is just my personal market idea and not financial advice! 📢 Trading gold and other financial instruments carries risks – only invest what you can afford to lose. Always do your own analysis, use solid risk management, and trade responsibly.
Good luck and safe trading! 🚀📊
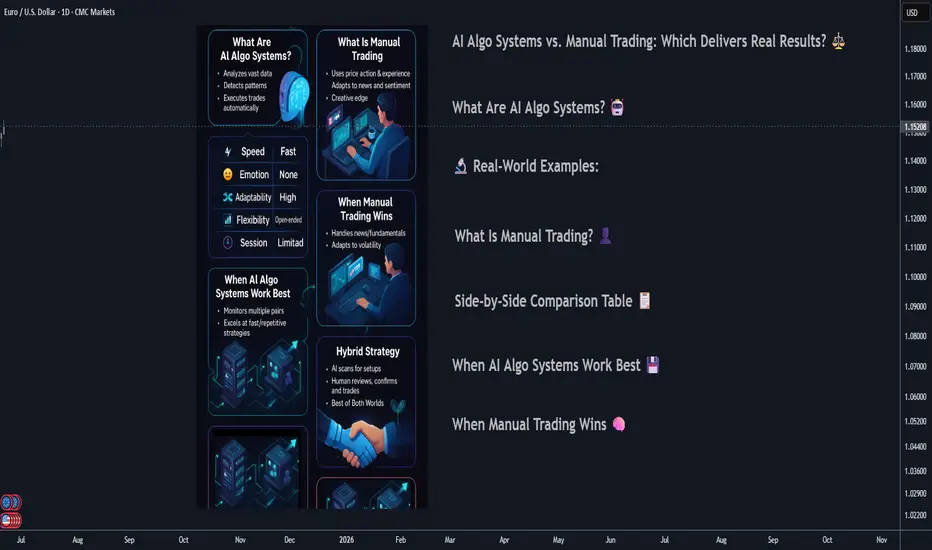
AI Algo Systems vs. Manual Trading: Which Delivers Real Results?AI Algo Systems vs. Manual Trading: Which Delivers Real Results? ⚖️
________________________________________
Introduction
With the explosive rise of artificial intelligence (AI) in financial markets, traders everywhere are asking the million-dollar question:
Should I trust my trades to automation, or keep my hands on the wheel? 🧠🤖
This guide offers a real-world, side-by-side comparison between AI-powered algorithmic trading systems and traditional manual trading. We’ll highlight where each method dominates, when they fail, and how you can combine both to build a system that outperforms the rest. 💡
What Are AI Algo Systems? 🤖
AI trading systems use advanced machine learning models to:
• Analyze huge volumes of historical and real-time data 📈
• Detect patterns and trading opportunities faster than any human
• Automatically execute trades using coded logic, without emotion
🔬 Real-World Examples:
• Neural networks (LSTM, CNN): Predicting EUR/USD direction based on years of tick data
• Reinforcement learning agents: Managing position sizing dynamically in crypto scalping
• Predictive classifiers: Spotting likely trend reversals on S&P 500 based on 20+ indicators
Key Benefits:
• 🔄 Emotionless execution: No fear, no greed, just rules
• ⏱️ Lightning-fast trades: React to price action instantly
• 📊 Pattern recognition: Finds subtle correlations people miss
________________________________________
What Is Manual Trading? 👤
Manual trading is powered by human intelligence and judgment. Traders use:
• Price action and SMC/ICT techniques (e.g., order blocks, BOS)
• Fundamental analysis: News, sentiment, macro reports
• Intuition and experience: Reading between the lines the way only humans can
🧑💼 Real-World Examples:
• A trader spots an untested order block on GBP/JPY and waits for liquidity sweep before entering
• Reading a dovish tone in FOMC minutes and fading the initial spike on DXY
• Using “market structure shifts” after a big news event to catch a reversal
Key Benefits:
• 🔍 Contextual awareness: Understand the full market story
• 🎯 Real-time adaptability: Adjust plans on the fly
• 🧠 Creative edge: Find setups no algorithm can code for
________________________________________
Side-by-Side Comparison Table 📋
Feature AI Algo Trading 🤖 Manual Trading 👤
Execution Speed Instant Slower, can lag
Emotions Involved None Prone to fear/greed
Adaptability Limited (needs retrain) High
Learning Curve High (coding/tech) Medium (market logic)
Strategy Flexibility Pre-coded only Unlimited creativity
Backtesting Automated Manual/semi-auto
Session Monitoring 24/5 via server Human-limited hours
________________________________________
When AI Algo Systems Work Best 💾
AI is unbeatable when you need:
• Scalability: Watching 10, 20, or even 100+ pairs 24/5
• High-frequency execution: Entering/exiting trades within milliseconds
• Repetitive strategies: Like mean reversion, breakout scalps, or arbitrage
📈 Example:
• Strategy: EUR/USD London open breakout
• Process: AI model detects volume and volatility spike, enters trade with 0.3% risk, targets FVG
• Results: 60% win rate, 1.8R average reward over 3 months
________________________________________
When Manual Trading Wins 🧠
Manual skills shine when you need:
• Discretionary entries: Especially with complex SMC/ICT structures
• Adapting to breaking news: Sudden CPI, FOMC shocks, geopolitical headlines
• Making sense of market narrative: When volatility is off the charts and AI gets confused
🗞️ Example:
• News: Surprise ECB rate hike
• Setup: Price sweeps liquidity and forms new order block
• Action: Trader enters based on confluence of structure, sentiment, and news
• Why AI fails: Model trained on normal volatility might get stopped out or miss entry entirely
________________________________________
Hybrid Strategy: The Best of Both Worlds 🌐
Elite traders combine the power of AI with human oversight.
Hybrid Workflow:
1. AI scans markets: Flags setups (order blocks, FVGs, volume spikes)
2. You review: Confirm bias with news, sentiment, or higher time frame
3. Entry:
o Manual (you pull the trigger)
o Semi-automated (AI suggests, you approve)
🔁 You save time, avoid missing setups, but keep critical discretion and control.
________________________________________
Risk Management: Algo vs. Manual 📊
AI:
• Stops, lot size, SL/TP are auto-calculated
• Consistent, never emotional
• Example: EA manages all USD pairs with 0.5% fixed risk per trade
Manual:
• Trader might override risk plan
• Discipline needed—easy to “revenge trade” after a loss
• Example: You up your risk size after a losing streak, breaking your rules
Best Practice:
📌 Let AI calculate risk size. Manually approve or override the entry. Double safety net.
________________________________________
Trader Case Study 👤
Name: Ray – $100K funded prop trader
Style: Hybrid (AI scanner + manual ICT confirmations)
Process:
• Sets HTF bias each morning
• AI scans for OB/BOS setups during NY session
• Manual review before entry
Performance:
• Win rate: 63%
• Avg R: 2.5
• Monthly gain: 9.7%
Ray’s Words:
“AI catches what I can’t see. I catch what it can’t understand.”
________________________________________
Mistakes to Avoid ❌
• 🚫 Blindly trusting black-box AI: Always verify signals
• 🚫 Micromanaging every tick: Let automation work, don’t over-interfere
• 🚫 Running AI during high-impact news: Most bots aren’t built for chaos
• 🚫 Ignoring psychology: Even if AI executes, your mindset impacts risk and management
________________________________________
Conclusion ✅
There’s no one-size-fits-all answer. The best traders in 2025 master both worlds. Here’s the winning formula:
• Harness AI’s speed and pattern recognition
• Lean on manual judgment for narrative and nuance
• Blend them with intention and structure for a trading system that’s fast, flexible, and resilient.
💥 Don’t pick sides. Master both.
That’s how the top 1% trade today—and win. 🚀⚙️📊
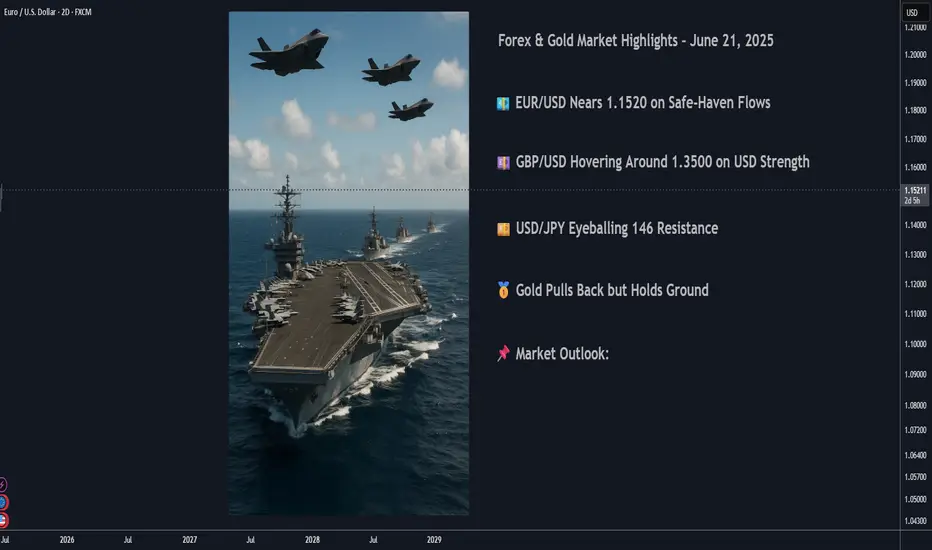
Forex and Gold Market Highlights June 21 2025Forex & Gold Market Highlights – June 21, 2025
🕒 Key Events This Week:
• 🏦 Fed officials signaling possible rate cuts vs. cautious economic tone
• 🌍 Escalating Israel–Iran tensions boosting safe-haven flows
• 🏭 Mixed U.S. macro data (retail sales, Philly Fed, housing) shaping Fed expectations
________________________________________
💶 EUR/USD Nears 1.1520 on Safe-Haven Flows
EUR/USD edged up to about 1.1520 amid weakness in the U.S. dollar, driven by global risk-off sentiment. Mixed signals from the Fed kept traders cautious.
________________________________________
💷 GBP/USD Hovering Around 1.3500 on USD Strength
GBP/USD remains near 1.3500, slipping slightly off highs after weaker UK retail data. The pair faces resistance in the 1.3550–1.3600 zone.
________________________________________
💴 USD/JPY Eyeballing 146 Resistance
USD/JPY climbed toward 146.00, driven by risk-averse USD demand and dovish BOJ stance. The pair is testing key retracement resistance near 146.76.
________________________________________
🥇 Gold Pulls Back but Holds Ground
Spot gold slid to around $3,334 3,381 this week, under pressure from a stronger dollar and diminished Fed rate-cut hopes. Still, geopolitical jitters kept it from falling hard.
• Weekly drop of ~2.5%, trading in a $3,330–$3,400 range.
________________________________________
📈 DXY Index Rallies on Risk Aversion
The U.S. Dollar Index rose ~0.45%, marking its strongest weekly gain in over a month due to heightened safe-haven flows amid Middle East tensions.
________________________________________
📌 Market Outlook:
• EUR/USD: Mixed bias. May test 1.1550–1.1600 if risk-off continues; downside risk near 1.1400 if U.S. data surprises.
• GBP/USD: Expected to stay in the 1.3450–1.3550 range; UK economic data and USD momentum will be key.
• USD/JPY: Bullish tilt remains toward 146.76, but any BOJ hints of policy tightening could shake it.
• Gold: Pressure from a firm dollar is likely to persist. Watch for geopolitical developments and upcoming Fed signals for reversal clues.
Uranium The Epic Explosion!Global uranium demand is up to rise about 28% by 2030, driven by clean-energy pushes, nuclear restarts (e.g., Japan), and advanced modular reactors
Kazakhstan’s largest producer, Kazatomprom, cut its 2025 production forecast by ~17% due to logistical hurdles and resource constraints
Iran signaled openness to discussions with European counterparts aimed at curbing its uranium enrichment levels. However, seasoned diplomacy and regional conflict issues complicate prospects for an agreement
Bottom line: Uranium markets are tightening due to production cuts and geopolitical risk, while long-range demand is gaining momentum thanks to nuclear expansion and emerging energy technologies.

ETH - Do you Notice a Pattern here? I DO...Hello TradingView Family / Fellow Traders. This is Richard, also known as theSignalyst.
📈I find ETH 4h chart as it looks like history repeating itself.
Previously in 1 to 5 June, it formed a slight lower low before starting the next big bullish impulse leading towards the upper bound of the channel.
📚 Today, ETH just formed the slight lower low we are looking for.
Is it time for the next bullish impulse to start? well it will be confirmed after breaking above the last major high at $2,600.
What do you think?
📚 Always follow your trading plan regarding entry, risk management, and trade management.
Good luck!
All Strategies Are Good; If Managed Properly!
~Rich
Can Crude Oil Spike to 150 USD / bbl ? Scenario Analysis.With Mid East tensions rising and overall unpredictable
situation around Strait of Hormuz, let's review potential
scenarios for the Crude Oil Prices. I've outlined three
scenarios with projected oil prices for each scenario below.
🚨 Market Alert: Israel-Iran Conflict Impact Forecast 📈
🔴 Worst-Case Scenario: Regional War + U.S. Military Involvement
🚢 Oil (Brent): Soars to $150–$200+ if Strait of Hormuz closes
🥇 Gold: Skyrockets to $4,500–$5,000 (safe-haven rush)
₿ Bitcoin: Initial volatility; settles at $80k–$100k
📉 SPX: Crashes to 4,000–4,500
💻 NDX: Drops sharply to 15,000–16,000
🟠 Base-Case Scenario: Protracted Tension, No Major Disruption
🛢 Oil: Stabilizes at elevated $75–$95, occasional spikes
🥇 Gold: Moves higher, trading $3,500–$3,800
₿ Bitcoin: Trades steady, $90k–$110k range
📊 SPX: Pullback moderate, around 5,200–5,500
💻 NDX: Moderately lower, 18,000–19,000 range
🟢 Best-Case Scenario: Diplomatic De-Escalation
🌊 Oil: Eases down to $65–$75
🥇 Gold: Mild decline, holds at $3,300–$3,500
₿ Bitcoin: Positive sentiment, lifts to $100k–$120k
📈 SPX: Slight dip; stays strong near 5,800–6,200
💻 NDX: Minor correction, remains high at 20,000–22,000
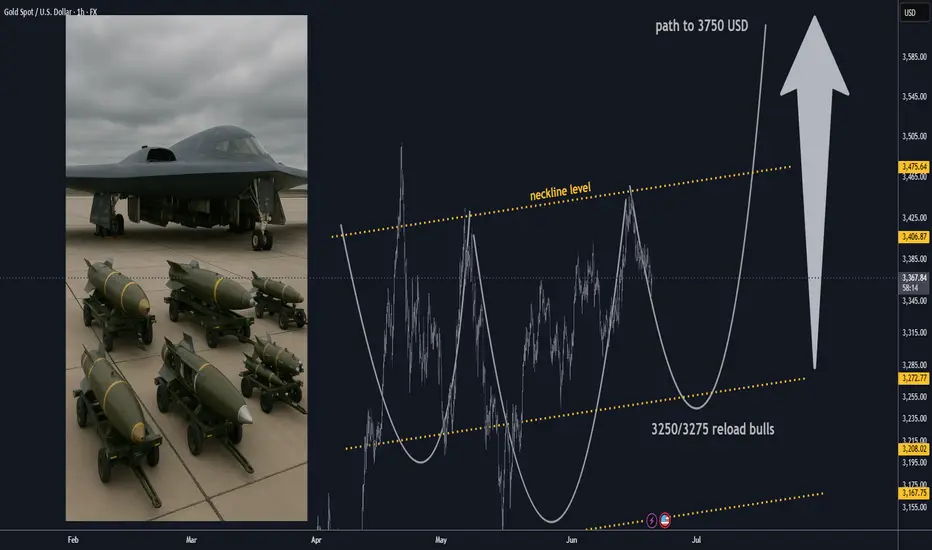
Gold Market Update: Bulls Will target 3750 USD after 3500 USD🏆 Gold Market Mid-Term Update (June 19, 2025)
📊 Price & Technical Outlook
Current Spot Price: ~$3,365
Technical Setup
Inverted H&S pattern forming/completed on higher timeframes — confirms bullish reversal structure.
Reload (buy) zone: $3,250–$3,275 (ideal accumulation range for bulls if price pulls back).
Swing trade setup: Entry: $3,250–$3,275 (reload zone)
Take Profit (TP): $3,750
Support: Major at $3,250–$3,275 (break below = reassess bullish bias).
Resistance: $3,450–$3,500 ; next major resistance: $3,600, then $3,750.
Price consolidating above $3,250–$3,350 is technically healthy — maintaining bullish structure.
🏆 Bull Market Overview
The pullback appears complete; uptrend resumes amid strong macro/geopolitical drivers (inflation, rates, safe haven flows).
Key Levels: $3,000 (macro support), $3,250 (bulls must defend), $3,500 (breakout zone), $3,750 (swing TP).
Short-term dips = buying opportunities — “Buy the Dip” remains favored as long as support holds. Upside targets: Immediate: $3,600 Swing target: $3,750
Summary:
Gold remains in a bullish mid-term structure, with the inverted H&S pattern pointing to higher prices ahead. Bulls look to reload at $3,250–$3,275, targeting $3,750 for swing trades. As long as $3,180–$3,200 holds, buying dips is the play. A sustained breakout above $3,400–$3,600 opens the door for new all-time highs.
Strait of Hormuz risk priced in—or not yet?Iran has repeatedly threatened to block the Strait of Hormuz during periods of heightened tension with the U.S., notably in 2011, 2018, and 2020. The Strait is considered the world’s most critical oil chokepoint, with nearly 20 million barrels passing through daily.
Several banks warn that a full closure could push crude prices above $120–$150 per barrel, or higher if the disruption is prolonged. Still, most analysts view a complete shutdown as unlikely, since Iran also depends on the Strait to export its own oil.
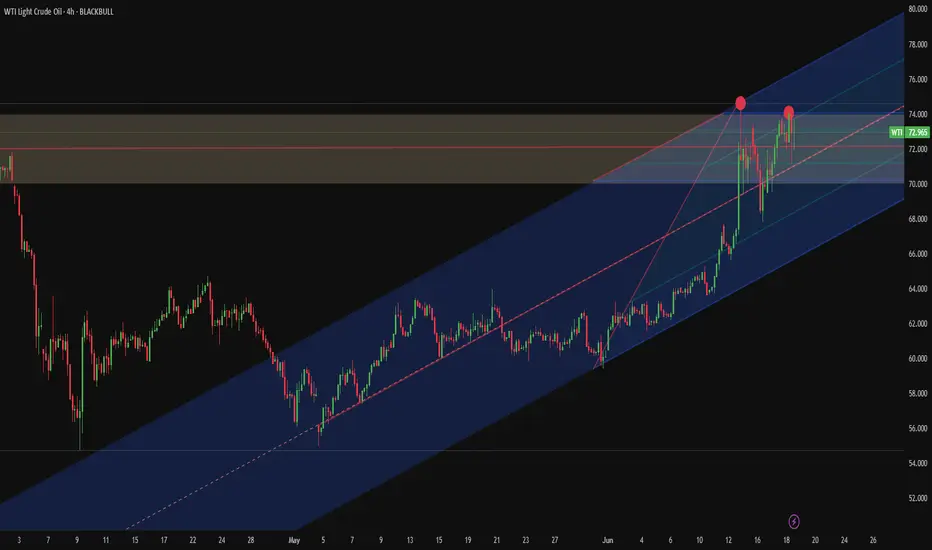
Technically, recent WTI candles suggest that the risk premium may be fading. Price action near $74 shows hesitation, raising the risk of a developing double top—particularly if support at $70 fails. Unless tensions escalate materially, such as the U.S. becoming more directly involved, WTI may consolidate between $70–$74.
Hold on, here is the real deal.District court ruling on the joint motion (June12) still pending—no update yet.
Judge Torres’ ruling – could come any day; depends on district court docket.
Appeals proceedings remain on hold until at least August 15, 2025.
XRP spot ETF decisions delayed:
SEC ETF decisions, comment periods suggest
Franklin Templeton: very likely by late July
ProShares: by June 25
Grayscale: likely October
Bitwise: through June to October
CPI must fall under 2.0%
Oil must retrace to the $70s
Fed must signal a real cut, not conditional pause
DXY must fall below 103
Current War that we all are focused is going to be ended swiftly.
Until then, Hold Your Horses!
