IWM is Overbought### ⚠️ \ AMEX:IWM Bearish Setup Alert — Weekly PUT Trade (Aug 3, 2025)
> **Momentum breakdown + institutional volume = high-probability short play**
📉 **Market Breakdown:**
* **📉 Daily RSI:** 34.9 → Bearish momentum under key 45 level
* **📊 Weekly RSI:** 53.0 → Neutral but slipping = trend weakening
* **📈 Volume Spike:** 1.4x → Institutional moves hint at potential sell-off
* **⚖️ Options Flow:** 1.00 C/P ratio → No bias = wait for price action
* **💀 Max Pain:** \$222.50 → Downward price magnet
* **🌪️ VIX:** 20.38 → Normal vol zone, good for option plays
---
### 💥 Trade Setup – 5D Weekly PUT
| Entry | 🎯 Target | 🛑 Stop Loss | ⚖️ R/R Ratio | 📅 Expiry |
| ------ | ------------- | ------------- | ------------ | ---------- |
| \$0.92 | \$1.35 (+50%) | \$0.45 (-50%) | 1:1.5 | 2025-08-08 |
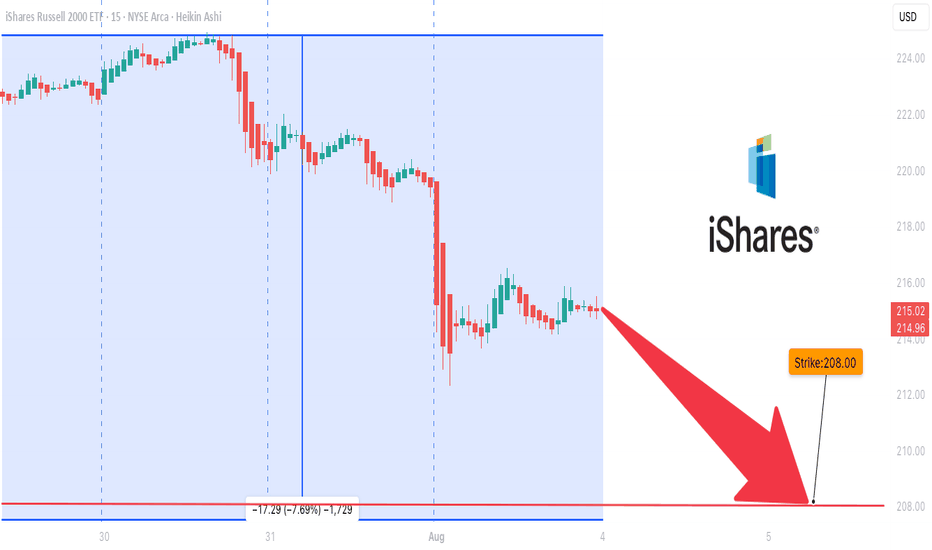
🔻 **Strike:** \$208.00
💼 **Type:** Naked PUT
⏰ **Timing:** Enter at market open
📈 **Confidence:** 70%
🧠 **Logic:** Bearish RSI + volume surge + neutral flow = downside edge
---
### 🔍 Summary
> “IWM is losing grip. Momentum says down. Big players are already positioning.”
> 🔸 Short-term PUTs offer attractive R/R
> 🔸 Low volatility improves pricing
> 🔸 Weekly RSI still neutral → stay nimble
---
📊 **TRADE DETAILS**
🎯 Instrument: **IWM**
🔀 Direction: **PUT (SHORT)**
🎯 Strike: **\$208.00**
💵 Entry: **\$0.92**
🎯 Target: **\$1.35**
🛑 Stop Loss: **\$0.45**
📅 Expiry: **2025-08-08**
📈 Confidence: **70%**
🕒 Entry Timing: **Open**
---
### 💡 Tag It:
\#IWM #PutOptions #WeeklyTrade #BearishMomentum #RSIAlert #OptionsFlow #MaxPainTheory #VolatilityTrading #MarketOutlook #TradingView #OptionsAlert
Iwmanalysis
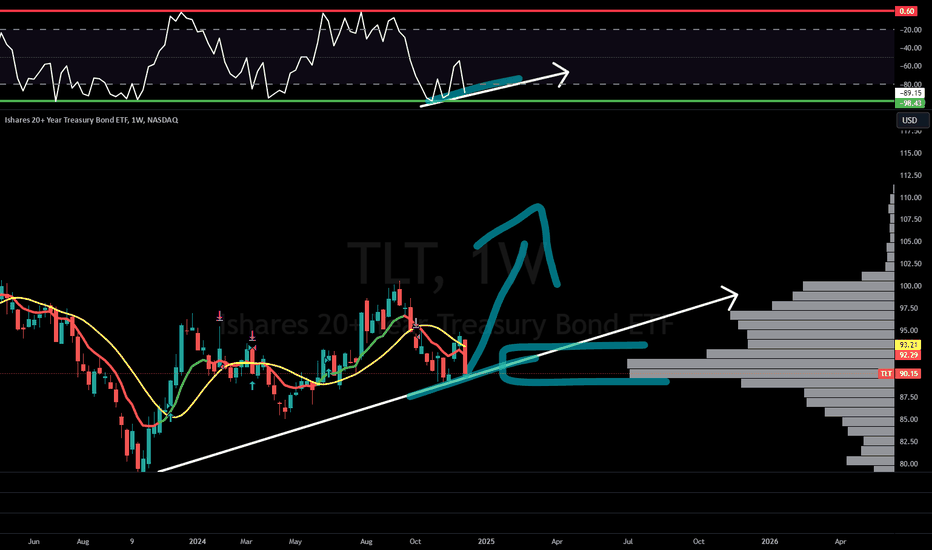
Epic Bounce Ahead! Why $IWM, $RTY, and $TLT Are Set to SoarIn this video, I will explain to you why I believe we are about to have an EPIC bounce in the AMEX:IWM CAPITALCOM:RTY NASDAQ:TLT
I've put out write ups on this topic but I wanted to get all my thoughts in one cohesive video analysis to give you the visuals you deserve for my BOUNCE prediction.
🔜🎯$259
⏳Before March2025
Not Financial Advice. Check it out here 👇
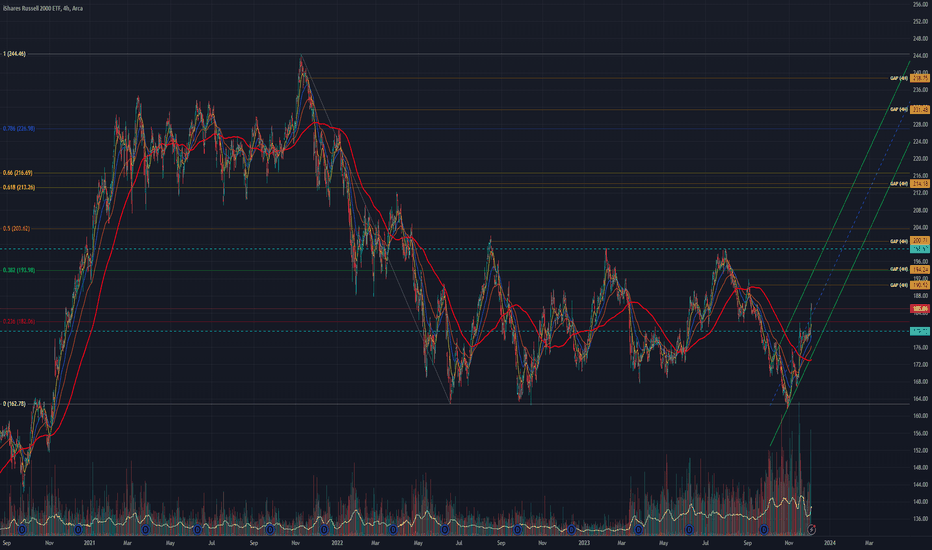
Russell 2000 ETF (IWM) ~ December 4H SwingAMEX:IWM chart analysis/mapping.
IWM ETF rally off late October lows on market expectations of the end to Fed rate hikes.
Trading scenarios:
Continuation rally #1 = multiple gap fill / 38.2% Fib / upper range of parallel channel (green) confluence zone.
Shallow pullback #1 = 23.6% Fib / horizontal line (light blue dashed) confluence zone.
Deeper pullback #1 = lower range of parallel channel (green) / 200MA confluence zone.
Capitulation #1 = re-test ~163 bottom.


