$IWM - How GILD may have saved the market (for now)Those who follow me know I have been bearish (and still am in the long term) since January. However looking at the IWM which has been a very good leading indicator of the market overall, the Gild news could have breathed a new lease of life to the market.
Looking at the actions a few days before the GILD news we can see that the IWM was rejected twice and closed below the resistance line.
In addition there was a bearish RSI divergence prior to the news. As a result, I think we could be headed higher now if we are able to break above the resistance line after bouncing off support. (If we are unable to break that resistance and fall below the current support then it could be game on for the shorts)
Also looking at the RSI in general, for now we are still following the trend line and still haven't gotten back to the 50% line, this may mean the rest of the market may be heading higher with minor pull backs.
With everything happening in the world one would expect that the stock market should be crashing but The Fed has been injecting so much liquidity into the market. We have to take the stock market one day at a time and deal with what it gives us.
Also there is too much negativity in the market right now and it shouldn't take much for the FED to get the market to move higher if and when it starts to buy ETFs since that could cause a short squeeze and take markets to higher highs.
Please do your DD before investing as this is just my opinion.
Iwmshort

Break and restest of channelBreak was on higher than average daily volume. If retest is successful and we don't fall back into the channel resistance should turn into support. Monday will tell. Flat for the weekend. Next target $169.

IWM continues to HOLD supportIWM is within a 2 year channel with distinct points.
Lower end (red arrows) around $144-$145
Upper end (black arrows) around $160
Highlighted areas are times in which we breached those areas.
Yesterday the IWM traded down as low as $144.25, buyers stepped in to drive the ETF up.
Buyers have stepped into and bought around that area for the past 2 years.
Solid support.
Resistance of $160 is just as solid.

IWM rising sectionwww.pretiming.com
Stock investing strategies
Investing position about Supply-Demand(S&D) strength: Strong buy as Rising section of high profit & low risk
Supply-Demand(S&D) strength linkage Trend Analysis: In the midst of an adjustment trend of downward direction box pattern stock price flow marked by limited rises and downward fluctuations.
Today's Supply-Demand(S&D) strength Flow: Supply-Demand strength has changed from a strong buying flow to a suddenly strengthening selling flow.
D+1 Candlestick Color forecast: RED Candlestick
%D+1 Range forecast: 0.1% (HIGH) ~ -0.8% (LOW), -0.3%(CLOSE)
%AVG in case of rising: 1.0% (HIGH) ~ -0.3% (LOW), 0.8% (CLOSE)
%AVG in case of falling: 0.3% (HIGH) ~ -1.0% (LOW), -0.5%(CLOSE)
Stock Price Forecast Timing Criteria: Stock price forecast timing is analyzed based on pretiming algorithm of Supply-Demand(S&D) strength.

IWM Short Setup Tuesday, Test $138.58 Support IWM has hit long term resistance at $144 and bounced down off it. This looks to be setting the stage for a reversal, at least in the short term, Tuesday. Be careful out there, as the markets have been trading sideways for a week now.

SPY Weekly 30 Years overall Look #BigPicture #MeasuredmoveThis is a carefully crafted study! I have demonstrated the angles that we will likely see in the future based on what we have seen in the past. Details in the chart... Hope to get 1K views on this

IWM- Long term correction.Looks like there is alot of bullish divergence for the rsi and macd. This means it should go up some ways then correct to around the 135 price range.

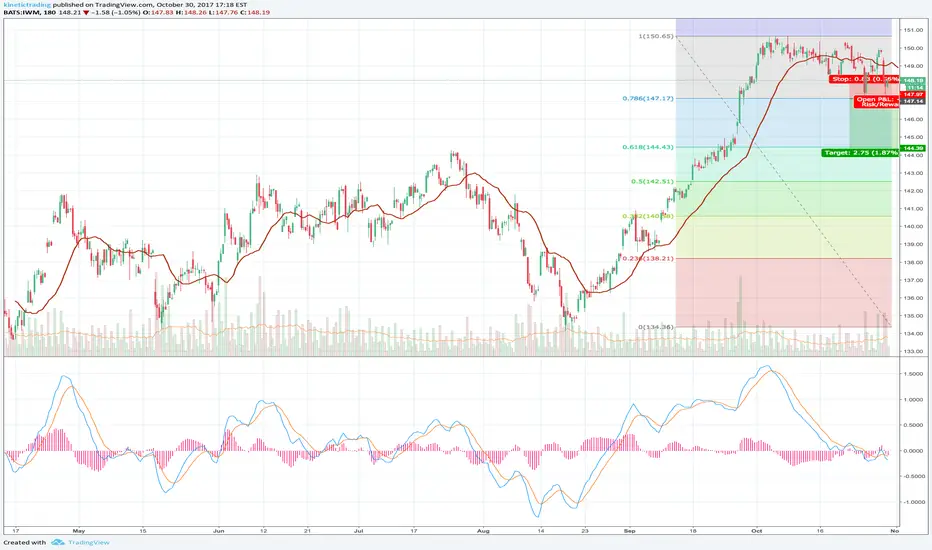
IWM/R2K has been relatively weak compared to the Naz. Short?With confirmation, we will be entering this short with defined risk and target as shown on the chart. It has traded relatively weak compared to the other major markets.