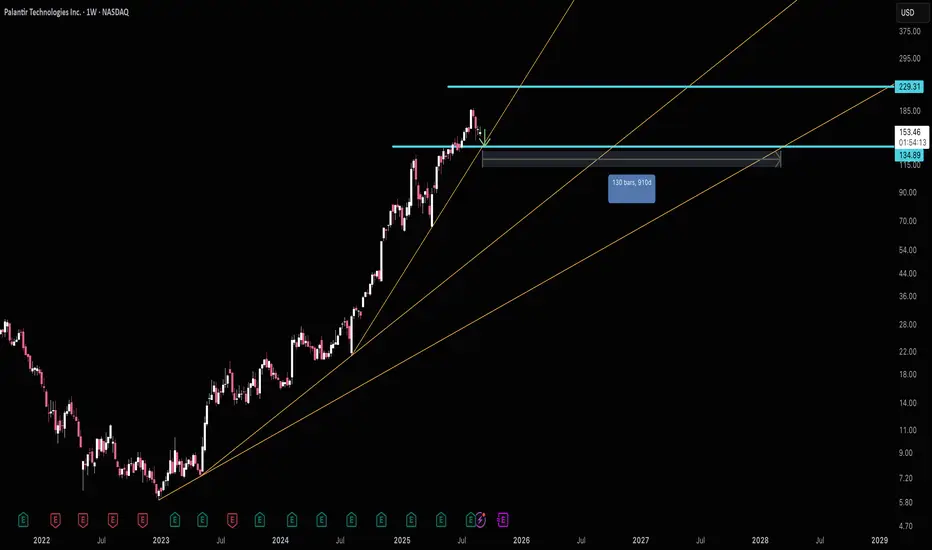
For Those Trading PalantirPLTR has greatly accelerated it's growth trend lines. Right now PLTR is almost 3 years ahead of it's main long term trend line. What this means is upside potential is diminishing.
I see a lot of long charts for PLTR and wanted to share that support is actually at $134. So if you're a PLTR trader, looking to buy, that's the best area to do it.
If however you're looking to sell, then $230 is your spot.
I feel like people buying PLTR are playing a bit with fire as the fast gains are likely gone and eventually a return to the long term trend line is likely. I don't see that happening at least until IXCO runs into resistance, so until then $134 is the buy area.
Good luck!
Ixic-nasdaq
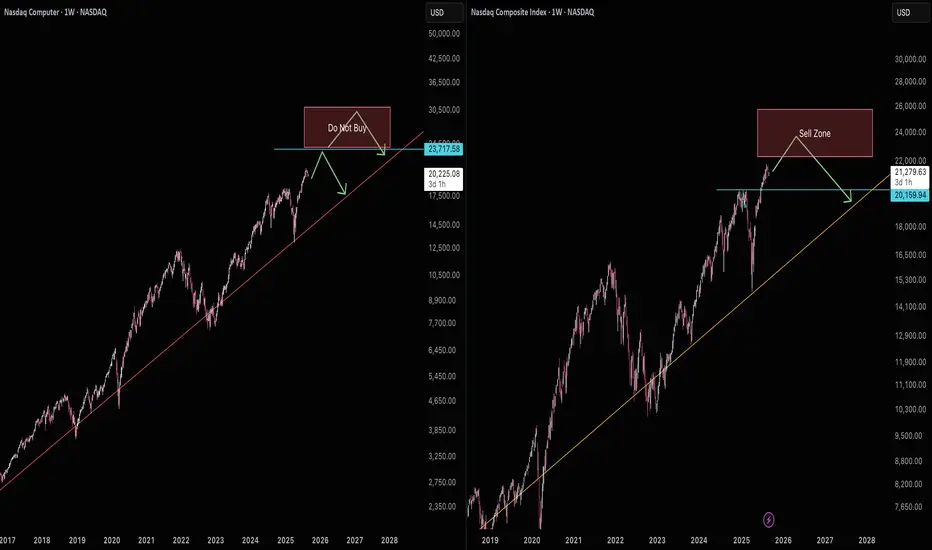
Nasdaq Computer sector & Nasdaq nearing pullback areaNasdaq Computer (IXCO) Is nearing pullback territory (23,717 resistance). IXCO being the largest sector in Nasdaq (IXIC) means the composite index, now that it's over previous resistance, is also looking for a pullback into support (20,160).
It's possible IXCO will break resistance next year and if that happens whatever gains are made will be lost on an eventual drop back into support.
If you have call options on NVDA or other tech companies closing them when IXCO hits 23,717 is highly advisable. If it hits there around this January it could be 2 years before IXCO resumes the uptrend past 23,717. Calls will likely get destroyed during this time.
Another note is lots of tech IPOs are occurring this year with lofty valuations. When this IXCO pullback comes they are likely to get hit hard. It's a great opportunity to short or wait to buy up the ones you like when the pullback is over.
As always good luck and try your best to avoid getting into new tech related trades as this year ends. It's going to be a great idea to have cash ready next year.
Can the Nasdaq sustain its rally?NASDAQ:IXIC
SP:SPX
FX_IDC:JPYKRW
Over the past two years, the S&P 500 and Nasdaq have experienced an unprecedented rally. However, now, with the S&P 500 hovering around 6,000 points and the Nasdaq near 20,000, the market appears to have lost its momentum.
I believe that for stock prices to rise further, there must first be a significant market pullback. A major decline implies that someone has already realized substantial gains, and understanding this dynamic is crucial.
Looking further back in time, investors who bought stocks at lower prices will eventually sell them at higher prices. This cycle continues to repeat itself.
There is no such thing as perpetual growth, just as there is no endless decline. Keeping this principle deeply in mind can lead to better investment decisions.

IXIC - Downward IdeaChart suggesting a move down as a double top enacts itself
This allows for a triple touch along a lower trend line
I think it will come down to the dotted white trend line on this daily chart

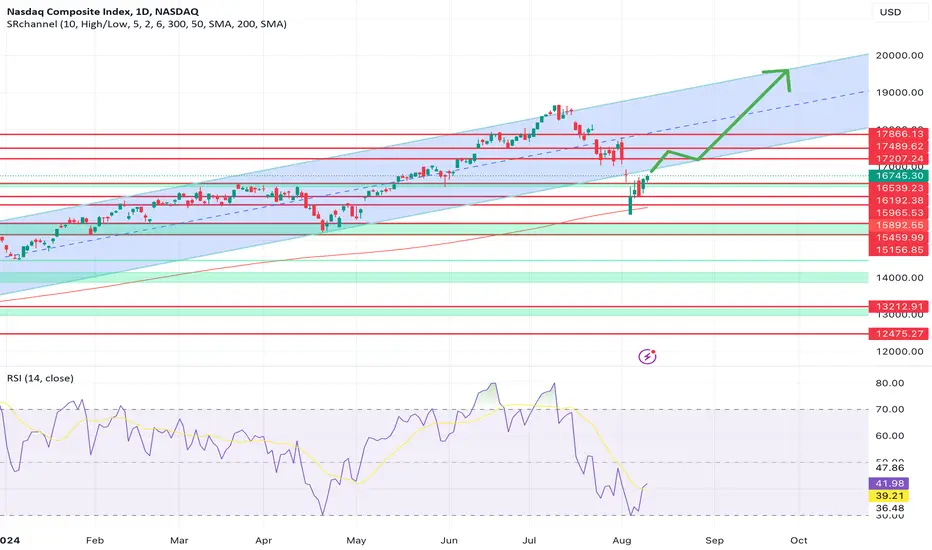
NASDAQ retracementNASDAQ looks set to enter the bullish channel
its making simple HH and HL and have done an amazing recovery
this week is full of news so this week it might just be sideways
if support of 16500 is broken then we might see 15700 levels again
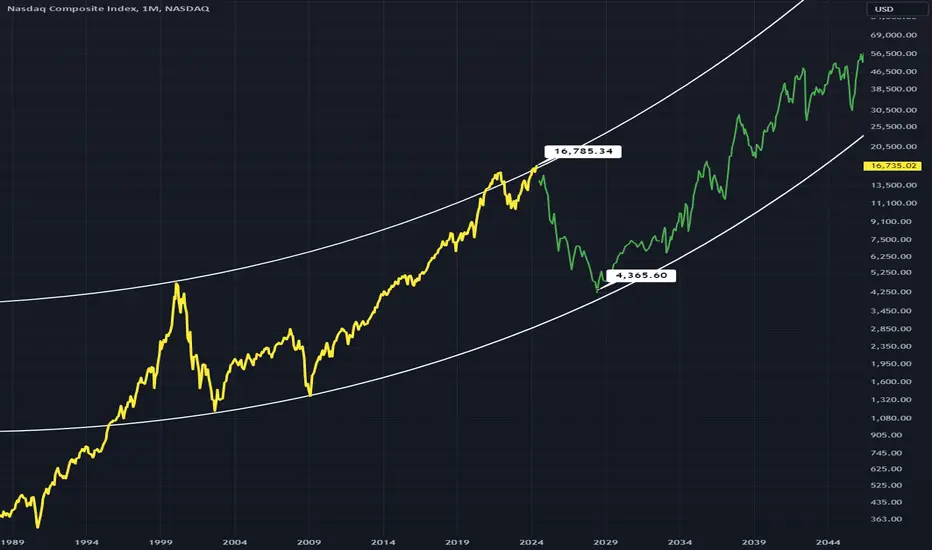
IXIC - Continuation in the long runSuggesting a big pullback and recovery within this channel up. Also providing a triple bottom for the structure
Bullish long long term, this is the Monthly Chart
NASDAQ broke supportNASDAQ broke a long term ascending support channel yesterday and its not looking good
The next level of support is 15800 to 15900 levels
There can be a bounce back from that level since overall there are bullish sentiments but breaking down 15800 means we might be looking at 15000 level

NASDAQ CorrectionNASDAQ strong bearish divergence formed
The correction will look like around 500 to 600 points
The next strong support 15500 . It will be a great entry point for buyers
Other analysts are also suggesting a greater correction till 14500 points but I think in an election year this is not going to be that huge correction but no one knows and who actually knows ?

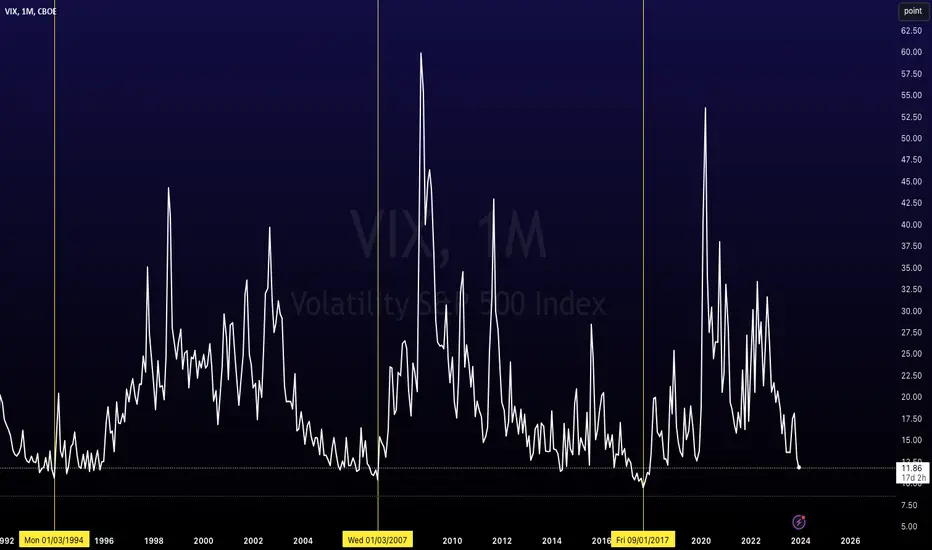
VIX Index at Lowest Levels Since 2017OVERVIEW
As of 12/12/2023, CBOE:VIX is at 11.82.
There have only been a handful of periods over the last 30 years where stock market volatility is at a similar level, including 2007 and 1994.
Some would argue it implies an increasing level of volatility will be due in 2024.
What is the VIX?
The CBOE Volatility Index, is a real-time market index representing the market's expectations for volatility over the coming 30 days. Investors often refer to the VIX as the "fear index" or "fear gauge" because it is one of the most recognized measures of market volatility.
Here's a breakdown of what the VIX represents:
Volatility Measurement:
The VIX measures the stock market's expectation of volatility based on S&P 500 index options. It is calculated using the bid and ask prices of S&P 500 index options.
Forward-Looking: Unlike many market metrics that look at past performance, the VIX is forward-looking. It provides a 30-day forward projection of volatility.
Market Sentiment Indicator: A high VIX value indicates that traders expect significant changes (volatility) in stock prices, which is often associated with market uncertainty or fear. Conversely, a low VIX suggests low expected volatility and is often associated with market stability.
Not a Direct Stock Market Indicator : It's important to note that the VIX does not measure the direction of stock market movements. Instead, it measures how much the market is expected to fluctuate, regardless of the direction.
Use in Investment Strategies: Some investors use the VIX to help in making decisions about market timing. For example, a high VIX might suggest a market turning point, leading some to consider it a good time to buy, while others might see it as a signal to sell.
VIX Derivatives: There are various financial products, such as VIX futures and options, that allow investors to trade based on their views of future market volatility.
Risk Management Tool: For portfolio managers and sophisticated investors, the VIX can be a tool to hedge against market volatility or to take a position on future volatility.
In summary, the VIX is a key measure of market expectations of near-term volatility conveyed by S&P 500 stock index option prices. It has become a crucial tool in financial markets for hedging, trading, and investment strategy formulation
IXIC - How I Think The Nasdaq Will Play OutMy current thoughts on the Nasdaq and correlating American markets.
I expect a higher high within this large broadening structure, followed by a large bear run for a few years. During this period it would be optimal to switch to rare metals (gold,platinum,silver) and also crypto as a hedge during these turbulent times.
Following this I expect a huge bullrun. But try capitalize on the bear movement.

Nasdaq Composite: Bond Yield Panic
IXIC has been dropping quickly due to rising bond yield e.g. US10Y and US30Y and rising volatility. Volatility is often a self-fulfilling prophecy, as many funds automatically sell when volatility rises above certain threshold, creating more volatility and causing other investors to sell.
However, the big picture remains bullish because the overall market sentiment is not panicking about recession. Also, newbie individual investors have not crowded the stock market like they did in 2020 and 2021. The Fed may start rate cutting in 2024, which will probably ignite another huge stock rally.
Therefore, IXIC may drop to 13150, the 0.5 fibonacci retracement of the 2022 downturn. Then IXIC will probably recover and retest the previous high in early September. September and October are often bad months for stocks, but the first two weeks of September might be bullish just because August has been too bearish.

IXIC is in a bulish chanelNasdaq analysis
Since December 28, 2022, when it touched the bottom of the ascending channel, it has continued its upward trend for 153 days with a relatively good slope of 24 degrees and has grown by 29%.
Regardless of the current candle, the limits of the index can be considered between the midline and the ceiling of the channel (12793 to 13647).
According to the status of the RSI indicator, it is not far-fetched to modify the index up to the midline of the channel.
If the midline of the channel is touched, a growth of 6.36% to the ceiling of the channel can be imagined.
Don't forget capital management and compliance with risk to reward.
Good luck and profitable.

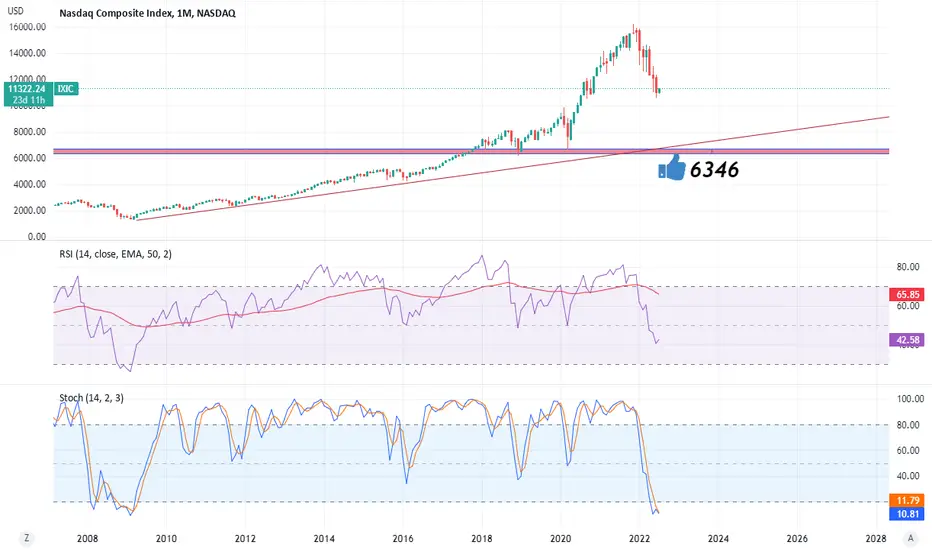
Nasdaq Composite Index, IXIC, Start of a New Bull MarketIt doesn't get more simple than looking at this Monthly Chart going back over a decade. You can clearly see the incredible uptrend and the True Strength Index, although having shown a bearish divergence since Jan.2022, the TSI has barely broken the Centre line and is now about to turn back above. This New Bull Market should last through to the end of 2014. Just waiting for confirmation, and that will happen in June.

U.S. Stocks final peakThe graph presented analyses SPX, IXIC and IWM; by valuing them against bonds adjusted dollar and gold. For explanation refer to the graph tagged.
Thanks!

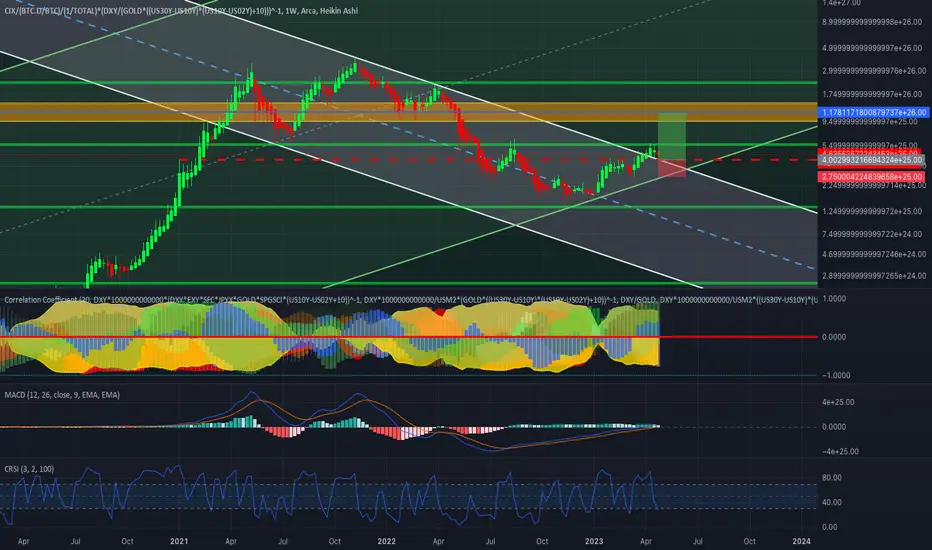
Crypto BreakoutThere is a breakout to the upside shown by the downward-sloping white channel. This marks the beginning of the bull run.
The graph is adjusted to volatility accounting from coins' dominance, and economic changes (through accounting for dollar, gold, and bond movements).
This graph is universal, use the equation or the graph as you see fit. The dollar value of Bitcoin can be tricky to trace from the graph. I'd recommend translating values to BTCUSD by estimating the %movements and finding the nearest most significant psychological levels. Don't have to be psychological levels, these have just worked better in the past.
TP (blue line): 35,000
SL: 25,400
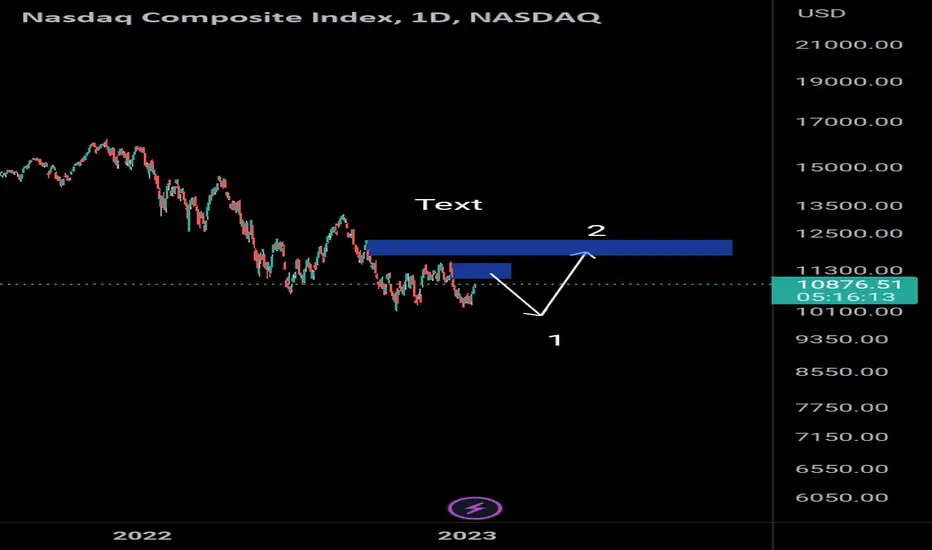
IXIC - Double TopAn idea for IXIC showing a strong trend line in white that should be respected.
This works well with a double top, a bearish pattern.
A channel can also be drawn encompassing the double top.
I have posted key price points with the labels.

My prediction for Nasdaq IXICI believe it will play out like this timing may be off a bit but I believe these targets are the likely scenario as we are in a super wave 4 down that needs to correct the super wave 3 which was created decades long highs

Nasdaq is on the moveUS composite index shows that short term strong economy and inflation would moist the market.
It means short term buying opportunity is ahead right now.
Tech stocks rally may start soon.
My target is 12900and let's forget about the FED for now.
sometimes brave investment gives us a good profit.

IXIC Potential For Bullish ContinuationLooking at the H4 chart, my overall bias for IXIC is bullish due to the current price being above the Ichimoku cloud, indicating a bullish market. Looking for a pullback buy entry at 10753.57, where the 38.2% Fibonacci line is. Stop loss will be at 10207.47, where the recent swing low is. Take profit will be at 11521.97, where the 50% Fibonacci line is.
Please be advised that the information presented on TradingView is provided to Vantage (‘Vantage Global Limited’, ‘we’) by a third-party provider (‘Everest Fortune Group’). Please be reminded that you are solely responsible for the trading decisions on your account. There is a very high degree of risk involved in trading. Any information and/or content is intended entirely for research, educational and informational purposes only and does not constitute investment or consultation advice or investment strategy. The information is not tailored to the investment needs of any specific person and therefore does not involve a consideration of any of the investment objectives, financial situation or needs of any viewer that may receive it. Kindly also note that past performance is not a reliable indicator of future results. Actual results may differ materially from those anticipated in forward-looking or past performance statements. We assume no liability as to the accuracy or completeness of any of the information and/or content provided herein and the Company cannot be held responsible for any omission, mistake nor for any loss or damage including without limitation to any loss of profit which may arise from reliance on any information supplied by Everest Fortune Group.

IXICHello, dear friends. I am in the view of a downward movement in the current situation, and whenever it happens, I will announce a definitive opinion about the second upward movement.
NASDAQ has long way from now on to go up!|Hello dears
After a while I'm back and I found that there isn't any good signal in Nasdaq going up.
Its according to monthly analysis .
Last Dip / Next Bull-Run / April 2023Zoom out to see the whole chart!
This spread graph displays Nasdaq/(Gold*Dollar). The benefits of such a spread graph are:
* Reduces fluctuations from gold or dollar
* Omits short-term/seasonal price changes of assets
The graph technically aligns with my DXY/USM2 analysis. USM2 being US Money Supply. The second spread graph portrays the same indication:
Check out my previous analyses to get a better understanding of spread graphs.
Thanks! :)

IXIC - Long-awaited Bull signalComment :
1) IXIC has been fall more than 20% since previous peak on 16-Aug, bear signal appear next day from top. And today, it finally shows up Bull signal, indicating a short-term rebound. Short-term supporting price is lowest of 17-Oct that is 10569.69, this point must not be broke else the rebound will be ended.
2) TrendX+ indicator - candleestick moving below red trendline, mid-term downtrend underway.
3) DDX+ indicator - Bull signal shows up, looking forward a short-term long position.
4) MCDX+ indicator - weak, a little of banker bar (red), while retailer bar (turquoise) has occupy more than 50%.
Support & Resistance :
S : 10569.69 +/-
DISCLAIMER :
Analysis above SOLELY for case study purpose, not a PROFESSIONAL ADVISE. This analysis does not provide any trading advise and buy or sell. Trade at your own risk. Trade only after you have acknowledged and accepted the risks involved.
