GBPAUD (240) Bearish Alt-Bat Pattern Signals Potential ReversalPEPPERSTONE:GBPAUD
Setup Breakdown:
The recent completion of a bearish Alt-Bat pattern suggests a potential shift in market dynamics, signaling a possible downside move. While buyers previously maintained control, the emergence of this harmonic pattern indicates exhaustion. If selling pressure intensifies, the price could retrace towards key Fibonacci levels. A structured risk management approach involves maintaining a 1:2 risk-reward ratio, with stops placement above 2.0299 to accommodate potential retests of the monthly fractal resistance while minimizing exposure. Monitoring price action confirmation remains essential, as a failure to reject resistance could invalidate the setup.
🔹 Key Levels:
Pattern Completed at 2.0212
Target 1: 38.2% Fibonacci retracement @ 2.0000
Target 2: 61.8% Fibonacci retracement @ 1.9862
Stops: Above monthly fractal @ 2.0299
📊 Risk Management Play:
Apply a 1:2 R/R ratio (maximum 1:1)
Stops above 2.0299
[Upon reaching the first target, close half of the initial position size and adjust stops to breakeven .]
[At the second target, continue scaling out by closing another portion of the remaining position & activate a trailing stop or manually adjust stops to secure profits as the trade progresses.]
Safe Trades,
André Cardoso
💡 Risk Warning: Trading financial assets carries a high level of risk and may result in the loss of all your capital. Make sure to fully understand the risks involved before you start trading and carefully consider your investment objectives, level of experience, and risk tolerance. The data and information provided in this content do not constitute financial or investment advice and should not be considered as such. Only invest what you can afford to lose, and be aware of the risks associated with trading financial assets.
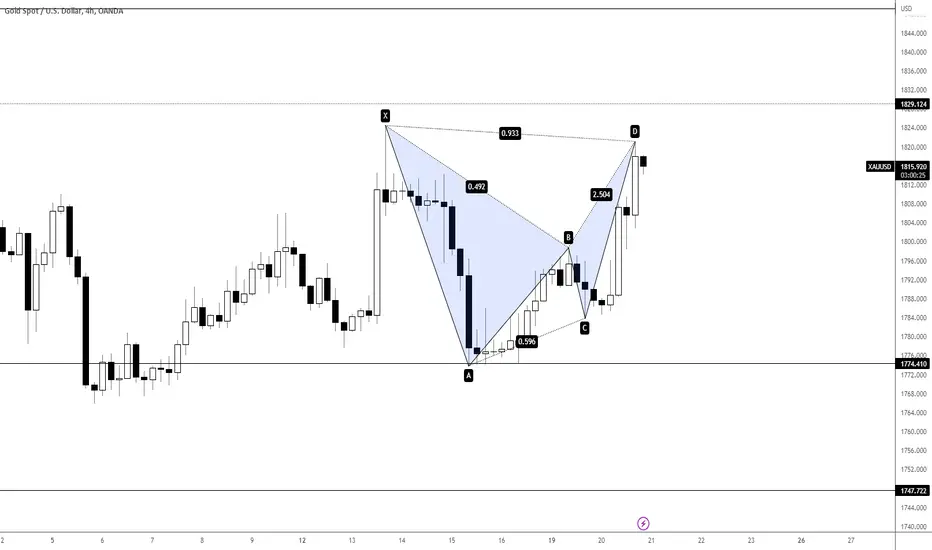
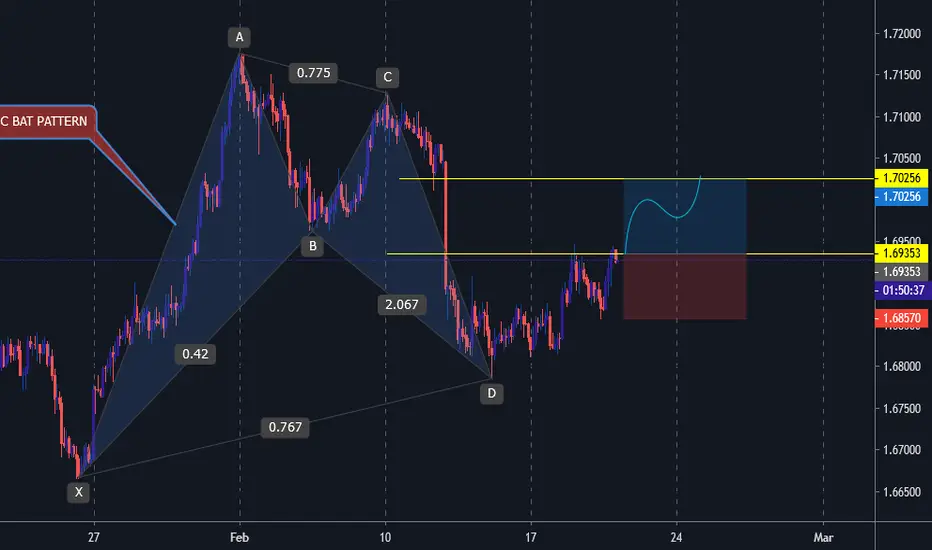
J-BAT

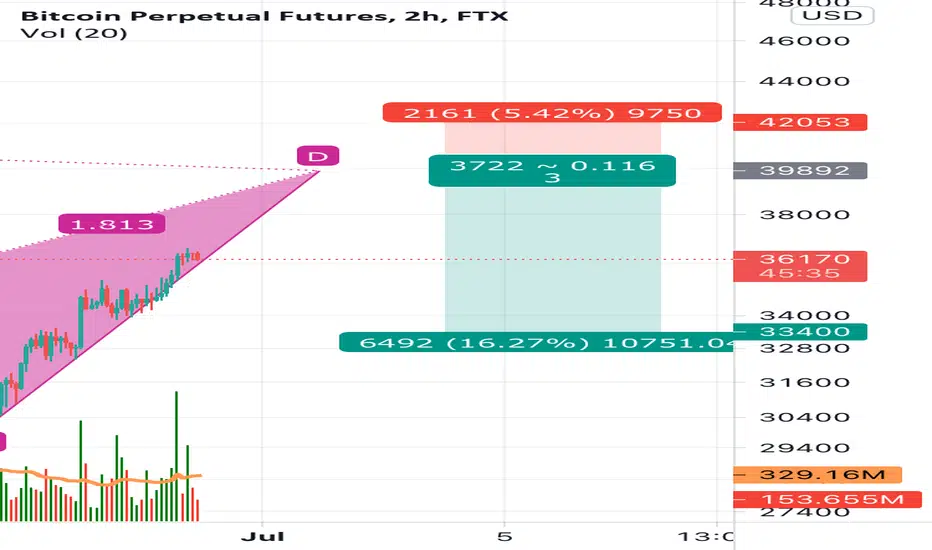
All alts with this Chart Pattern will fly. Being Accumulated.My previous post on Bitcoin was wrong. Despite seeing a hidden bearish divergence signal, they sometimes appear falsely at bottoms when reversing.
While looking at alts, I noticed this about them. Zooming in to hourly time frames (I got several points of confirmation, including increase in volume with price jump) that all alts with this pattern are being heavily accumulated. This is ground zero of the alt run.
You need to buy all alts with this chart. Right. Now.

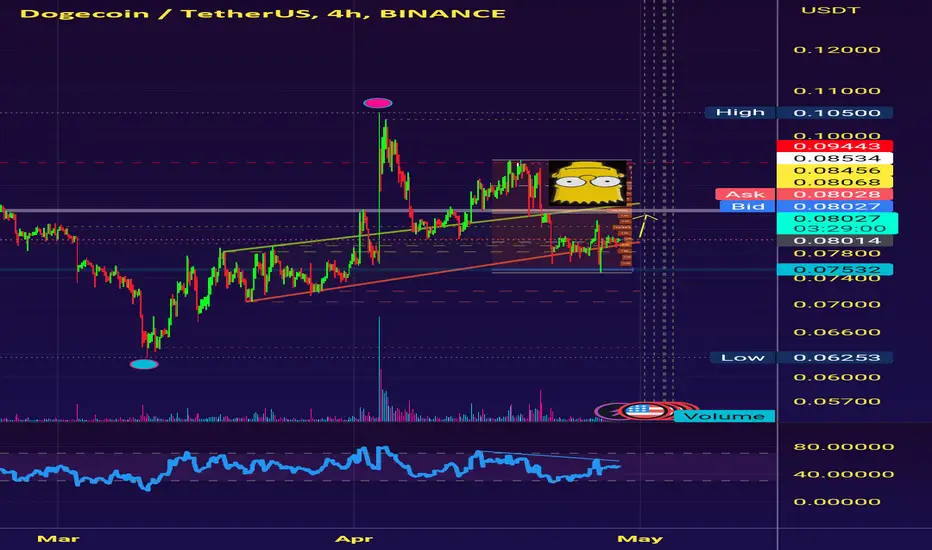
Doge coin ... 🐕The Bat pattern is reversed and I think it will reach 92-95 based on Fibonacci and RSI.
Shiba Inu ,,, Bat 🦇 or crab pattern 🦀It is bit difficult for analysts to recognize this pattern
,But I hope that the bat 🦇 pattern will take place , set the loss limit and the profit limit so that you don't lose ..

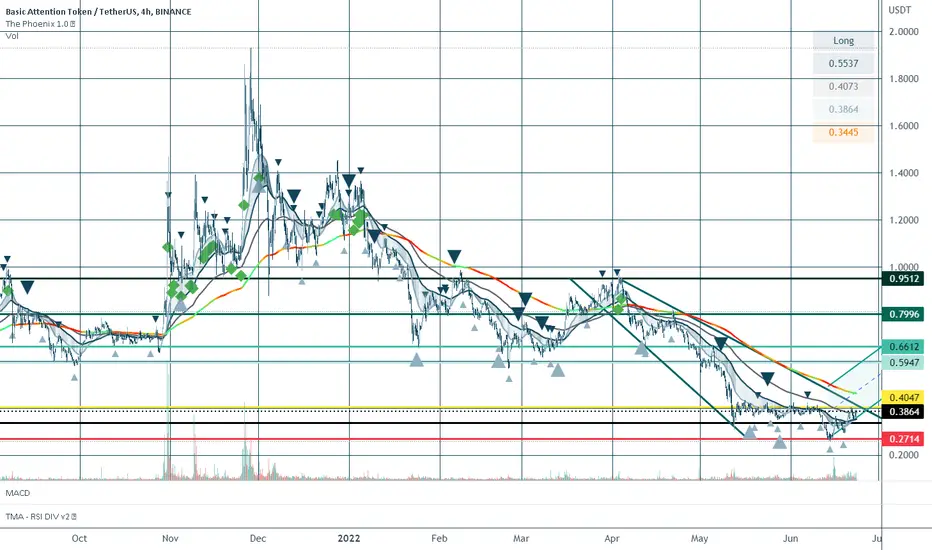
BAT/USDT Long - Bullish pattern reversal - Buying DipBAT/USDT - Looks set to/has shown signs of reverse bullish pattern with the broadening ascending wedge now turning resistance of 0.35 into Support.
Buy at 0.369
SL - 0.3401
TP - 0.949
Conservative -
Buy - 0.4
TP - 0.55 - 0.6
Ascending channel is strictly a visualisation to keep theory in check.
Hope this helps.
Any feedback please let me know -
Cheers,
HiHo Crypto
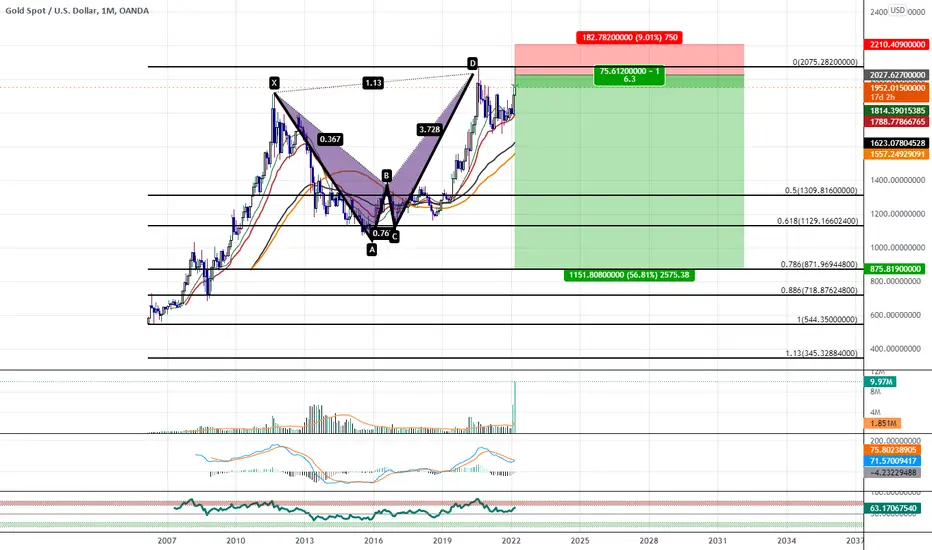
Bearish Alt Bat Visible On Gold's Monthly ChartThis is an update to the First Post I made on Gold's Bearish Alt-bat last year just to let you know that it is still in play and that it has just come back up to tap the PCZ a Second Time and this time on Greater Volume this looks like it could be the end and where Gold begins a Presumably Years Long retrace back to the zone between $1,129 and $718.80
If you want to see my original posting from last year on this Alt-Bat i have it on the related ideas section below.
AAPL (Apple) - Completly new to this world... Just need advice.Hi, hope you're having a positive day!
I saw this 3 interesting patterns on h1 ( AAPL ), i just want to know what do you think:
-The BAT (a) pattern has nearly reached its first target (0.382).
-The CYPHER (b) pattern has reached its 2 targets (0.382 and 0.618).
-The BAT (c) pattern is still forming, im waiting for a D on 0.886...
Am i crazy?
If you see some errors let me know, i appriciate.
Thanks for giving me your time and attention, have a lovley and profitable day!
*Disclaimer : do not use my graph for trading on the real market,
im completly unexpert in this sector,
i do not take any responability if you are going to ignore my disclaimer.

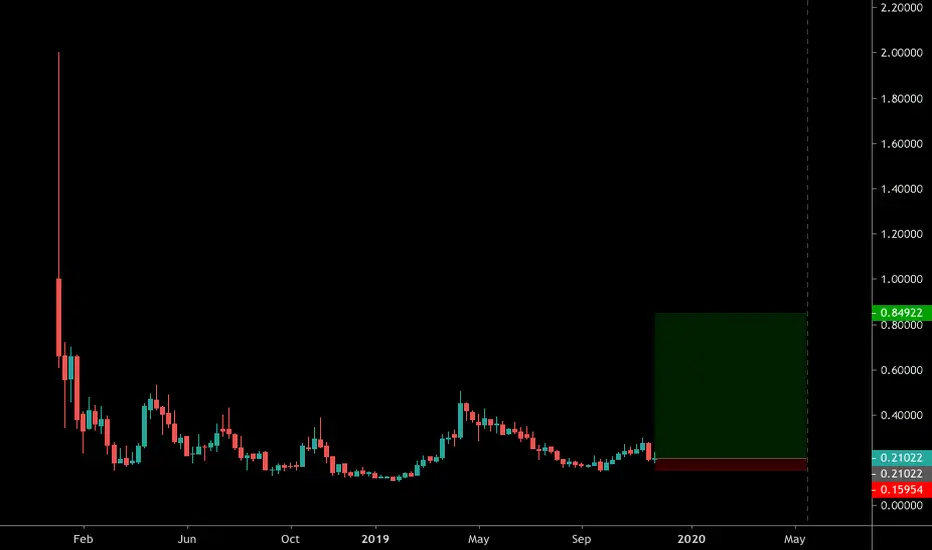
BAT-USDC Breaking DowntrendBAT-USDC has been in a downtrend since late April 2019 and has finally broken the downtrend with confirmation.
Buying at these price levels ($0.18 to $0.20) provides a great risk/reward ratio.
This trade is more of a multi week/month swing trade.
Stop loss should be placed at the recent low, which is around $0.165.


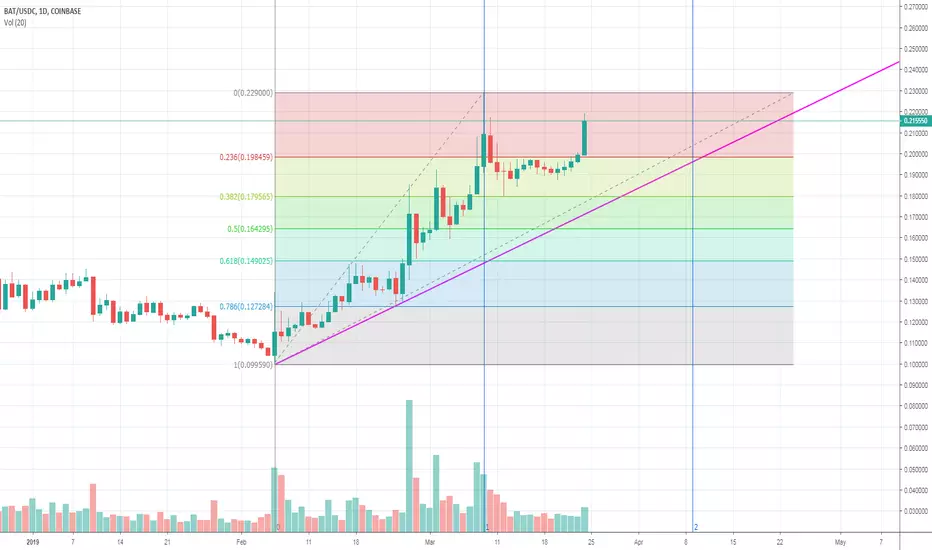
Basic Attention Token (BAT) Buying PointsFor people that believe in BAT and would like to hold it for the long term, I recommend buying from the following points based on the Fibonacci analysis and the current uptrend.
1) Buy If it breaks $0.23
2) Buy if it pulls back towards the uptrend, which is currently at $0.18 but will rise with time. Of course, it would be best to buy at a point where the uptrend and a fib level intersect but this is not guaranteed to happen.
Stop loss for scenario 1 would be $0.215 (>7% loss).
Stop loss for scenario 2 would be $0.163 (>10% loss if bought around $0.18).
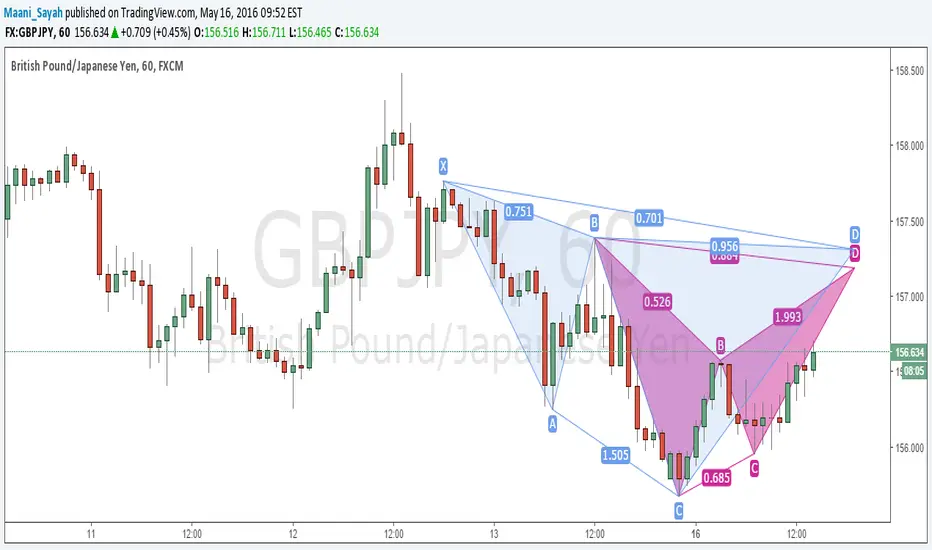
POTENTIAL GBPJPY BAT AND CYPHER PATTERN2 potential advanced patterns completing close to each other, both indicating a possible bearish move