Bitcoin Cash: Altcoins Market Bullish Continuation Confirmed!The rise in late 2024, Nov-Dec, lasted only one month. This time the situation is much more different, it confirms what we already know, a major altcoins bull market.
Bitcoin Cash (BCHUSDT) has been growing for 85 days. No strong upthrust with high volatility, but steady growth, the type that exudes strength. At one point there will be a major impulse and this one will be followed by additional growth. What you are seeing is only the start.
Bitcoin Cash helped us predict a continuation of a bullish move for the altcoins several weeks ago. You can reach the same conclusion again. The fact that Bitcoin Cash is bullish now, confirms that the entire altcoins market will continue to grow.
Thank you for reading.
Namaste.
J-BCH
Is #BCH About to Fall or Will it Continue to Rise? Key LevelsYello Paradisers! Have you seen what’s cooking on #BCHUSDT lately? Let’s dive into the latest structure on #BitcoinCash and what may unfold next:
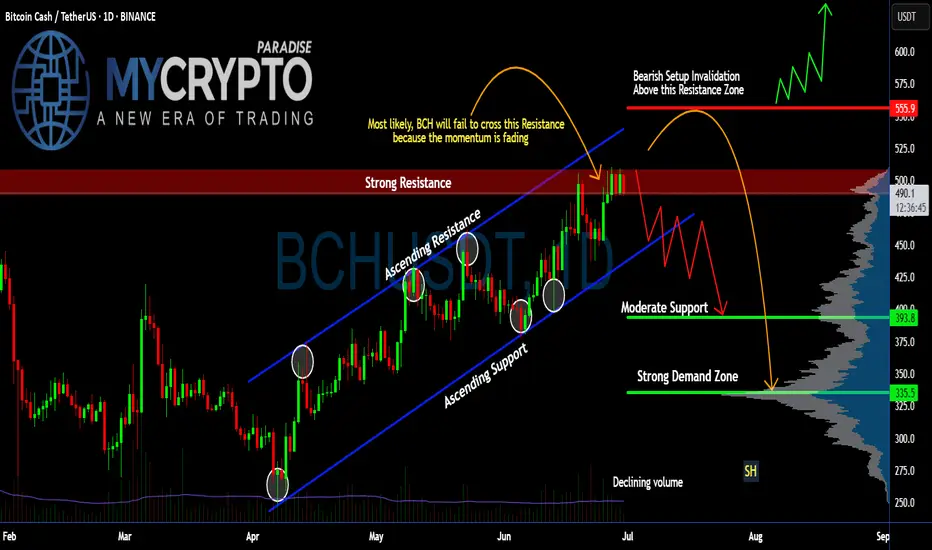
💎#BCH has been trading within a well-respected ascending channel since early April, consistently bouncing between dynamic ascending support and resistance levels. However, the current move into the $500–$505 resistance zone is showing clear signs of momentum exhaustion, as price stalls and volume fades.
💎The strong resistance area between $500 and $505 has rejected price multiple times, and this recent rejection aligns with both the channel resistance and a bearish momentum divergence in volume. Unless #BCHUSD can break and hold above this zone, bulls are fighting a losing battle.
💎The invalidation of the bearish setup lies above $555. Only a confirmed breakout and sustained hold above this level would negate the current bearish structure and open room for a larger bullish expansion. Until then, the risk of a deeper retracement is very real.
💎Currently trading around $490, #BCH looks vulnerable to a drop toward the moderate support zone near $393, with the strong demand zone between $335 and $340 being the high-probability area for a smart-money reaccumulation—if the market flushes weak hands first. This zone also lines up with previous high-volume nodes on the VRVP.
Trade smart, Paradisers. This setup will reward only the disciplined.
MyCryptoParadise
iFeel the success🌴
Bitcoin Cash, Anomaly or Predictive Signal?Some people can say that Bitcoin Cash right now is simply an anomaly, nothing to see here. But a closer look reveals nothing abnormal, more likely a very strong predictive signal that supports what we saw happening with the COIN stock and what was predicted recently to happen with ETHUSDT (Ethereum), that is, a very strong bullish breakout is the next main major market move.
Good morning my fellow Cryptocurrency trader, I hope this day finds you well.
How are you feeling?
Introduction —The market is one
In isolation, the market is tricky and hard to predict. Within a bigger context, we can easily predict what will happen next. Just look at Bitcoin Cash, it shows exactly what will happen because it has been being in perfect syntony with the rest of the market.
Many pairs are consolidating or retracing. My view is that a bullish move comes next.
Let's see how Bitcoin Cash has been behaving lately and compare this to the rest of the market. The fact that it is bullish now predicts that also the other pairs will be bullish because they are moving in the exact same way.
Price action —Past history
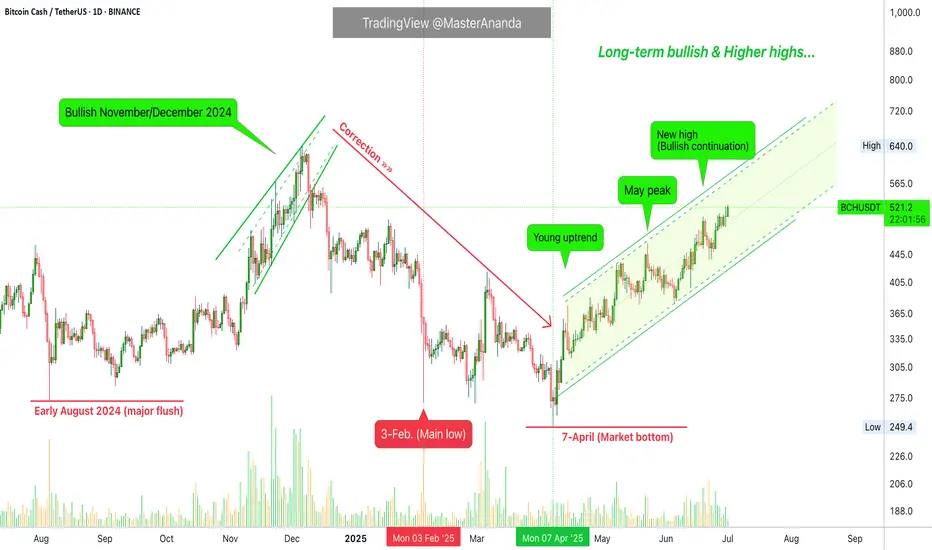
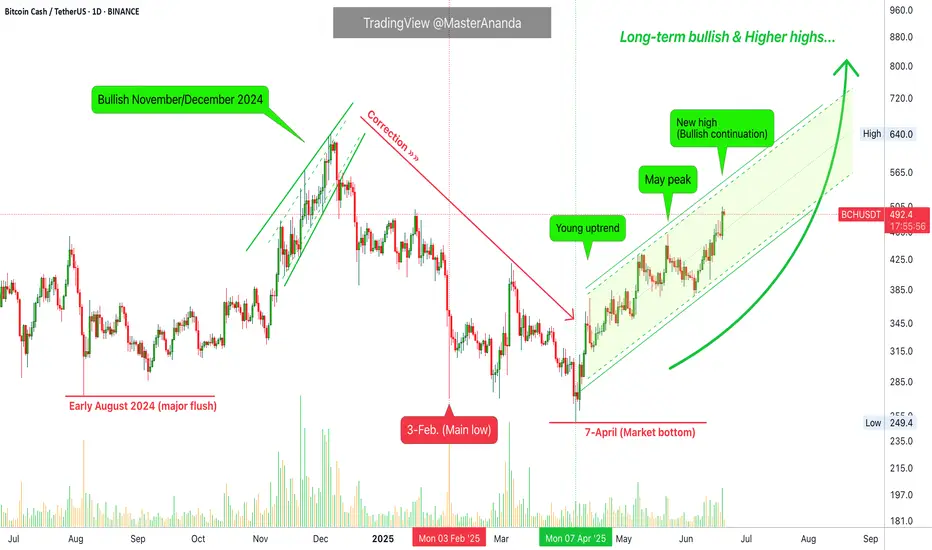
A crash ends in early August 2024. By late 2024 the action goes bullish. November 2024 marks the start of a month long advance that ends December 2024. This is true for most of the altcoins market.
The December 2024 peak leads to a correction with the main low happening 3-February. Another low and market bottom happens 7-April 2025. From this point on, we have a recovery and after a high in late May, the market goes into retrace.
Present day
This retrace is where we are today for most of the pairs. 100% of these are trading within a higher low compared to 7-April. Here BCHUSDT ended its retrace and moved ahead of the pack to hit a higher high compared to May. It also produced the highest price since January 2025.
The future
This is not an anomaly. Bitcoin Cash's price action simply reveals what is coming to the rest of the market. As it moved in perfect synchrony with other projects for months or even years, it will continue to do the same. The fact that it is trading higher now, means the other pairs will follow, in fact, some other pairs are already there; a bullish continuation.
Soon everything will grow.
Thank you for reading.
Namaste.
Bitcoin Cash BCH price analysisMore than 3 months have passed since the publication of the previous idea for #BCH, and the price itself has shown an increase of +40%
◆ Slowly but surely growing
◆ Does not react to the price fall CRYPTOCAP:BTC (for those who don't know, #BCH is the first CRYPTOCAP:BTC fork and probably the only one that survived. Then there were 8-10 more of them in 2017-2018... but hey...)
◆ It has been moving in its own direction for more than a year, when OKX:BCHUSDT is cheaper than $300, it is actively bought back by someone.
We have slightly revised the growth target for #BitcoinCash, but why not consider this asset as a long-term investment from $350-400 to $900 and $1250
_____________________
Did you like our analysis? Leave a comment, like, and follow to get more

#BCH/USDT#BCH
The price is moving within a descending channel on the 1-hour frame, adhering well to it, and is heading for a strong breakout and retest.
We are experiencing a rebound from the lower boundary of the descending channel. This support is at 456.
We are experiencing a downtrend on the RSI indicator, which is about to break and retest, supporting the upward trend.
We are heading for stability above the 100 moving average.
Entry price: 471
First target: 480
Second target: 489
Third target: 500

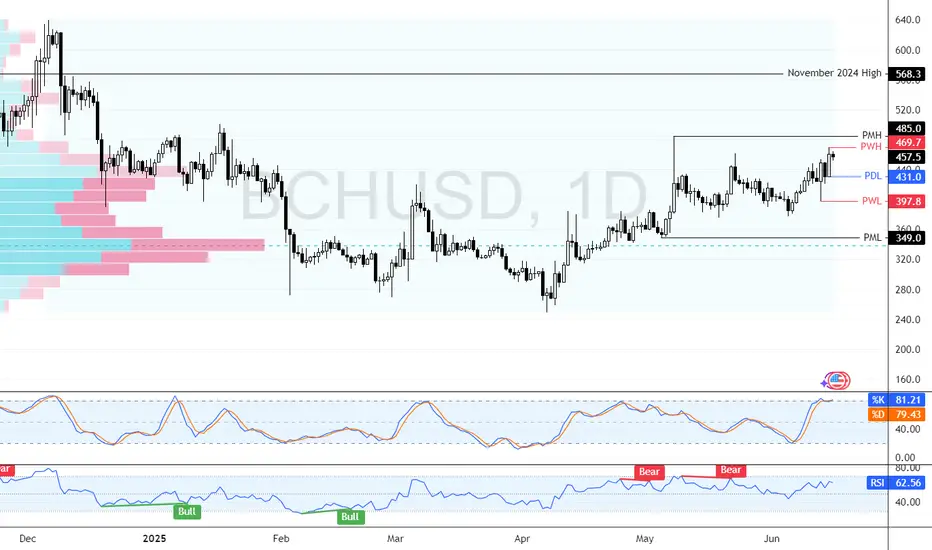
Bitcoin Cash Nears $485—Will BCH Hold Its Gains? FenzoFx—Bitcoin Cash remains bullish, nearing the previous monthly high at $485.0, though overbought conditions signal possible consolidation.
BCH/USD may stabilize around $431.0 before resuming its uptrend toward $485.0. A break above this level could pave the way for $568.0.
The bullish outlook holds as long as BCH stays above $349.0.
Bitcoin Cash Weekly Update, Moving Averages & Bullish PotentialI already looked at Bitcoin Cash recently, this time I want to see how the moving averages are doing here to compare with the other Crypto-projects. Good news for one pair is good news for other projects as well specially when they are in the same category. Bitcoin Cash is one of the big projects.
Here we can see BCHUSDT trading weekly above EMA34, EMA89 and MA200, while rising.
Resistance was found at $453, a fib. extension level. Once this level is broken as resistance you can expect a swift advance toward $680. It will be nice and easy. This is the last barrier and current price action is kind of mix.
It is good because this week trades at the highest since November 2024 coming from a low. It is bad because it is lower compared to 19-May on the wick but the week is yet to close.
A weekly close above $420 is highly desirable and favors the bulls, anything lower and we continue with a mixed situation. Make no mistake, the situation is mixed only short-term. The chart shows a clear bullish bias and there will be additional growth in the coming weeks and months. Only the short-term is questionable.
Bitcoin Cash, Bitcoin and the entire Cryptocurrency market is set to grow.
Thanks a lot for your continued support.
Namaste.
Bitcoin Cash Early Recovery & Bullish ContinuationToday's candle says it all. Bitcoin Cash moved to hit a low of $397, today, and the same session now trades at $449, the highest price since 23-May which was the date that produced the highest price since January 2025. This is an early recovery signal.
This signal is good and great but it needs one final bit to be confirmed, and that is a continuation tomorrow. The week is about to end and the close is what determines the next move. If the action closes above the 23-May high, $462, then ultra-bullish confirmed. If the session closes below then there is still room for some more shakeouts, retraces and corrections. But the early recovery signal is in. What one does, the rest follows.
Now, not all pairs will move in the same way. Some will continue lower, retrace, while some others produce an early recovery and move ahead.
Today's session is just too strong, we can easily say that Bitcoin Cash is ready to resume its bullish wave of growth. $684 next target, followed by additional growth.
Thanks a lot for your continued support.
Namaste.

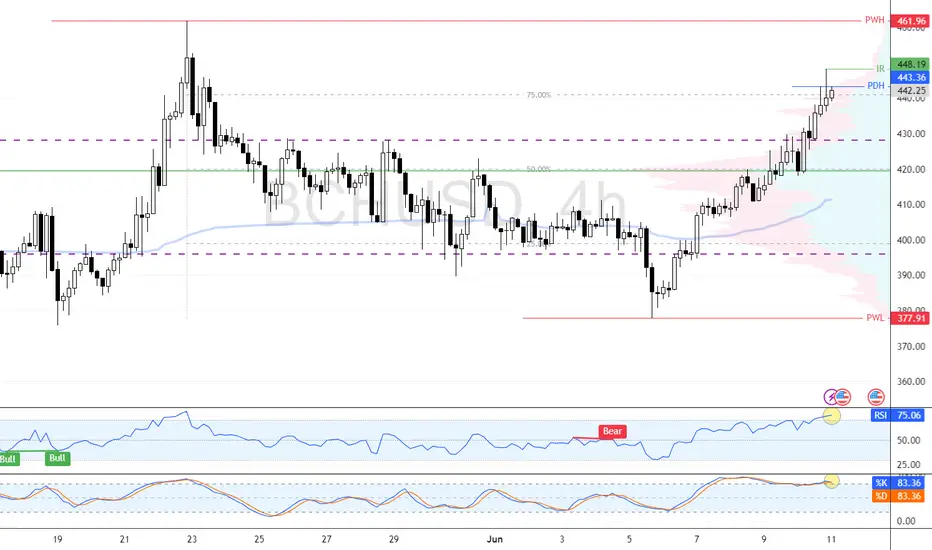
BCH/USD Consolidates Eying $461.9FenzoFx—BCH (Bitcoin Cash) paused its uptrend near $448.1, a low-volume zone, suggesting the rally may resume after consolidation.
Technical indicators show overbought conditions, increasing the likelihood of a short-term dip. BCH/USD may consolidate near $430.0 before aiming for the next target at $461.0.
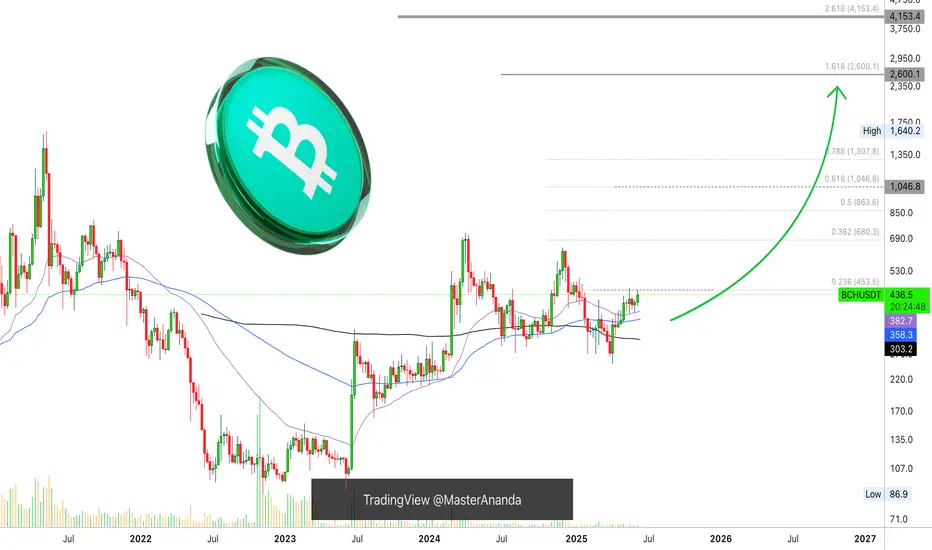
Everything Bitcoin Cash Points To a New ATH; $2,600 or $4,150?Bitcoin Cash is bullish, ready to grow within the bullish zone. There is zero doubt. I think it will be hard to know if the peak will happen around $2,600 or $4,150. There is a huge difference.
Knowing how erratic BCH has been in the past, we have to go with the second higher target; what do you think?
It is hard to say but we have two targets mainly for late 2025. There is no doubt that we will get a new all-time high we just don't know how high.
I will go with the second one just in case. Say this bull market top for Bitcoin Cash will reach somewhere around $4,000. Can be more or less.
You can leave a comment with your number.
How far up do you think Bitcoin Cash will go?
And remember, the bullish bias is already confirmed. Everything points up. The chart, the indicators, the patterns, the signals, the overall market, everything... Thank you for your continued support.
If you enjoy the content make sure to follow.
Namaste.
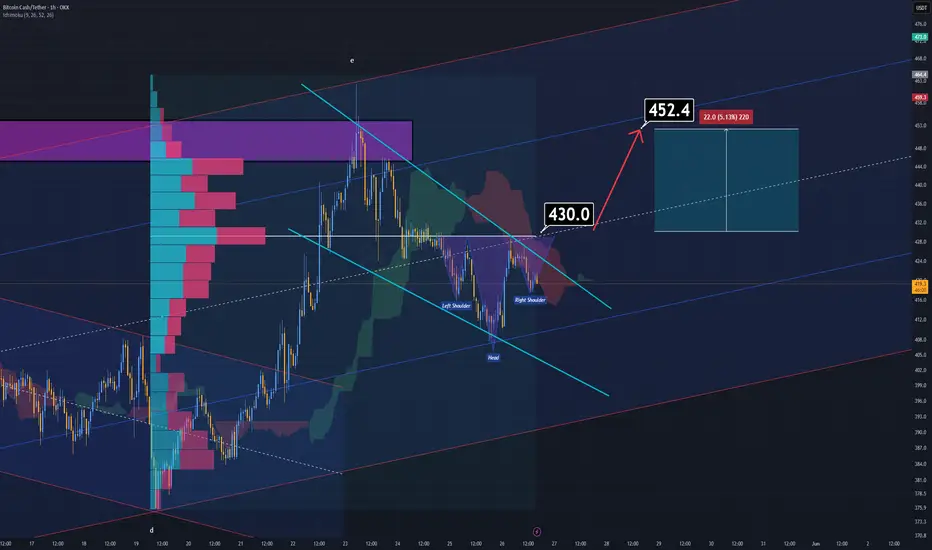
BCH Analysis for Scalpers (1H)Bitcoin Cash (BCH) is currently showing multiple technical signals that support a potential bullish continuation.
A reversed Head and Shoulders pattern is in the process of forming, and it aligns well with several key confluences — including the Ichimoku Cloud and volume profile support zones.
A breakout above the $430 level would not only confirm the pattern but also activate a bullish flag formation, adding further momentum to the setup. In that case, the next immediate target would be around $452.4.
This setup remains valid only upon confirmation of the breakout. Until then, caution is advised — a clean break and retest would offer the most favorable entry.
— Thanks for reading.
Crypto update for 2025.05.22Bitcoin hits a new all-time high, but others are lagging. What's the deal?
Let's dig in...
CRYPTO:BTCUSD
CRYPTO:BCHUSD
CRYPTO:ETHUSD
CRYPTO:XRPUSD
CRYPTO:LTCUSD
CRYPTO:DOGEUSD
CRYPTO:DOTUSD
CRYPTO:TRXUSD
Let us know what you think in the comments below.
Thank you.
77.3% of retail investor accounts lose money when trading CFDs with this provider. You should consider whether you understand how CFDs work and whether you can afford to take the high risk of losing your money. Past performance is not necessarily indicative of future results. The value of investments may fall as well as rise and the investor may not get back the amount initially invested. This content is not intended for nor applicable to residents of the UK. Cryptocurrency CFDs and spread bets are restricted in the UK for all retail clients.

Bitcoin Cash, The Map! Technical Analysis GeniusEvery time I look at the chart I consider the possibilities of a bear market. You've seen me bullish, you know I am bullish and I share the signals, but I always stay open to being wrong so I keep on looking to see if I can find something that I might be missing.
To be honest, if the signals were there I wouldn't be able to see them, I am too hypnotized by hundreds of charts hitting bottom and recovering from this bottom to think that a bear market is just starting now. Bear markets tend to start from a major wave high or new All-Time High.
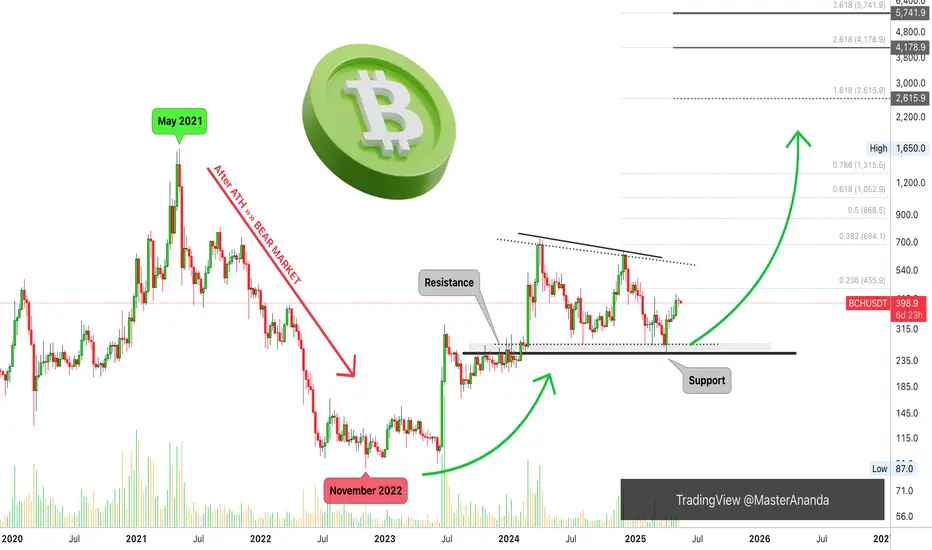
Here we have Bitcoin Cash, see May 2021.
The ATH, the top, leads to a strong bear market. Notice that a bear market does not happen from bottom prices but from peak prices; obviously duh!
Ok, ok... My job is to clear all doubts for you but since you are reading this and you are my follower, you already know what is happening and we agree.
The zone that worked as resistance in late 2023, worked as support in April 2025, last month.
There was a bottom in November 2022. From the bottom we grow.
This bottom signaled the start of the new bull market.
The low in April is a long-term higher low. From this low we will experience the latter part of this long-term growth period, but it continues.
The incoming bullish wave will produce a new All-Time High. This ATH will be followed by a bear market. The bear market will end in a long-term higher low. This higher low we will call a bottom, the bottom of that bearish cycle and from this bottom a new wave of growth and so on. It keeps on happening long-term.
This is good for today.
Enjoy the chart for the All-Time High targets.
Thank you for reading.
Namaste.
Bitcoin Cash Short-Term: Trading Above Support And...Ever since 7-April, which marks the correction bottom and trend reversal, the maximum we have is three consecutive days closing red. This is great news.
Currently BCHUSDT closed the last three days red. This is the fourth day.
1) It can happen that this day also closes red, this puts pressure on tomorrow being green based on past action.
2) It can happen that todays ends up closing green and the market starts to turn.
This is not only true for this period but also other periods. Whenever Bitcoin Cash is rising, long sequences of bearish days are rare to come by.
If the market starts to turn, the current down period will result in nothing more than a very short stop with minimum retrace before additional growth. This is a transition period. The whales move billions of dollars and the algorithms need to be recalibrated, "reprogrammed," after just a few weeks.
Each time a set of Altcoins move forward for several weeks, there is a small pause, the programs are updated, the money is positioned and a new set of Altcoins will grow. The previous set can continue growing but the top performers tend to change. You will see this happening week after week after week throughout the entire bull market.
The trick to achieve high profits is to forget about catching the next big wave. Choose your pair and hold, if you look closely, it has been growing day after day after day. When you try to catch the next wave, it is always too late, but everything is growing slowly, we are soon to be one level up marketwide. I predicted 2-3 levels up by the end of the month. Watch!
Bitcoin Cash already produced more than 70% growth since the 7-April bottom. It will continue rising long-term, this is only the start.
Diversification can be a good strategy if you want to catch those moving up strong. But it is better to focus on strategy and sure success rather than excitement and perceived high gains. The market is growing anyway and it is not going away.
Do it right and you will earn more mid-, short- and long-term.
Namaste.
TA on BCHUSD - 2025.05.14This is a quick technical analysis piece on Bitcoin Cash ( MARKETSCOM:BCHUSD ).
Let's dig in!
CRYPTO:BCHUSD
Let us know what you think in the comments below.
Thank you.
77.3% of retail investor accounts lose money when trading CFDs with this provider. You should consider whether you understand how CFDs work and whether you can afford to take the high risk of losing your money. Past performance is not necessarily indicative of future results. The value of investments may fall as well as rise and the investor may not get back the amount initially invested. This content is not intended for nor applicable to residents of the UK. Cryptocurrency CFDs and spread bets are restricted in the UK for all retail clients.

BCH short range high ideaBCH could be forming structural loss lower time frame that could at least give a small pullback into the demand below offering a scalp short opportunity

Crypto update for 2025.05.08A quick little technical crypto update for 2025.05.08.
Let us know what you think.
CRYPTO:BTCUSD
CRYPTO:BCHUSD
CRYPTO:ETHUSD
CRYPTO:XRPUSD
CRYPTO:DOGEUSD
CRYPTO:DOTUSD
CRYPTO:TRXUSD
Let us know what you think in the comments below.
Thank you.
77.3% of retail investor accounts lose money when trading CFDs with this provider. You should consider whether you understand how CFDs work and whether you can afford to take the high risk of losing your money. Past performance is not necessarily indicative of future results. The value of investments may fall as well as rise and the investor may not get back the amount initially invested. This content is not intended for nor applicable to residents of the UK. Cryptocurrency CFDs and spread bets are restricted in the UK for all retail clients.

Mid-term uptrend starts: 333.5-348.2 or higher
Hello, traders.
If you "Follow", you can always get new information quickly.
Please click "Boost" as well.
Have a nice day today.
-------------------------------------
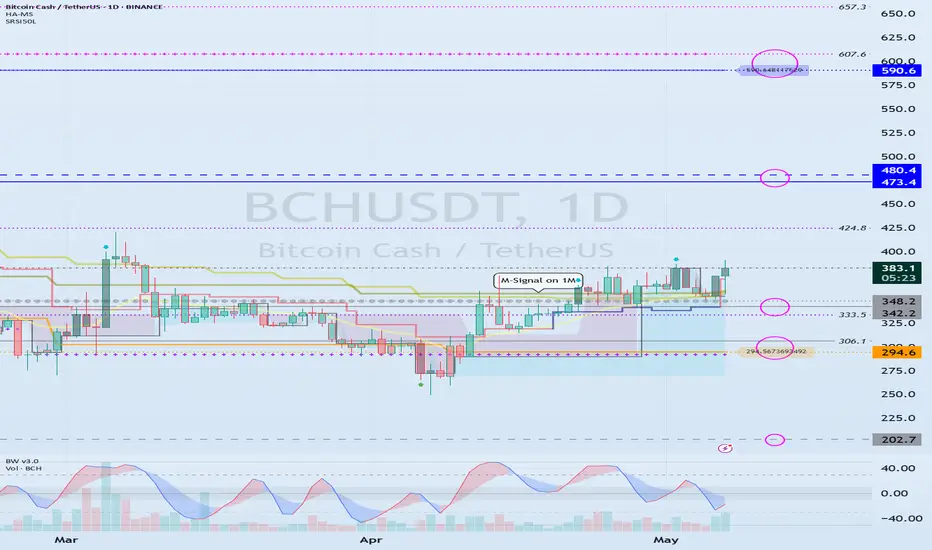
(BCHUSDT 1D chart)
The M-Signal indicators on the 1M, 1W, and 1D charts are showing an upward trend in a convergent state.
Accordingly, if the price is maintained above 333.5-348.2, it is expected to continue the uptrend in the mid- to long-term.
If the uptrend continues,
1st: 473.4-480.4
2nd: 590.6
You should respond depending on whether there is support near the 1st and 2nd above.
If it falls below 333.5, you should check if it is supported around 294.6.
-
Thank you for reading to the end.
I hope you have a successful trade.
--------------------------------------------------
- Here is an explanation of the big picture.
I used TradingView's INDEX chart to check the entire range of BTC.
I rewrote it to update the previous chart while touching the Fibonacci ratio range of 1.902 (101875.70) ~ 2 (106275.10).
(Previous BTCUSD 12M chart)
Looking at the big picture, it seems to have been maintaining an upward trend following a pattern since 2015.
In other words, it is a pattern that maintains a 3-year bull market and faces a 1-year bear market.
Accordingly, the bull market is expected to continue until 2025.
-
(Current BTCUSD 12M chart)
Based on the currently written Fibonacci ratio, it is displayed up to 3.618 (178910.15).
It is expected that it will not fall again below the Fibonacci ratio of 0.618 (44234.54).
(BTCUSDT 12M chart)
Based on the BTCUSDT chart, I think it is around 42283.58.
-
I will explain it again with the BTCUSD chart.
The Fibonacci ratio ranges marked in the green boxes, 1.902 (101875.70) ~ 2 (106275.10) and 3 (151166.97) ~ 3.14 (157451.83), are expected to be important support and resistance ranges.
In other words, it seems likely that they will act as volume profile ranges.
Therefore, in order to break through these ranges upward, I think the point to watch is whether they can receive support and rise near the Fibonacci ratios of 1.618 (89126.41) and 2.618 (134018.28).
Therefore, the maximum rising range in 2025 is expected to be the 3 (151166.97) ~ 3.14 (157451.83) range.
In order to do that, we need to see if it is supported and rises near 2.618 (134018.28).
If it falls after the bull market in 2025, we don't know how far it will fall, but based on the previous decline, we expect it to fall by about -60% to -70%.
Therefore, if it starts to fall near the Fibonacci ratio 3.14 (157451.83), it seems likely that it will fall to around Fibonacci 0.618 (44234.54).
I will explain more details when the bear market starts.
------------------------------------------------------
Bitcoin Cash, 200% In 3 WeeksThis is my idea, Bitcoin Cash will grow some 100-200% within the next 2-3 weeks, what do you think?
Sounds-looks possible?
It would have to be a very strong rise but I think it is possible maybe a bit longer but for higher prices.
The first target here for a long-term higher high and the higher in years sits at $993. The next target is $1,439. The All-Time High is $1,650 and we know there will be a new All-Time High in 2025.
So maybe 200% in two weeks is too much for Bitcoin Cash because it is too big, but this based only on left brain logical thinking. Bitcoin Cash can grow 200% in the coming weeks. 2-3 weeks. It can happen fast and then after a strong retrace additional but long-term growth. Makes sense?
It can happen. Cryptocurrency is wild and while it has been slow for years that's only because these were the years of slow. When it goes fast it is the time of being fast and all can happen in a flash. By the time we try to act or react it is already too late and the action has gone off the chart.
It is a guess, a prediction. I don't know if it will grow 200%, 300% or 500% but I know for certain it will be going up.
The consolidation period is over. This week is the fifth week since the correction low.
The market is bullish now and the next advance will produce the highest prices since November 2021.
It will be easy for Bitcoin Cash to grow by 200%. A new All-Time High will be very interesting, it's been so long.
Are you ready for what the market is preparing?
I hope you are.
Namaste.

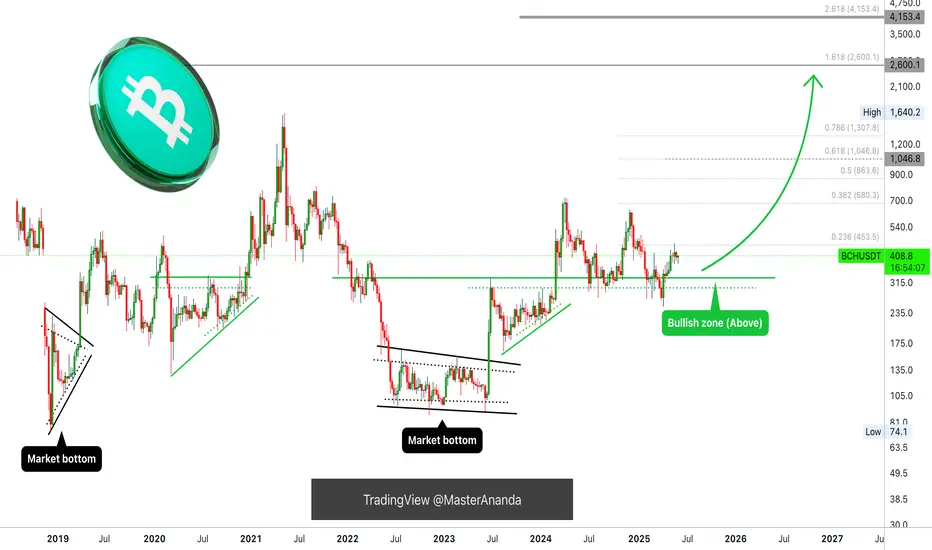
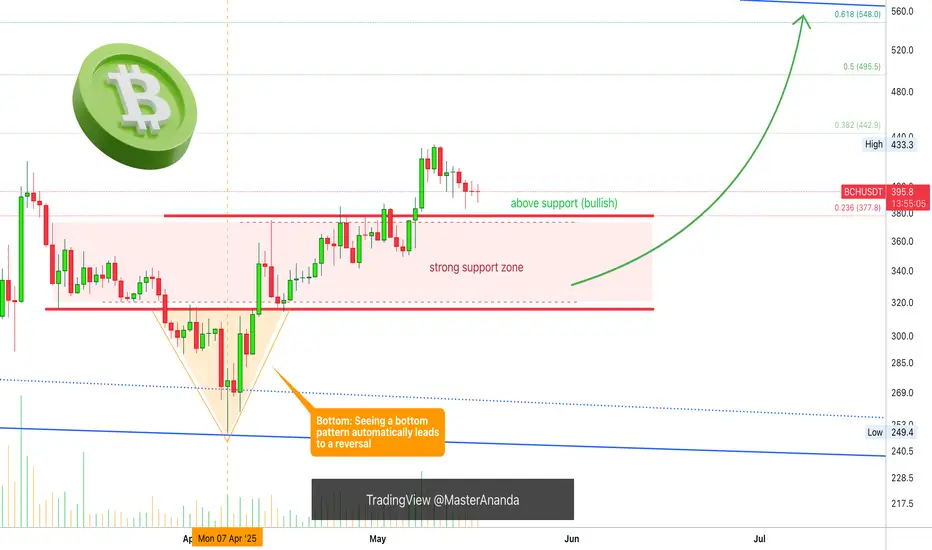
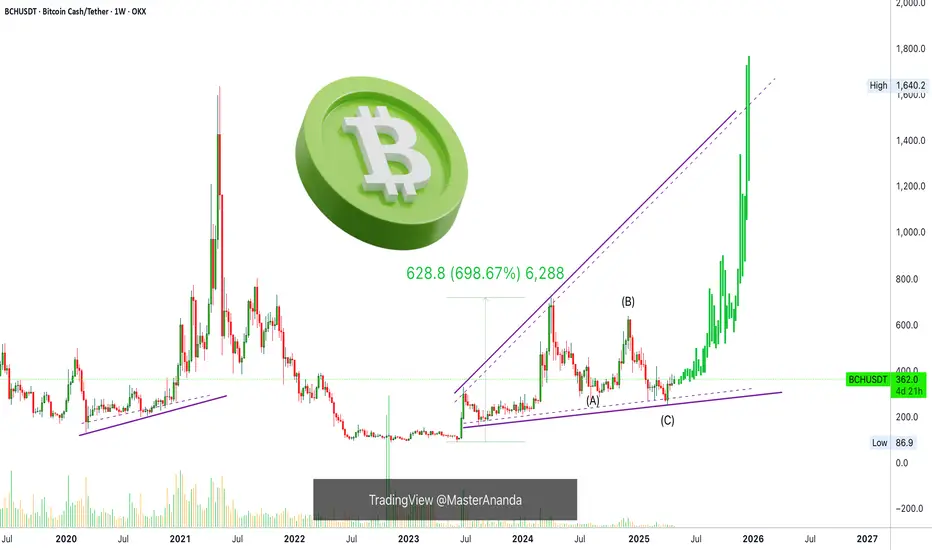
Bitcoin Cash —An Opportunity That Cannot Be MissedBitcoin Cash already grew quite a bit between June 2023 and April 2024, total growth from bottom to top amounts to 699%, but this is not all.
Right now the conditions are perfect for the continuation of this long-term bullish phase. The bear market bottom was hit in June 2022, after an entire year of sideways action, Bitcoin Cash broke up and produced the chart that we are looking at now. It has been a sequence of higher highs and higher lows.
Between April 2024 and April 2025, we have a long-term correction, a classic ABC.
The C wave is a higher low compared to the low that was hit in August 2023. The next high is a projected higher high compared to the start of the ABC correction, April 2024. This higher high is likely to turn into a new All-Time High.
This is the last chance to enter while prices are low. Just in 2-3 weeks time, Bitcoin Cash will be trading many times higher and it will never move this low again.
Do what you have to do. Think if you have to think. Plan if planning is what you need; but, keep in mind that this is an opportunity that cannot be missed.
Namaste.
The Bitcoin Cash bull runBitcoin Cash began its bull run in June of 2023
Long entry: 370 USD
Take profit: between 200 k / 1.2 million USD
This is my personal opinion and this is not a financial advice! Good trading!

The Bitcoin Cash/Bitcoin bull runBitcoin Cash is ready to start its epic bull run!
Long entry: 3700 sats
Take profit: between 0.60 / 1.40 btc
This is my personal opinion and this is not a financial advice! Good trading!

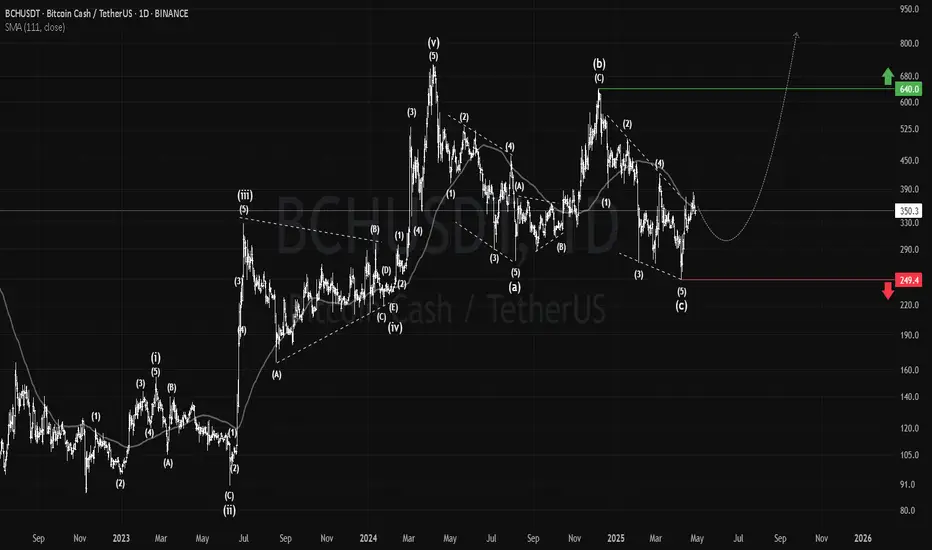
BCH: The Daily T-F Bullish Idea#BCH appears to have completed its correction from the April 2024 top.
Holding above $249 (the stop-loss) is as a key support.
Passing $640 would confirm a major bullish reversal by breaking the higher time-frames bearish trend.
#BitcoinCash