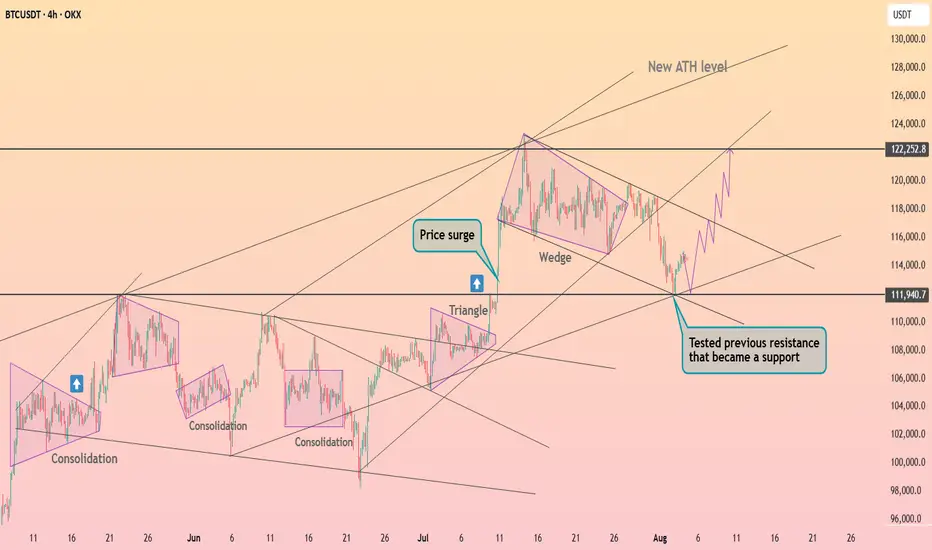
Bitcoin fixed above the $112k ┆ HolderStatOKX:BTCUSDT is recovering after touching the $111,940 zone, now confirmed as strong support. The price is reversing from the lower wedge boundary, suggesting renewed momentum. A clean push could retarget $122,250 in coming sessions.
J-BTC
Litecoin (LTC) – Re-Entry After 44% RallyLTC rallied over 44% since our last trade setup. Now, we’re looking for a re-entry opportunity as the broader crypto market shows signs of a potential pullback.
🔍 Setup Overview:
Entry Zone: $108 – $103
Take Profits: $125 / $140 / $150
Stop Loss: Daily close below $100
Bias: Bullish continuation (as long as structure holds)
🧠 Trade Idea:
Expecting a possible sweep of the $104 low before upside resumes. Key condition: Daily candle must not close below $100—wicks are fine. If price respects this level, the bullish structure remains intact.
This is a classic liquidity grab scenario. Entering in the $108–103 zone allows favorable risk-to-reward if LTC catches support and reclaims momentum.
⚠️ Invalidation:
If LTC posts a daily close below $100, trade setup becomes invalid. Monitor price action closely around this key support zone.

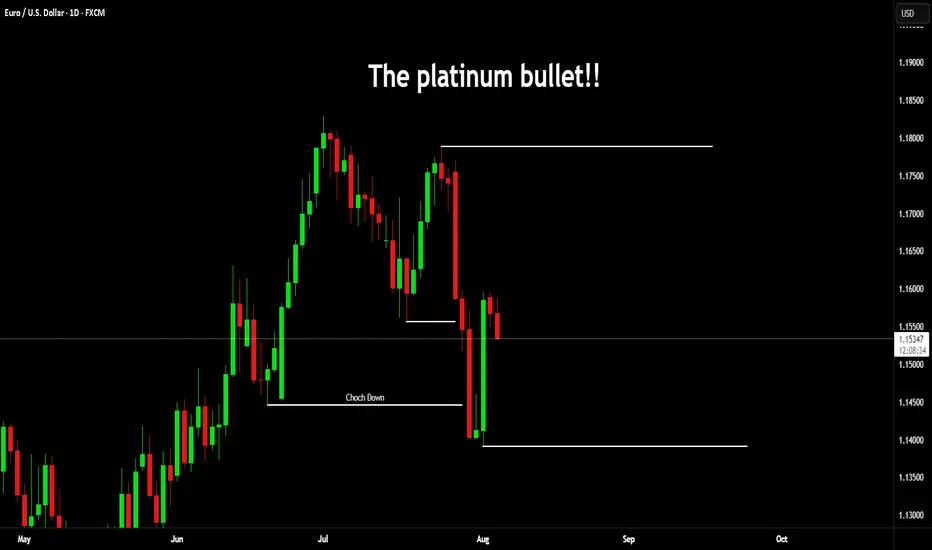
The Platinum BulletOver the years, I have posted a lot of educational content here on TradingView. Everything from Elliot waves to Wyckoff, psychology to Gann.
I have been lucky as a trader, 25 years doing this you pick up a thing or two. But above everything else, what you realise is that trading is a mindset game and not a technical one.
Many new traders try their luck. They are either experts in another field or simply successful in something else, or they come to the trading arena seeking wealth.
Both tend to get humbled quickly.
It is common for many new traders to put so much emphasis on the strategy, they overlook the psychology. You see, a strategy might work for someone, but you can't get it to work for you. This could simply be the time on the charts you lack, the timeframe or the instrument you are trading. The account balance or the fact you are not used to seeing 3-4 losses in a row.
When it comes to trading, less really is more!
Here's a simple one for you.
Take the mechanical range post I posted.
Now look at this;
On the larger timeframes we can see clearly the ranges and the supply/demand.
Then dropping down to the daily.
This is where, the technical aspect becomes less important and the psychology behind the move shows it's hand.
I have added volume and the AD line just to show how obvious this can be.
What do you see? Well as the price goes up, the volume goes down, we know we took liquidity to the upside.
So, if nothing else you would anticipate a pullback phase.
Then you get the clarity. Price drops and then pushes back, yet fails to make a new high. Almost like the volume told you it was about to happen.
Where did it pull back to?
Adding a simple volume profile too, from the swing high to the swing low. You can see the majority of the sell off (PoC) happened at a specific price point. Price pulled back to exactly that region before dropping.
The drop caused a local change in character and immediately took out the swing low - the last swing low of the leg up. (the real change in the trend).
There is obviously more to cover than this, but that is for another post.
Once you learn the way markets capitalise on the fear, the greed, the herd mindset, sentiment of the retail crowd. You can use the sentiment analysis in your favour.
You don't need 6 screens, fancy indicators, there is no silver bullet or 100% win rate strategies. And no a bot won't make you a Billionaire overnight.
If it was that easy, we would have no doctors, lawyers or firefighters; they would all be professional Bot traders.
Simplify your approach, put emphasis on the proper mindset, psychology and risk management and you will do alright!
Stay safe in the markets!
Some other recent posts;
Disclaimer
This idea does not constitute as financial advice. It is for educational purposes only, our principal trader has over 25 years' experience in stocks, ETF's, and Forex. Hence each trade setup might have different hold times, entry or exit conditions, and will vary from the post/idea shared here. You can use the information from this post to make your own trading plan for the instrument discussed. Trading carries a risk; a high percentage of retail traders lose money. Please keep this in mind when entering any trade. Stay safe.
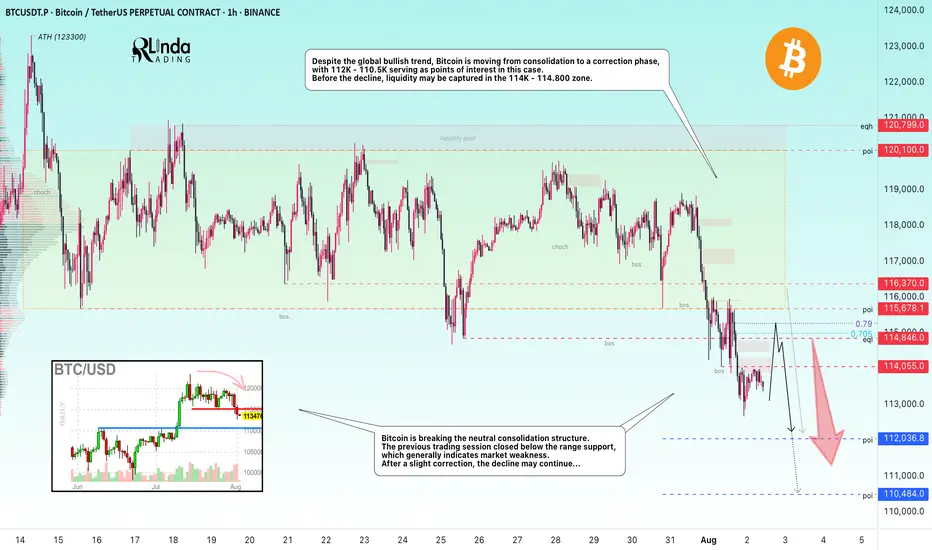
BITCOIN → From consolidation to distribution. Market weaknessBINANCE:BTCUSDT.P is moving from consolidation to a correction phase. The price broke through the support zone of 114.5–115.5, closing within the Friday trading session in the sell zone...
Previous idea from July 22: BITCOIN → Consolidation and compression to 116K. Correction?
The fundamental background is shifting to neutral, the hype has temporarily ended, and there are no bullish drivers yet. And for the health of the market, a correction is needed. Bitcoin is breaking the neutral consolidation structure. The previous trading session closed below the support range, which generally indicates market weakness. Despite the global bullish trend, Bitcoin is moving from consolidation to a correction phase, with 112K - 110.5K serving as points of interest in this case. Before the fall, liquidity may be captured in the 114K - 114.800 zone.
Resistance levels: 114.05, 114.85, 115.67
Support levels: 112.03, 110.48
After a strong movement, the market may enter a correction or local consolidation, during which it may test the specified resistance zones before continuing its downward movement to the zone of interest and liquidity at 112 - 110.5.
Best regards, R. Linda!
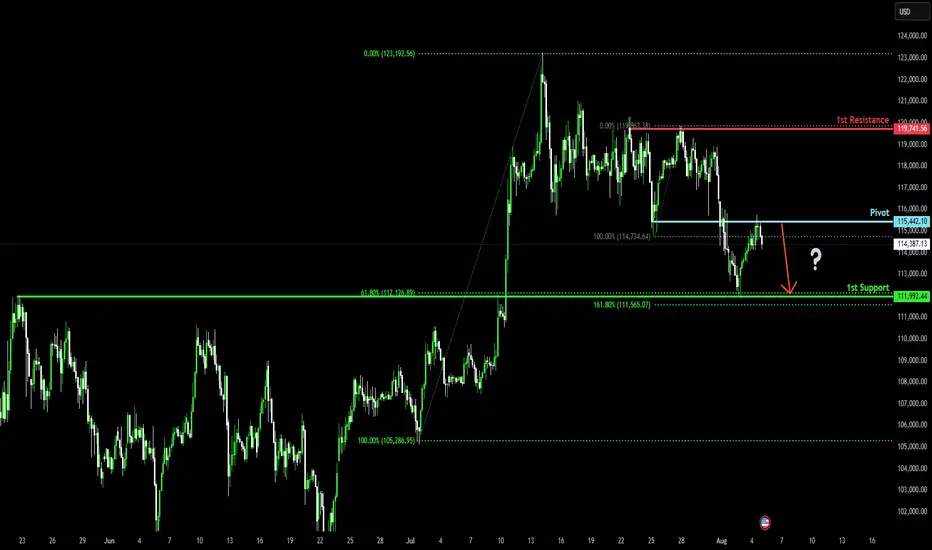
Bearish drop?Bitcoin (BTC/USD) has rejected off the pivot and could drop to the 1st support, which aligns with the 61.8% Fibonacci retracement.
Pivot: 115,442.10
1st Support: 111,992.44
1st Resistance: 119,741.56
Risk Warning:
Trading Forex and CFDs carries a high level of risk to your capital and you should only trade with money you can afford to lose. Trading Forex and CFDs may not be suitable for all investors, so please ensure that you fully understand the risks involved and seek independent advice if necessary.
Disclaimer:
The above opinions given constitute general market commentary, and do not constitute the opinion or advice of IC Markets or any form of personal or investment advice.
Any opinions, news, research, analyses, prices, other information, or links to third-party sites contained on this website are provided on an "as-is" basis, are intended only to be informative, is not an advice nor a recommendation, nor research, or a record of our trading prices, or an offer of, or solicitation for a transaction in any financial instrument and thus should not be treated as such. The information provided does not involve any specific investment objectives, financial situation and needs of any specific person who may receive it. Please be aware, that past performance is not a reliable indicator of future performance and/or results. Past Performance or Forward-looking scenarios based upon the reasonable beliefs of the third-party provider are not a guarantee of future performance. Actual results may differ materially from those anticipated in forward-looking or past performance statements. IC Markets makes no representation or warranty and assumes no liability as to the accuracy or completeness of the information provided, nor any loss arising from any investment based on a recommendation, forecast or any information supplied by any third-party.
Bear trap on its way - Bitcoin Weekly Update August 4-10thThis week brings a series of macroeconomic and geopolitical developments that may influence global risk sentiment and, consequently, Bitcoin’s price trajectory.
On Monday, the U.S. releases Factory Orders, a key indicator of industrial demand. Surprises in this data can affect risk assets broadly, as they reflect business investment activity. Weak numbers would likely increase expectations of monetary easing, which tends to support Bitcoin.
On Tuesday, the spotlight turns to the ISM Non-Manufacturing PMI, a leading indicator for the U.S. services sector, which accounts for roughly 70% of GDP. A significant deviation from expectations—especially a decline—could reinforce rate-cut expectations and provide tailwinds for speculative assets like Bitcoin.
Thursday is a critical day, with the Bank of England's interest rate decision in focus. While direct effects on crypto are limited, a hawkish stance could weigh on global risk appetite if inflation concerns resurface. Also on Thursday, the U.S. releases its weekly Initial Jobless Claims—a timely barometer of labor market strength. A rising trend here would suggest economic cooling, strengthening the case for looser policy and potentially benefiting crypto.
However, the most geopolitically sensitive event this week is the reintroduction of country-specific reciprocal tariffs by the United States, taking effect on August 7. Affected countries include Canada (35%), Mexico (30%), and Brazil (50%). These measures could re-escalate trade tensions and trigger short-term market volatility. Retaliatory responses from these countries would likely fuel risk-off sentiment, pressuring assets across the board.
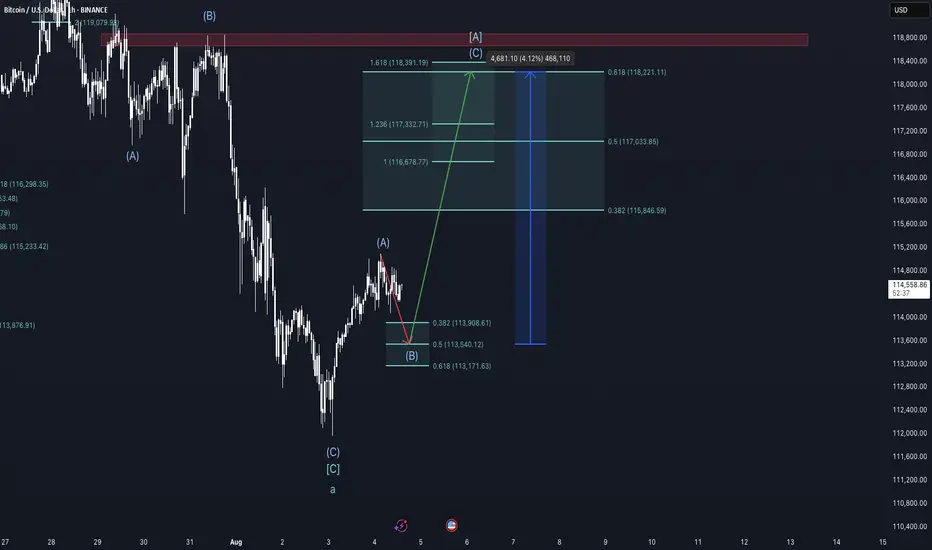
From a technical standpoint, Bitcoin remains within a multi-degree corrective structure according to the Elliott Wave framework. On the cycle degree, we are in a B-wave; on the primary degree, in an A-wave; on the intermediate degree, in a B-wave; and on the minor degree, in a C-wave. This implies that a short-term move lower is still expected, but once complete, a relief rally of approximately 4% could follow before the onset of a larger correction, likely Primary Wave B.
Chart structure suggests that Minor Wave C is in its late stages. Early signs of exhaustion, such as waning downside momentum or bullish reaction at key support zones, could offer clues of an approaching bottom. However, such a rebound should be viewed as temporary and not a trend reversal.
Taking a view between the lines on the on-chain data, the liquidity heatmap shows major liquidity around the red rectangle drawn into the chart, suggesting higher prices. Also, the rather low funding rate on futures suggest an exhausted downward trend and a trend reversal in the near future is likely.
Conclusion:
This week’s calendar offers several macroeconomic catalysts with the potential to move markets. U.S. economic data and tariff policy developments will likely shape near-term sentiment. Technically, Bitcoin remains in a corrective phase with limited downside left before a short-term recovery becomes more probable. Traders should stay alert for signs of a local bottom to position for a tactical bounce—but be cautious, as a larger correction likely looms beyond that.
This is no financial advice and for educational purposes only.
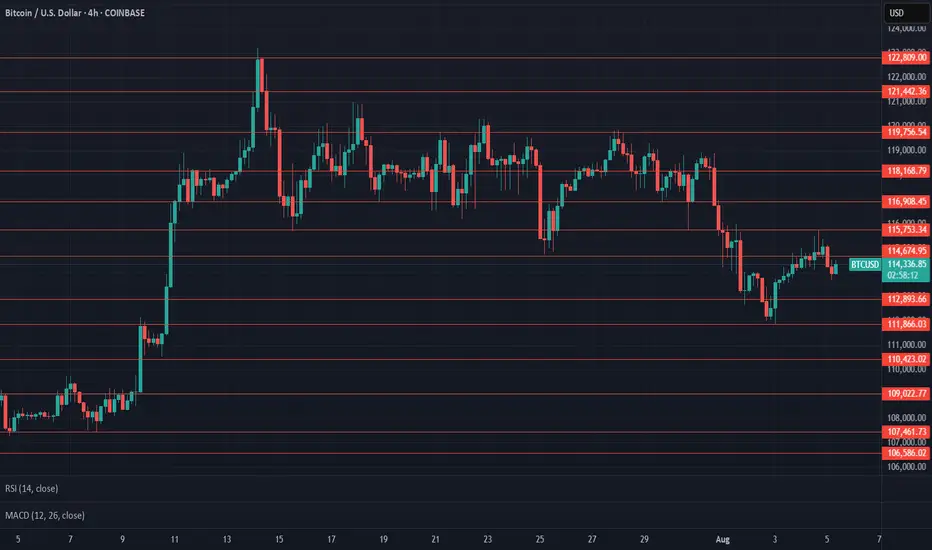
$BTC Update & ResistancesCRYPTOCAP:BTC resisted at $115,753, struggling below $114,674 support followed by Bearish engulfing on 4h, last weekly closed with bearish engulfing, RSI on 1D dropping, Weak volume, $111,866 key support from here, current support at $112,893 untested, $119,756 key resistance to break for ATH test at $123K, Next possible resistances will be $127,161, $129,594, $134,033, $140,499-$141,080, & $145,448.
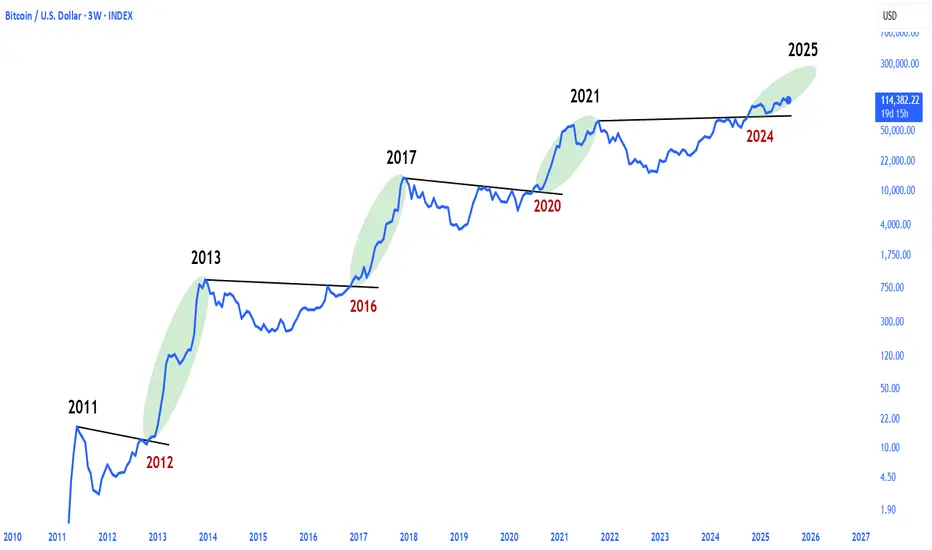
ETHEREUM SEASON LOADING!Ethereum appears to be literally following bitcoin's pattern ahead of its 2021 bull run
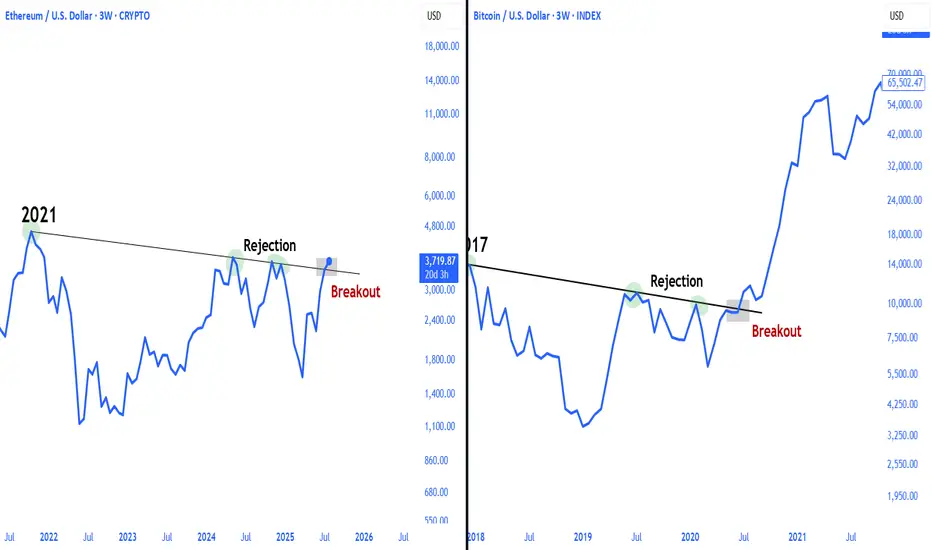
BITCOIN RUN IS NOT OVER!bitcoin historically ends its run in Q4, the year after the year in which the major downtrend breakout occurs
Will MNT/USDT 5x to 10x Potential Post BreakoutTSX:MNT Forming Bullish Structure – 5x to 10x Potential Post Breakout
#MNT is currently trading very close to a major resistance level at $0.82.
We’re waiting for a clean breakout above this zone. Once confirmed, price can potentially deliver a 5x–10x move in the coming days.
If price retraces, the best long-term entry zone would be around $0.70–$0.60 — right inside the accumulation box.
This bull run has strong structural support around $0.55–$0.50. As long as we stay above this zone, we remain highly confident in the upside move toward $5.
Key levels to watch:
Accumulation Zone: $0.60 – $0.70
Resistance: $0.82
Support: $0.50 – $0.55
Bull Run Targets: $1.42 / $3 / $5
NFA & DYOR

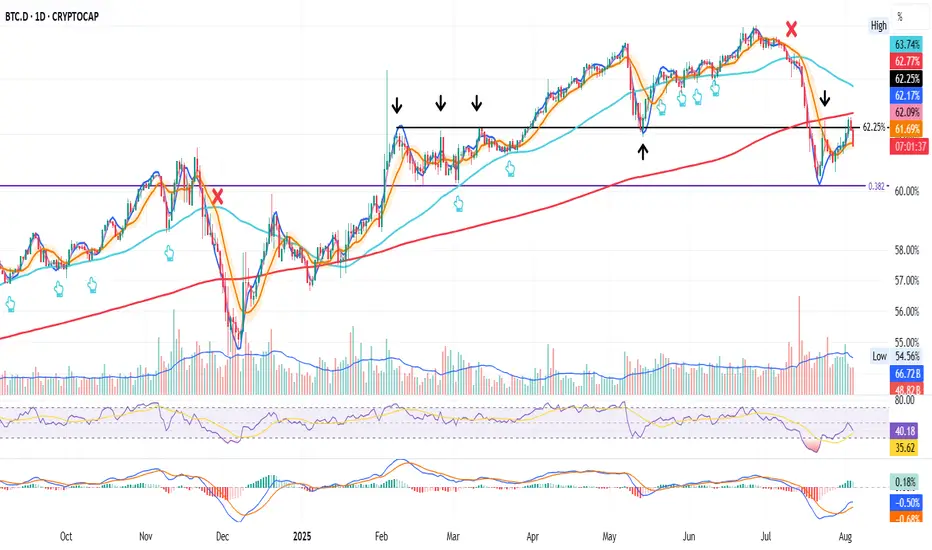
BTC.DChart Overview (1D TF – BTC Dominance):
1. Pattern in Play: Rising Wedge (Bearish Bias)
The chart shows a rising wedge pattern forming with:
Support line (PA (D)s) in blue, sloping upwards.
Resistance line (PA (D)r) in red, also sloping up, but less steep.
This pattern typically has a bearish outcome, especially when formed during a downtrend as we see post-June.
Price is nearing the apex of the wedge, meaning a breakout (likely down) could be imminent.
2. Key Horizontal Support and Resistance Levels
Support at 60.27%: Price previously bounced from this level—very significant zone.
Resistance at 61.89%: Acting as a key ceiling; price got rejected here recently.
66.03% (Top Black Line): Major macro resistance and the 2025 peak trendline intersects near that level around October.
3. Trendlines and Long-Term Context
Macro Uptrend Support in red intersects around the 61.89%–62% zone in early October. If dominance holds this zone and bounces upward from the rising wedge, this trendline becomes crucial support.
Previous Uptrend Line (purple) was broken significantly in June, which triggered the sharp drop. BTC dominance lost momentum and is now in recovery/decision zone.
Interpretation:
Short-Term Bias: Neutral to Bearish
As price is within a rising wedge post-downtrend, the probability of breakdown is higher.
Failure to break above 61.89% again and maintain momentum suggests downside towards 60.27% or even 58.60%.
Medium-Term Possibility:
If price breaks down from the wedge, support zones are:
60.27%
Then 58.60%
If price breaks up, it will need to reclaim 61.89% cleanly, then test toward 64%–66%.
Macro Trendline Intersection (~Oct 13): Could be a major decision point aligning with fundamental crypto market catalysts. Dominance could break sharply above or below that time depending on broader crypto cycles.

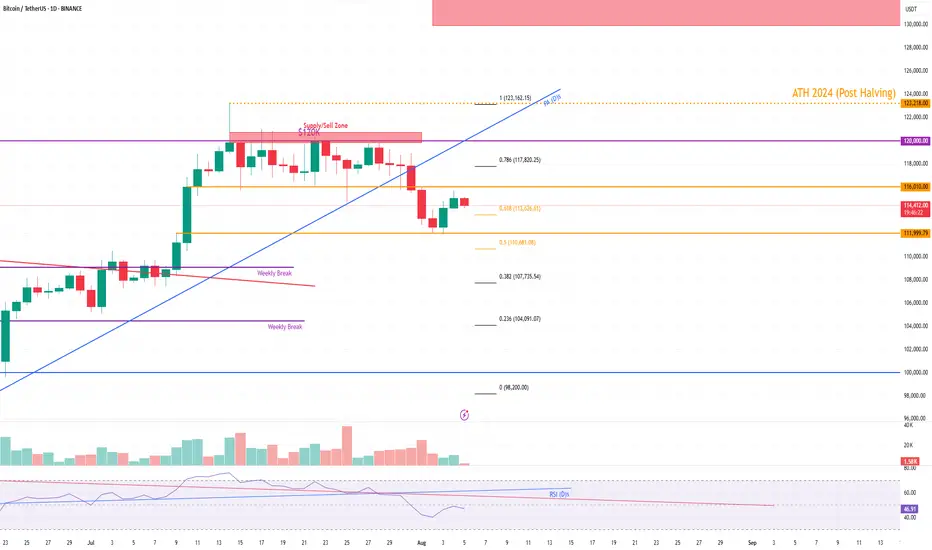
BTC PA📊 Price Action Analysis
Rejection at Major Supply Zone ($120K)
Price reached a strong supply/sell zone between $120K and $123K, marked in red.
$120,000: Psychological round number — major supply area.
Price got rejected after multiple days of consolidation under this level.
Support, Resistance Levels and Trendlines
$116,010: Horizontal S/R — acted as temporary support, now resistance.
$111,999.79: Key horizontal support.
Blue PA (D)s trendline has been broken bearishly — indicating a change in short-term market structure.
Momentum is currently in a pullback/retracement phase after strong rally from late June to mid-July.
Volume Analysis
Volume is declining during the pullback — typical of retracements and not full-blown reversals.
No major volume spike indicating panic selling.
Fibonacci Retracement Analysis (Recent Swing High to Swing Low)
Key levels:
0.786: $117,820.25 — Rejected here.
0.618: $113,626.61 — Currently testing this level, price slightly above.
0.5: $110,681.08 — Next support if rejection at 0.618 persists.
0.382: $107,735.54
0.236: $104,091.07
0%: $98,200.00 — Full retracement base.
Price is showing hesitation at the 0.618, which is a crucial level in Fibonacci theory. A break and hold below this could accelerate the drop toward $110.6K and beyond.
RSI Analysis (Daily)
RSI is around 46.46 — moving below midline (50), showing weakening momentum.
Bearish divergence confirmed: price made a higher high while RSI made a lower high → bearish reversal signal.
Bullish if:
BTC reclaims $116K, closes above $120K — invalidates rejection.
RSI bounces from current level with volume support.
Bearish Bias:
Currently, structure broke down.
Testing 0.618 Fib level; failure here likely brings price to: $110,681
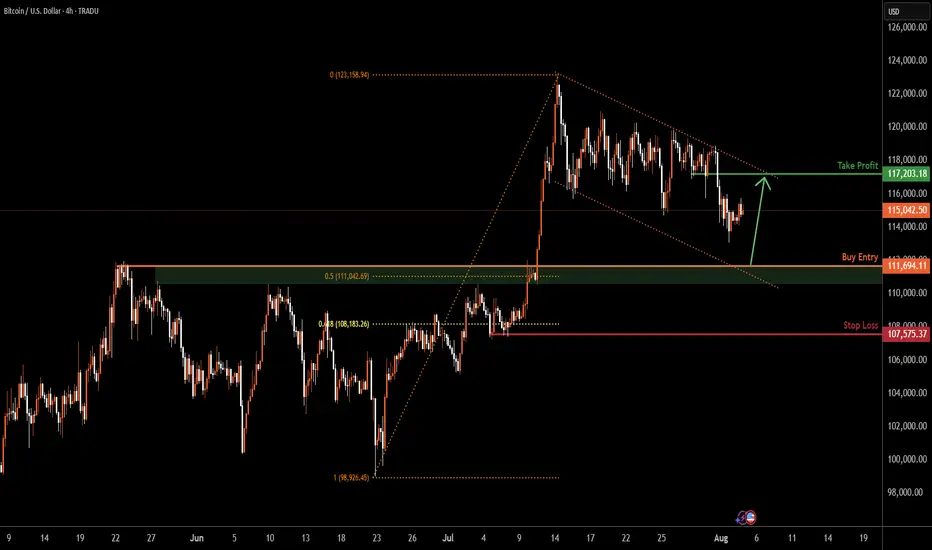
BITCOIN H4 | Bullish bounce offBTC/USD is falling towards the buy entry, which is a pullback support that is slightly above the 50% Fibonacci retracement and could bounce from this level to our take profit.
Buy entry is at 111,694.11, which is a pullback support that is slightly above the 50% Fibonacci retracement.
Stop loss is at 107,575.37, which is a pullback support that is slightly below the 61.8% Fibonacci retracement.
Take profit is at 117,203.18, which is a pullback resistance.
High Risk Investment Warning
Trading Forex/CFDs on margin carries a high level of risk and may not be suitable for all investors. Leverage can work against you.
Stratos Markets Limited (tradu.com ):
CFDs are complex instruments and come with a high risk of losing money rapidly due to leverage. 65% of retail investor accounts lose money when trading CFDs with this provider. You should consider whether you understand how CFDs work and whether you can afford to take the high risk of losing your money.
Stratos Europe Ltd (tradu.com ):
CFDs are complex instruments and come with a high risk of losing money rapidly due to leverage. 66% of retail investor accounts lose money when trading CFDs with this provider. You should consider whether you understand how CFDs work and whether you can afford to take the high risk of losing your money.
Stratos Global LLC (tradu.com ):
Losses can exceed deposits.
Please be advised that the information presented on TradingView is provided to Tradu (‘Company’, ‘we’) by a third-party provider (‘TFA Global Pte Ltd’). Please be reminded that you are solely responsible for the trading decisions on your account. There is a very high degree of risk involved in trading. Any information and/or content is intended entirely for research, educational and informational purposes only and does not constitute investment or consultation advice or investment strategy. The information is not tailored to the investment needs of any specific person and therefore does not involve a consideration of any of the investment objectives, financial situation or needs of any viewer that may receive it. Kindly also note that past performance is not a reliable indicator of future results. Actual results may differ materially from those anticipated in forward-looking or past performance statements. We assume no liability as to the accuracy or completeness of any of the information and/or content provided herein and the Company cannot be held responsible for any omission, mistake nor for any loss or damage including without limitation to any loss of profit which may arise from reliance on any information supplied by TFA Global Pte Ltd.
The speaker(s) is neither an employee, agent nor representative of Tradu and is therefore acting independently. The opinions given are their own, constitute general market commentary, and do not constitute the opinion or advice of Tradu or any form of personal or investment advice. Tradu neither endorses nor guarantees offerings of third-party speakers, nor is Tradu responsible for the content, veracity or opinions of third-party speakers, presenters or participants.
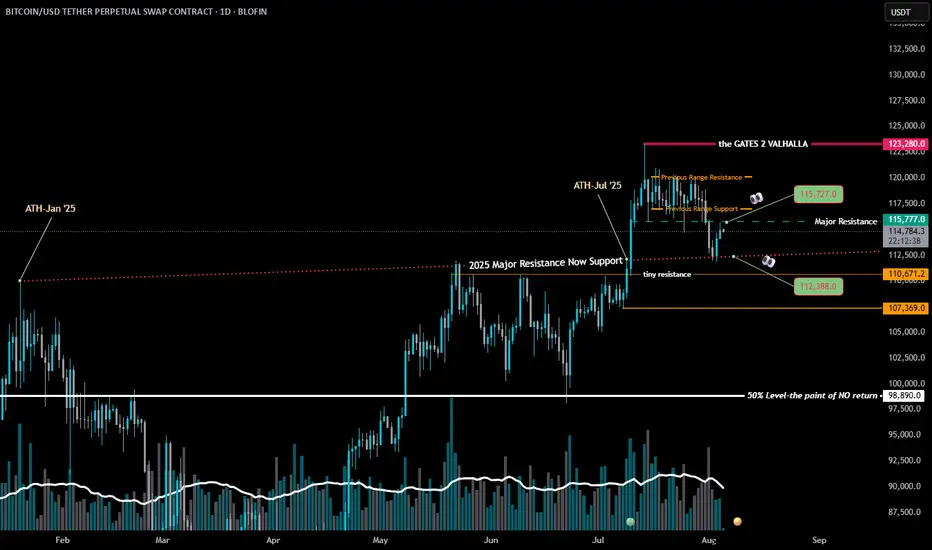
BTC-Stay Sharp. Self RegulateBTC Update
👀All Eyes on These Levels 👇
We’re back in A zone.
The level? 115,727.
This isn’t just any line on the chart — this is the same trendline that flipped from major resistance to support back to resistance on the same date of the infamous #bUCKmOON pump.
📈 If BTC breaks this level with strength and volume — I’m in long.🟢
No volume? No conviction. No entry.
But let’s not get carried away — resistance lurks right above at 117,000 — the former Exhaustion Zone Support now turned resistance.
A classic case of "what once held you up now wants to drag you down."
And if the bulls somehow clear that hurdle?
They'll run headfirst into the Exhaustion Zone Resistance — the real boss fight.
These are stacked walls — one after the other. No easy wins here.
🧠 As a chartist, I’m not here to write about what happens if we break through every ceiling like it’s some fanboy fantasy. That’s not analysis — that’s hopium.
🥂 Yeah yeah but— it’s fun to daydream about all the champagne showers, yacht parties, laser eyes, and the sudden urge to start a DAO that changes the world.
We all picture it.
We all love it.
And sure, when BTC rips through all resistance like butter, we’ll act like we "knew all along."
But anyways — snap back to reality...
There’s another level we can’t ignore:
112,388
👀 Even a 4-hour close below this level?
Just check the chart.
That’s when the bears come storming out of hibernation — angry, hungry, and ready to feast.
🎯Bottom line:
Stay sharp. Self Regulate.
The chart is the map. Discipline is the treasure.
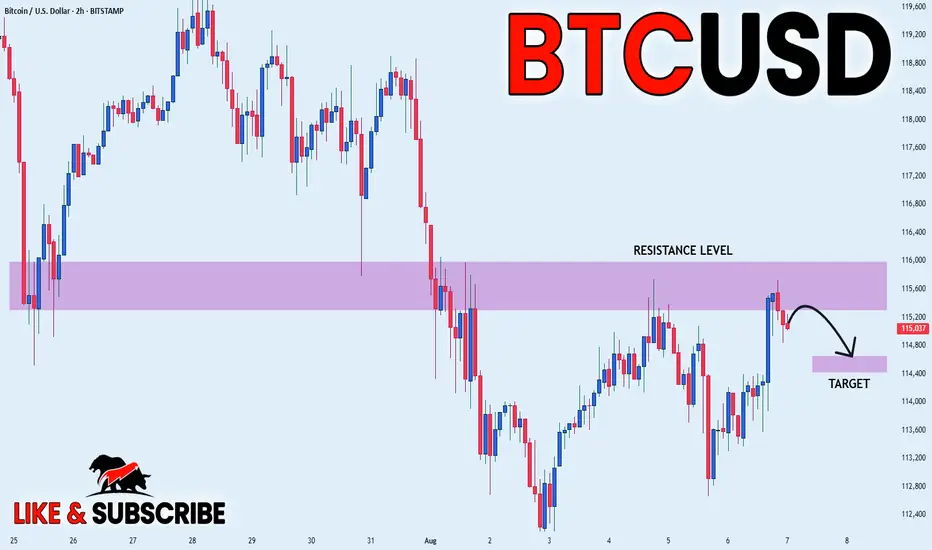
BITCOIN PULLBACK FROM SUPPLY AREA|SHORT|
✅BITCOIN price grew again
To retest the resistance of 116k
But it is a strong key level
So we are seeing a bearish reaction
And we will likely see a
Further bearish move down
SHORT🔥
✅Like and subscribe to never miss a new idea!✅
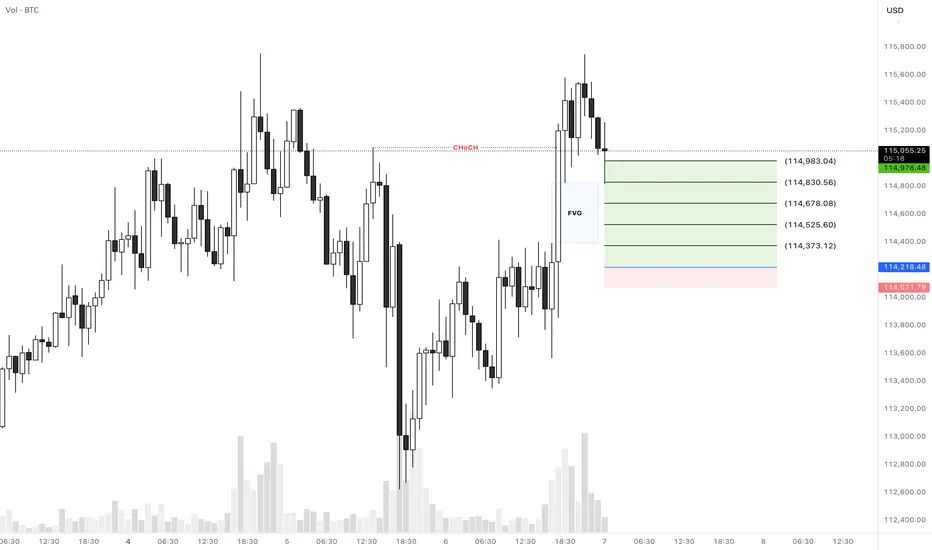
BTCUSD Long SetupHello everyone.
We have a CHoCH in 1H TF that it left a FVG area and it was touched a minute ago...
Let's see how does it reacts to this FVG area and if it didn't push the price up then we can expect our entry is valid...
Another thing that we should consider is that we're in down trend in 4H TF and the price didn't break the previous high for a CHoCH, so this trade would be a little risky so please consider the risk management...
Let's see what happens...
Good luck
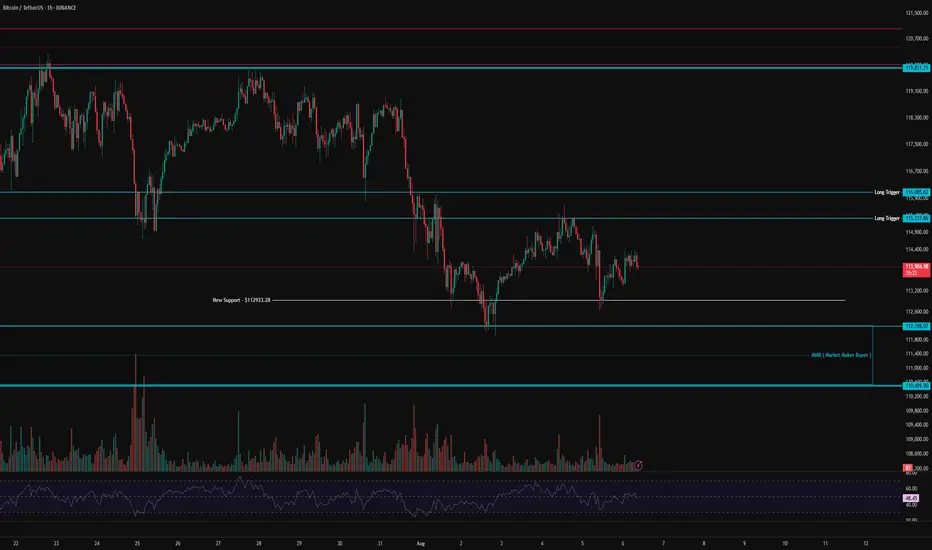
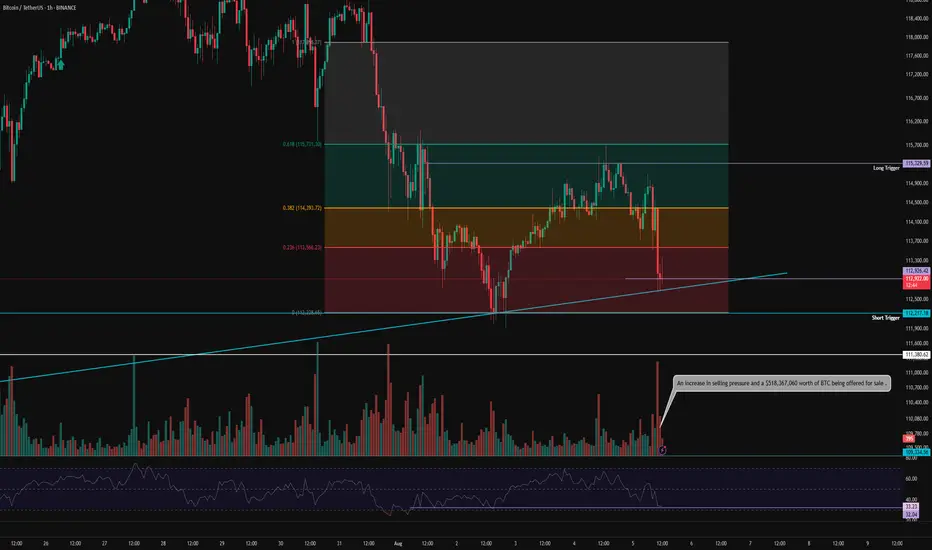
BTC 1H Analysis – Key Triggers Ahead | Day 3💀 Hey , how's it going ? Come over here — Satoshi got something for you !
⏰ We’re analyzing BTC on the 1-hour timeframe .
⏱ We’re analyzing Bitcoin on the 1-hour timeframe.
👀 After bouncing from the current $113,000 area, Bitcoin moved upward, indicating the presence of market maker buyers in this zone. A short-term support has formed at $113,000, and yesterday we saw a strong rejection from this level, which helped prevent further selling pressure.
Bitcoin now faces a resistance zone and a potential long entry trigger between $115,317 and $116,085. If long positions increase and short positions get squeezed, this resistance could be broken, potentially fueling a bullish move.
⚙️ On the RSI, our key level is the 50 range. A confirmed hold above this level could signal a higher low forming relative to the previous bottom at $112,933.
🕯 We’re seeing an increase in trading volume, and as the price moves closer to $110,499, there's a noticeable liquidity pull from long positions—more buyers are stepping in around this area.
📈 Our long position trigger lies within the resistance zone mentioned. A confirmed breakout and hold above this level, alongside RSI entering Overbought across multiple timeframes and volume expansion, would give us a solid entry for a long position.
📉 Our short position trigger is below $112,200. A sharp drop with strong selling pressure and RSI entering Oversold would justify a short entry—though I do not recommend taking this trade.
❤️ Disclaimer : This analysis is purely based on my personal opinion and I only trade if the stated triggers are activated .
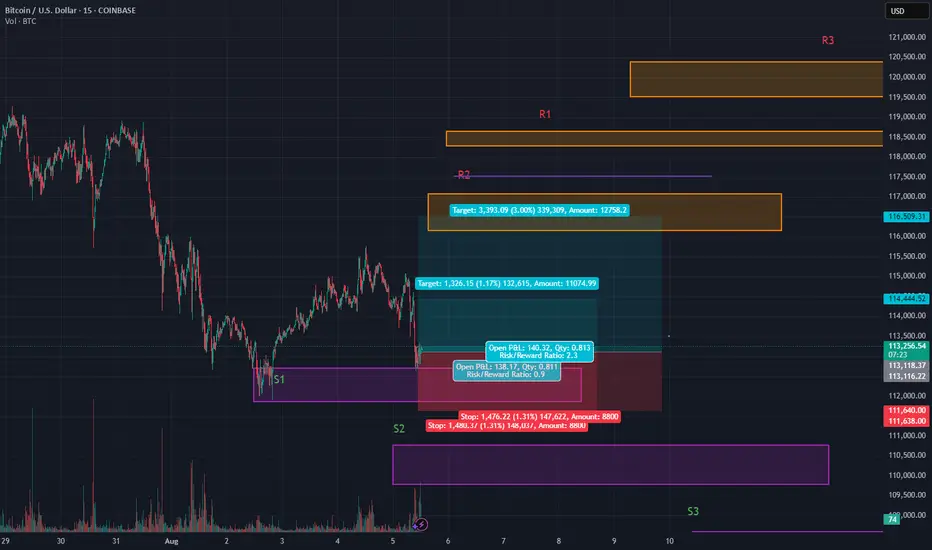
BTC Bleeding, Scalpel Please💣 Price just nuked back to our OG S1 zone and buyers are throwing hands at $113k 🥊
This is a quick scalp play while the dust settles
🎯 Entry: 113,159
🛡 Stop: 113,111 (just below S2's base. you can tighten this up, to the base if desired.)
📈 Scalp Target 1: 114,444
🚀 (Swing Trade) Target 2: 116,588
🧠 Setup: Reclaim after wick trap
📐 Structure: Bullish continuation off demand
📍 Zone: Micro-range base + sweep low trap
Scalpel sharp ✂️
Clean. Tight. Ruthless.
⚠️ Heads up — 30m still trending down
So lock those stops and stay nimble 🔪
⚠️If $113k fails, watch for a flush to S2 or even S3.
This bounce is a scalp — not a trend shift (yet) 🚨
BTC 1H Analysis – Key Triggers Ahead | Day 2💀 Hey , how's it going ? Come over here — Satoshi got something for you !
⏰ We’re analyzing BTC on the 1-hour timeframe .
👀 After the strengthening of the US dollar , Bitcoin experienced a drop and formed a short-term support bottom around the $113,000 level . It is currently completing a pullback to the levels of this recent decline .
🎮 Our Fibonacci retracement is drawn from the breakout zone to the $112,200 bottom . Bitcoin broke below the 0.236 level and then found support . The best potential entry trigger, based on Fibonacci, is at the 0.382 level, or around $115,000 . If Bitcoin breaks above this level , it could form a higher high and a higher low in this timeframe .
⚙️ The RSI is showing a support level around 32 , which is currently preventing Bitcoin from entering the oversold zone . However , if this support is lost , Bitcoin could move into oversold territory .
📈 Our long position trigger is at the 0.382 Fibonacci level . A confirmed breakout of this level , combined with RSI overbuying and increased volume , would be our entry signal .
📉 Our short position trigger is around $113,000 . If this support breaks , we may open a short position . However, the main short trigger is at the 0 Fibonacci level ( support at $112,200 ) . If selling pressure increases and RSI enters the oversold zone , we will consider entering a short position with confirmation .
❤️ Disclaimer : This analysis is purely based on my personal opinion and I only trade if the stated triggers are activated .
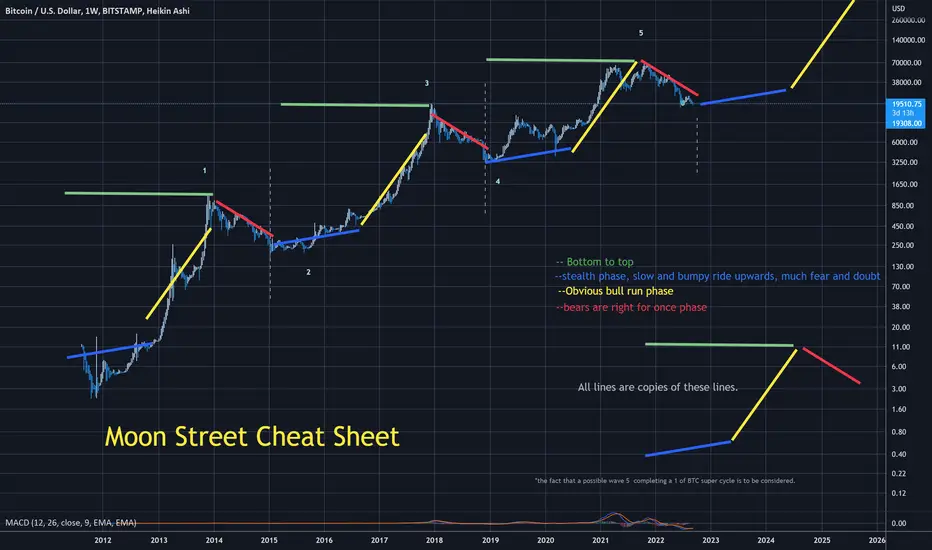
Moon Street Cheat Sheet
All same color lines are idendical to eachother ( copies )
3 times since BTC's beginning, they have been pretty accurate with both time and angle ( on log chart )
is 4th time the charm , or was it the 3rd ?
We shall see
BITCOIN CRASH PREDICTED! HERE’S WHAT HAPPENS NEXT! (scary)Yello Paradisers, Bitcoin crashed exactly as we predicted in the previous videos that it will happen with the highest probability.
In this video I am explaining to you what's gonna happen next.
Head and shoulders, neckline, is be breaking to the downside, we need a clear confirmation of a reclaim Our channel on high timeframe is getting breakout to the downside and confirmation was that a reclaim was already successful.
In this video I'm sharing with you Elliott Way theory on low timeframe and what needs to be done for confirmation perspective in order for us to continue to go to the downside or have a reversal to the upside.
Don't be a gambler. Don't try to get rich quick. Make sure that your trading is professionally based on proper strategies and trade tactics.

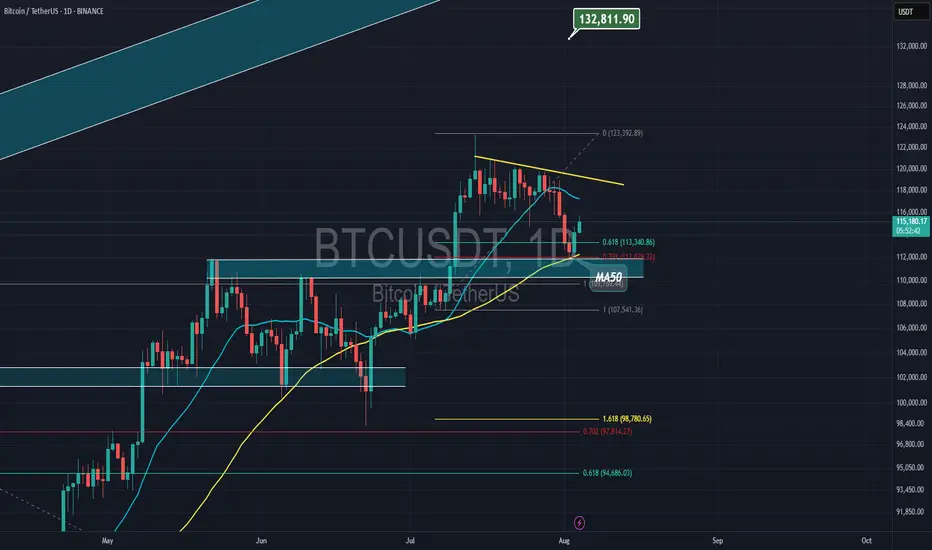
Bitcoin & strong supportBitcoin is holding above 50MA and 61% of Fibonacci, it also has bullish divergence on RSI with bullish engulfing candle. upside movement is coming soon
BTC.D on the Daily – Key Rejection in Play
BTC Dominance pushed into the 200MA on August 2nd.
On August 3rd, it got rejected and closed below the 62.25% key resistance.
Today, August 4th, that same level is acting as resistance again.
If today's candle closes below the BB center (orange),
we could see another move back to the bottom of the range
with the 0.382 Fib near 60% as the next key level to watch.
Momentum is fading at resistance.
Structure favors a deeper retest.
We’ll be here to watch it unfold.
Always take profits and manage risk.
Interaction is welcome.