TradeCityPro | Bitcoin Daily Analysis #140👋 Welcome to TradeCity Pro!
Let’s dive into the Bitcoin analysis. Yesterday, the interest rate decision by the US Federal Reserve was announced, and once again, just like the past few months, it remained unchanged. Let’s see what impact it had on Bitcoin.
⏳ 4-Hour Timeframe
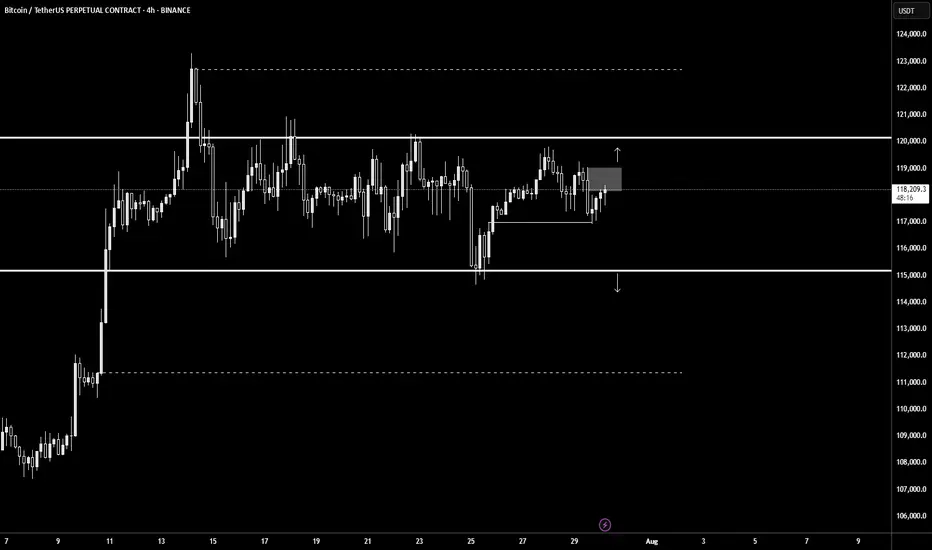
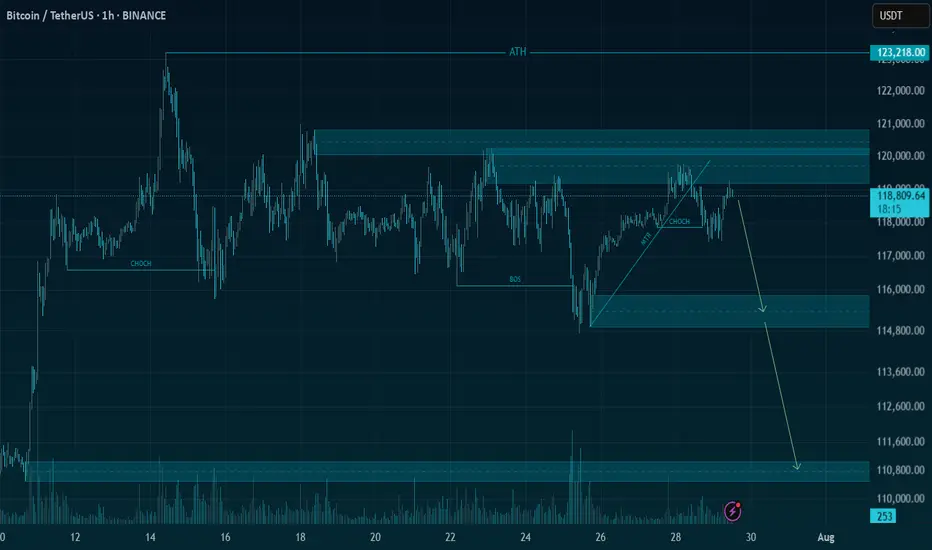
In the 4-hour timeframe, after the announcement of the unchanged interest rate and Powell’s speech, Bitcoin printed a red candle on the support zone and even wicked lower, but then recovered and the price returned back into the box.
✔️ Basically, we can say that this month’s rate decision had no real impact on the market, and Bitcoin is still moving inside its range box. The fact that the support zone wasn’t lost is a positive sign for the continuation of the trend.
⭐ But the important point is this: if the uptrend is going to continue, the price must print a higher high or at least a level equal to 120041, and in my opinion, if for any reason a lower high gets printed, the chances of breaking below 116829 significantly increase.
📊 I currently have no new position on Bitcoin, and all my entries are below 110000. But if 120041 breaks, I’ll open a long position for the next bullish wave that Bitcoin might start.
💥 A major trigger for starting a new leg is the 61.67 level on the RSI. As long as RSI remains below this level, there’s no bullish momentum in the market — and considering that the number of touches to 116829 has increased, the probability of a correction is also rising.
❌ Disclaimer ❌
Trading futures is highly risky and dangerous. If you're not an expert, these triggers may not be suitable for you. You should first learn risk and capital management. You can also use the educational content from this channel.
Finally, these triggers reflect my personal opinions on price action, and the market may move completely against this analysis. So, do your own research before opening any position.
J-BTC
Bitcoin & The Altcoins —Name Your AltcoinBitcoin is sideways right now and is moving in a very tight and narrow range. All the action has been happening between $117,000 and $120,000 based on candle close since 11-July. This is bullish, think about it.
Bitcoin hits a new all-time high and next thing you know it turns sideways very close to resistance. The only drop was short-lived and everything sold was quickly bought. Why is Bitcoin consolidating so close to resistance? It is preparing to move ahead.
What happens when Bitcoin moves forward after so much recovery? Everything experiences a positive cycle. This is a very strong signal.
This chart allows for more whipsaw as you know nothing else is possible in a trading range. We predict the pattern to resolve bullish, but there can be swings to either side. A swing down just as it happened 25-July. A swing up just as it happened 14-July. This is always possible but the end result won't change. Bitcoin will continue sideways but when the sideways period is over, you will not see a move toward $110,000 or $100,000. The break of the trading range will confirm the advance toward $135,000 next month. Bitcoin is likely to continue in the same mode. While Bitcoin consolidates the new advance, the altcoins grow. In this way the entire market continues to recover and grow month after month after month.
Name Your Altcoin
Leave a comment with your favorite altcoin trading pair and I will do an analysis for you. I will reply in the comments section. Make sure to include any questions you might have beforehand.
If you see a comment with a pair you like, boost and reply so these can be done first.
Thanks a lot for your continued support.
Namaste.
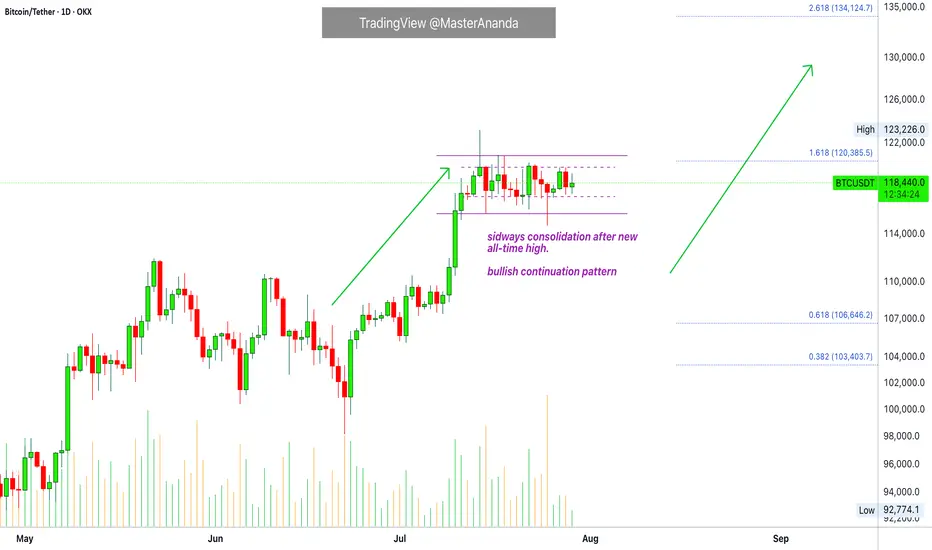
Chart Patterns - How to read them like a ProChart patterns are visual formations on price charts that help traders anticipate potential market movements.
These patterns fall into three main categories: bullish , bearish , and indecisive .
---
1. Bullish Chart Patterns
Bullish patterns often signal that price is likely to move upward.
1.1 Bull Flag
* What it looks like: A sharp upward move followed by a small downward-sloping rectangle (the flag).
* Meaning: After a strong rally, the price consolidates briefly before continuing higher.
* Key insight: A breakout above the flag typically signals a continuation of the trend.
1.2 Pennant (Bullish)
* What it looks like: A strong upward move followed by a small symmetrical triangle.
* Meaning: Similar to the bull flag, but the consolidation takes a triangular form.
* Key insight: Once price breaks above the pennant, the uptrend often resumes.
1.3 Cup & Handle
* What it looks like: A “U”-shaped curve (the cup) followed by a small downward drift (the handle).
* Meaning: This pattern suggests a period of accumulation before price breaks higher.
* Key insight: A breakout above the handle signals the beginning of a new bullish leg.
1.4 Inverse Head & Shoulders
* What it looks like: Three low points, with the middle low being the deepest.
* Meaning: This reversal pattern appears after a downtrend and signals a potential change to an uptrend.
* Key insight: A breakout above the “neckline” confirms the reversal.
---
2. Indecisive Chart Patterns
These patterns show market hesitation, where neither bulls nor bears are clearly in control.
2.1 Consolidation Channel
* What it looks like: Price moves within a horizontal channel.
* Meaning: Market is moving sideways with no strong trend.
* Key insight: A breakout in either direction often leads to a significant move.
2.2 Symmetrical Triangle
* What it looks like: Two converging trend lines forming a triangle.
* Meaning: This is a neutral pattern that can break out in either direction.
* Key insight: Traders wait for a breakout before taking a position.
---
3. Bearish Chart Patterns
Bearish patterns signal a high probability of downward price movement.
3.1 Bear Flag
* What it looks like: A sharp decline followed by a small upward-sloping rectangle.
* Meaning: After a strong drop, price consolidates before continuing lower.
* Key insight: A breakout below the flag suggests a continuation of the downtrend.
3.2 Pennant (Bearish)
* What it looks like: A sharp downward move followed by a small symmetrical triangle.
* Meaning: Similar to the bear flag, but the consolidation takes a triangular form.
* Key insight: A breakout downward typically resumes the bearish trend.
3.3 Inverse Cup & Handle
* What it looks like: An upside-down cup with a small upward drift forming the handle.
* Meaning: Indicates weakness after an uptrend, often followed by a drop.
* Key insight: A break below the handle usually signals a strong bearish move.
3.4 Head & Shoulders
* What it looks like: Three peaks, with the middle one being the highest.
* Meaning: A classic reversal pattern that indicates a potential shift from an uptrend to a downtrend.
* Key insight: A break below the “neckline” confirms the bearish reversal.
---
How to Use These Patterns
* Combine pattern recognition with support/resistance, volume, and indicators for stronger confirmation.
* Always wait for breakouts and avoid acting too early.
* Manage risk with stop-loss orders.

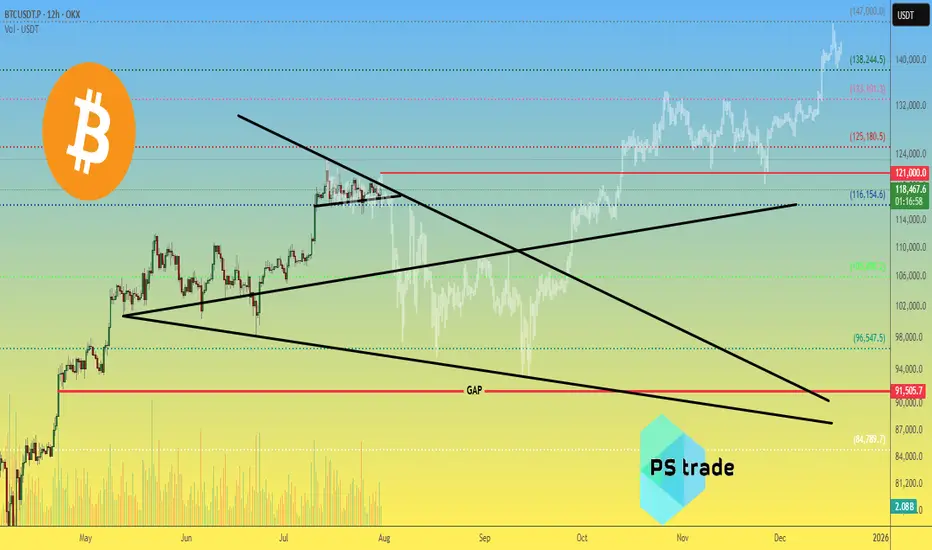
Bitcoin BTC price analysis by the end of 2025🕯 July is coming to an end, with 3 weeks of OKX:BTCUSDT consolidation between $117k–121k.
Tomorrow begins the last month of summer — and it promises to be "hot" as, according to our earlier published calendar Trump's administration plans to send letters with new, increased tariffs to "all countries" on 01.08.
💰 Also, take a look at Bitcoin Monthly Returns. In our view, 2025 resembles 2020 the most.
What do you think?
👉 According to this dynamic, the real "hot" may come not in summer, but late autumn.
💰 We've also tried to find a price fractal for #BTCUSD that fits the current structure — and for now, it looks plausible:
◆ In the coming days, CRYPTOCAP:BTC should not rise above $121k.
◆ A low of correction might hit mid-September around $93k.
◆ A cycle top for #BTC could arrive to the end of 2025, near $147k.
📄 Now that you've seen our version — share your forecasts on future #BTCUSDC price action in the comments 👇
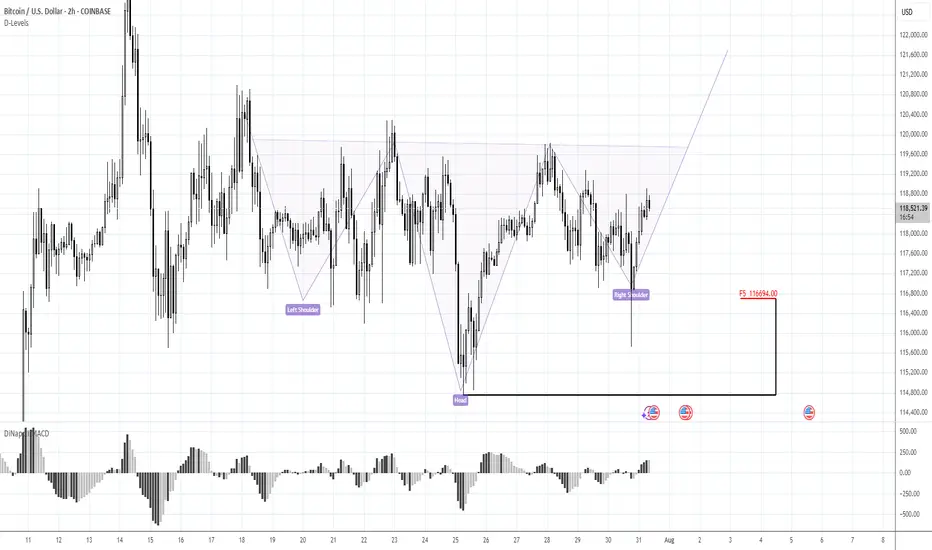
Keep following to the H&S PatternMorning folks,
To be honest, not too many things to talk about. We've prepared our scenario with H&S is still valid. Reaction to GDP numbers was quite welcome as it set the right arm's bottom. The only thing that we have to be busy with is to control its validity - reaching of the neckline and price standing above 116 lows and right arm.
At the first signs that market is start falling back - do not take any new longs. H&S failure is also the pattern and in this case we get deeper correction. But daily chart still makes me think that bullish context is here
BITCOIN & 134KAfter Bitcoin rallied on July 8 and consolidated for two weeks, this bull flag remains valid, targeting $134,000.

XRPUSDT → Range formation. Retest of resistanceBINANCE:XRPUSDT.P , after a false breakout of the daily resistance level of 3.352 and the elimination of traders, has entered a correction phase. The trading range shown below has been formed, with an emphasis on resistance...
XRP previously formed a false breakout of the daily resistance level of 3.352, as indicated in the idea above. After changing its market character, the price entered a correction phase. Focus on the range of 3.00 - 3.264. A retest of resistance (zone of interest and liquidity) is possible before falling to 3.161, 3.05 or to the liquidity zone of 3.00. There are no technical or fundamental reasons for exiting the consolidation; most likely, a retest of the zone of interest may end in manipulation and a pullback to support...
Resistance levels: 3.1609, 3.264, 3.352
Support levels: 3.05, 3.00
I do not rule out the fact that a retest of the 3.264 resistance level may have a breakout structure and the price will continue to rise, but based on the price behavior pattern on D1, the market structure, and market stagnation, I conclude that at the moment, the chances of seeing a correction from resistance are higher. Further developments will need to be considered after the retest of key zones on the chart...
Best regards, R. Linda!

#BTC Update #12 – July 31, 2025#BTC Update #12 – July 31, 2025
Bitcoin is currently at the upper boundary of the channel it has been following. It may experience a pullback from this upper boundary. This pullback is estimated to reach the $116,800 level. If it wants to go lower, it could drop as far as the $114,500 level.
There is a significant amount of liquidity between $121,000 and $117,000. Bitcoin may also try to sweep this area. However, despite 4 or 5 attempts, it still hasn’t managed to break above the upper resistance zone. Therefore, a pullback should always be taken into account.
Overall, Bitcoin is still in a correction within a correction. That means no impulsive move has occurred yet. It’s not at a suitable point for either long or short positions. You may choose to trade within this range, but keep in mind that it's quite risky.
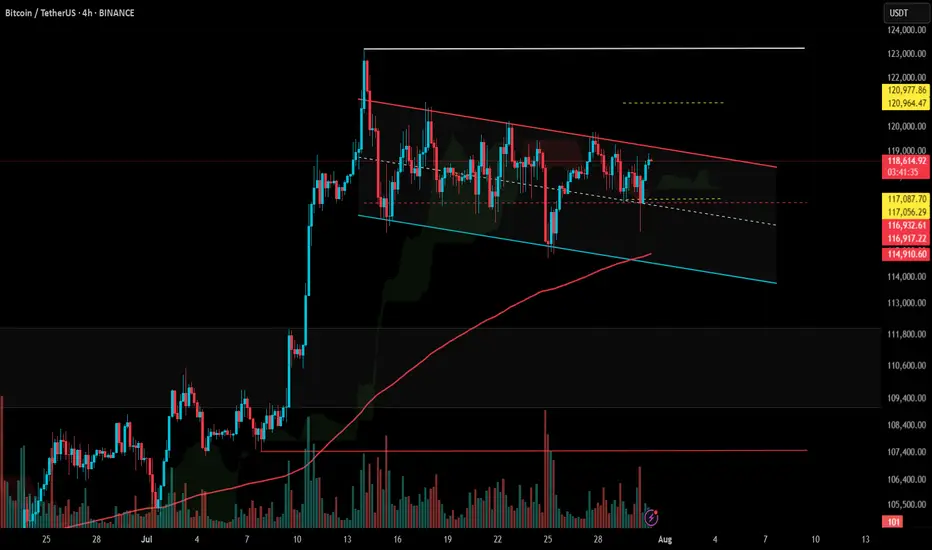
BTCUSD – Descending Channel or Bullish Flag?BINANCE:BTCUSDT – Market Maker’s Game Inside a Descending Channel
Timeframe: 2H | MJTrading View
Market Structure Overview:
Bitcoin recently printed a new ATH at $122,000 after a parabolic run from the previous ATH at $111,937.
Since then, price has been consolidating inside a descending channel, which could act as a bullish flag in higher timeframes.
Liquidity pools are clearly formed:
Above $122K – resting stops of late shorts.
Below $115K–$114K – weak long stops and untapped demand near the Order Block (OB).
Key Levels & Liquidity Zones:
Upside:
$122K Liquidity Pool → If swept, could trigger momentum towards $124K–$125K.
Downside:
$116K OB → First defensive zone for bulls.
$112K Strong Support → Aligns with previous ATH breakout base.
Market Maker’s Dilemma:
If you were a market maker… which liquidity pool would you hunt first?
Price is coiling tighter within the channel, and both scenarios are possible:
Upside Sweep → Rapid breakout above $122K to clear shorts, then potential continuation.
Downside Sweep → Sharp drop into $116K–$112K liquidity, flushing longs before any recovery.
⚡ MJTrading Insight:
This is the classic market maker compression – first sweep likely determines direction.
Patience here is key; let the liquidity tell the story.
#BTCUSD #Bitcoin #Liquidity #SmartMoney #PriceAction #MJTrading #ChartDesigner #CryptoAnalysis
Psychology Always Matters:

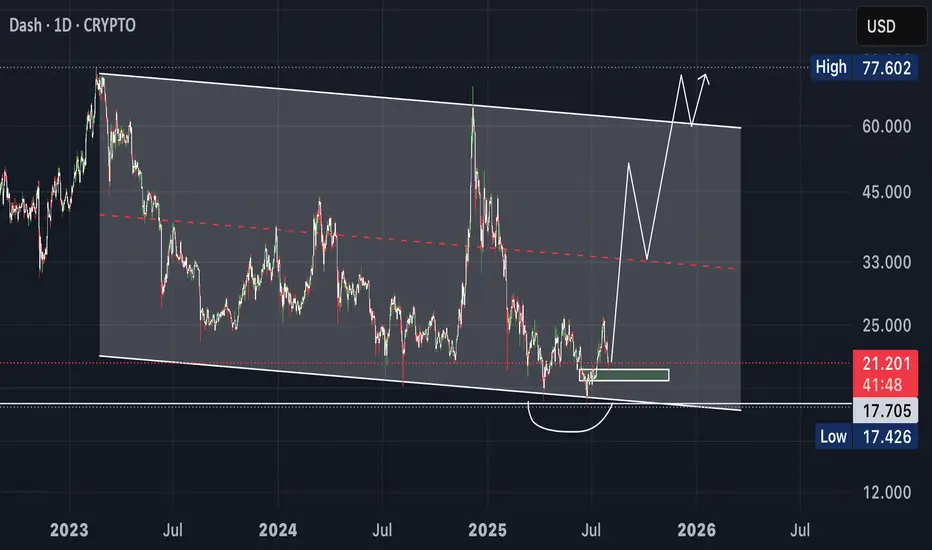
Dash RocketDash has been in a bearish trend for some time now, but it has stood the test of time being one of the OG coins of the market with this double bottom within this descending channel on the daily and a retest of demand I believe this coin will see $50 soon.
It’s master node runners and minors have kept the chain going, and we should be breaking its bearishness very soon.
Important Volatility Period: August 2nd - 5th
Hello, fellow traders!
Follow us for quick updates.
Have a great day!
-------------------------------------
(BTCUSDT 1M Chart)
Let's take a moment to check the trend before the new month begins.
There have been two major declines so far, and a third major decline is expected next year.
For the reason, please refer to the "3-Year Bull Market, 1-Year Bear Market Pattern" section below.
-
My target point for 2025 is around the Fibonacci ratio of 2.618 (133889.92).
However, if the price surges further, it could touch the Fibonacci range of 3 (151018.77) to 3.14 (157296.36).
If it rises above 133K, it's expected that prices will never fall below 43823.59 again.
Since the HA-Low indicator hasn't yet been created on the 1M chart, we need to monitor whether it appears when a downtrend begins.
Based on the current trend, the HA-Low indicator is expected to form around 73499.86.
More details will likely be available once the movement begins.
-
The basic trading strategy involves buying in the DOM(-60) ~ HA-Low range and selling in the HA-High ~ DOM(60) range.
However, if the price rises above the HA-High ~ DOM(60) range, a step-up trend is likely, while if the price falls below the DOM(-60) ~ HA-Low range, a step-down trend is likely.
Therefore, the basic trading strategy should be a segmented trading approach.
The further away from the HA-High indicator, the more likely it is that the DOM(60) indicator will act as a strong resistance when it forms.
Therefore, if the current price and the HA-High indicator are trading far apart, and the DOM(60) indicator forms, it is expected to face significant resistance.
-
Looking at the current trend formation, the high trend line is drawn correctly, but the low trend line is not.
This is because the StochRSI indicator failed to enter the oversold zone.
Therefore, the low trend line is marked with a dotted line, not a solid line.
Therefore, what we should pay attention to is the high trend line.
We need to see if the uptrend can continue along the high trend line.
-
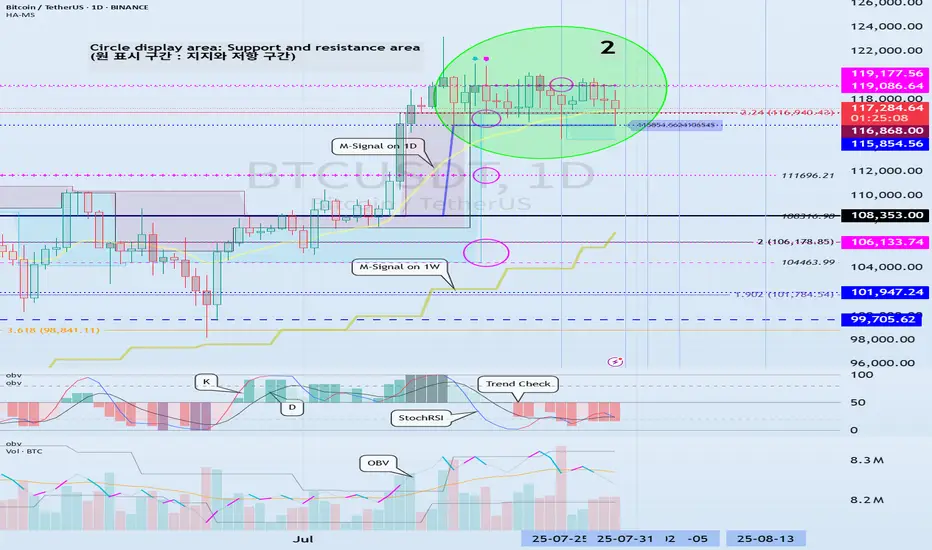
(1D chart)
If we use the trend lines drawn on the 1M, 1W, and 1D charts to predict periods of volatility, the periods around August 5th and August 13th are significant periods of volatility.
By breaking this down further, the volatility periods are around July 31st, August 2nd-5th, and August 13th.
Therefore, trading strategies should be developed based on the assumption that the volatility period extends from July 30th to August 14th.
The current price is moving sideways in the 115,854.56-119,177.56 range.
This range, the HA-High ~ DOM (60), is a crucial area to consider for support.
This will determine whether the price will continue its upward trend by rising above 119,177.56, or whether it will turn downward by falling below 115,854.56.
If the price falls below 115854.56, it is expected to meet the M-Signal indicator on the 1W chart and reestablish the trend.
The HA-High indicator on the 1W chart is forming at 99705.62, and the DOM (60) indicator on the 1W chart is forming at 119086.64.
Therefore, when the price declines, it is important to check where the HA-High indicator on the 1W chart forms and determine whether there is support near that point.
-
The On-Board Value (OBV) indicator within the Low Line ~ High Line channel is showing a downward trend.
If the OBV falls below the Low Line, the price is expected to plummet.
Therefore, it is necessary to closely monitor the movements of the OBV indicator.
The Trend Check indicator is a comprehensive evaluation of the StochRSI, PVT-MACD Oscillator, and On-Board Value (OBV) indicator.
The TC (Trend Check) indicator interprets a rise from the 0 point as a buying trend, while a decline indicates a selling trend.
In other words, a rise from the 0 point is likely to indicate an uptrend, while a decline is likely to indicate a downtrend.
Currently, the TC (Trend Check) indicator is below the 0 point, suggesting a high probability of a downtrend.
However, if the TC (Trend Check) indicator touches a high or low, the trend may reverse.
In other words, touching a high increases the likelihood of a reversal from an uptrend to a downtrend, while touching a low increases the likelihood of a reversal from a downtrend to an uptrend.
When such movements occur, it's important to consider the support and resistance levels formed around the price level to determine a response.
In other words, consider the support and resistance levels formed at the current price level.
As a significant period of volatility approaches, prepare to transition from box trading to trend trading.
-
Thank you for reading to the end.
I wish you successful trading.
--------------------------------------------------
- Here's an explanation of the big picture.
(3-year bull market, 1-year bear market pattern)
I'll explain more in detail when the bear market begins.
------------------------------------------------------
BTCUSDT | Bitcoin needs liquidity to be able to go up more🚀 Trade Setup Details:
🕯 #BTC/USDT 🔽 Sell | Short 🔽
⌛️ TimeFrame: 1H
--------------------
🛡 Risk Management:
🛡 If Your Account Balance: $1000
🛡 If Your Loss-Limit: 1%
🛡 Then Your Signal Margin: $1204.82
--------------------
☄️ En1: 118829.28 (Amount: $120.48)
☄️ En2: 119162.54 (Amount: $421.69)
☄️ En3: 119400.34 (Amount: $542.17)
☄️ En4: 119638.61 (Amount: $120.48)
--------------------
☄️ If All Entries Are Activated, Then:
☄️ Average.En: 119283.83 ($1204.82)
--------------------
☑️ TP1: 118025.43 (+1.05%) (RR:1.27)
☑️ TP2: 117427.5 (+1.56%) (RR:1.88)
☑️ TP3: 116671.89 (+2.19%) (RR:2.64)
☑️ TP4: 115717.73 (+2.99%) (RR:3.6)
☑️ TP5: 114673.35 (+3.87%) (RR:4.66)
--------------------
❌ SL: 120276.34 (-0.83%) (-$10)
--------------------
💯 Maximum.Lev: 66X
⌛️ Trading Type: Swing Trading
‼️ Signal Risk: ⚠️ High-Risk! ⚠️
🔎 Technical Analysis Breakdown:
This technical analysis is based on Price Action, Elliott waves, SMC (Smart Money Concepts), and ICT (Inner Circle Trader) concepts. All entry points, Target Points, and Stop Losses are calculated using professional mathematical formulas. As a result, you can have an optimal trade setup based on great risk management.
⚠️ Disclaimer:
Trading involves significant risk, and past performance does not guarantee future results. This analysis is for informational purposes only and should not be considered financial advice. Always conduct your research and trade responsibly.
💡 Stay Updated:
Like this technical analysis? Follow me for more in-depth insights, technical setups, and market updates. Let's trade smarter together!
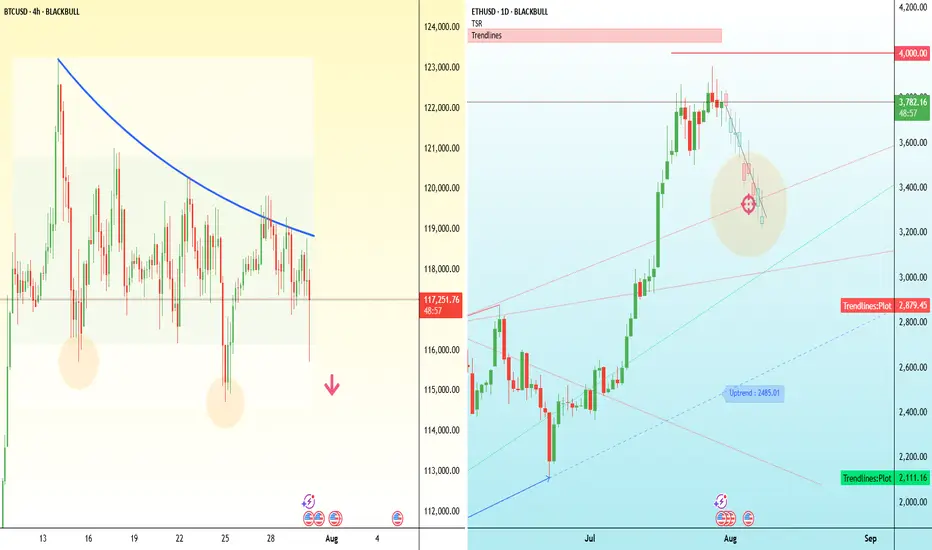
Major test for crypto bulls - BTC and ETH Bitcoin has dipped below $118,000, putting pressure on the bullish structure that’s held for the past two weeks.
The attempted breakout above $121,000 has failed, and price is now breaking down through the middle of the consolidation range, threatening short-term higher lows. On the 4H chart, this move resembles a failed breakout with a potential double-top near $121,000.
If Bitcoin can’t reclaim $116,000 quickly, the next downside levels to watch are $114,000 and $110,000.
Ethereum, meanwhile, has stalled just below $3,800 after a strong rally this month. Price action has flattened out over the past few days, with several failed attempts to push through that level. The key upside trigger remains $4,000.
But if $3,700 gives way, ETH may slide back to the $3,450–$3,300 region, where previous resistance and the rising trendline converge.
BITCOIN → Correction within a downward channel. 112K or 125K?BINANCE:BTCUSDT is consolidating. However, a local downward trading range is forming relative to the current setup. What is the probability of a correction continuing to 112K or growth to 125K?
Daily structure: a local correctional channel within a global bullish trend. We have cascading resistance at 119.2, 119.6, 120, and 120.8. It will be quite difficult to break through this zone on the first attempt, but MM can use it to form traps and collect liquidity.
At the bottom, everything is simpler — a breakdown of the local bullish structure, the formation of an intermediate minimum, below which there is a void down to 112K.
Yesterday, relative to 115-116K, mm staged a massacre (trap) on both sides of the market.
Liquidity collection, return to the range, and growth. The reaction to the false breakdown of support is quite strong. Since the opening of the session, Bitcoin has been heading towards resistance, but there may not be enough potential to break through the upper resistance conglomerate, so I expect to see a pullback or decline to 116-115-114.
Resistance levels: 119.2, 120.1, 120.85
Support levels: 116.37, 115.67, 112
Technically and fundamentally, I do not see any drivers that could support the market (I am talking about Bitcoin, since the driver for altcoins is the decline in Bitcoin's dominance). It is possible that this may appear later. In the current situation, I am considering a false breakout and correction, as the market has not yet finished consolidating or correcting, and the current downward trading range may be extended.
PS: As the price moves towards resistance, it is necessary to monitor the reaction. The market itself will show what it is preparing for...
Best regards, R. Linda!

BTCUSD Market Breakdown – Liquidity Sweep Incoming?BTCUSD Market Breakdown – Liquidity Sweep Incoming?
🔍 Technical Analysis (July 29, 2025)
Chart Observations:
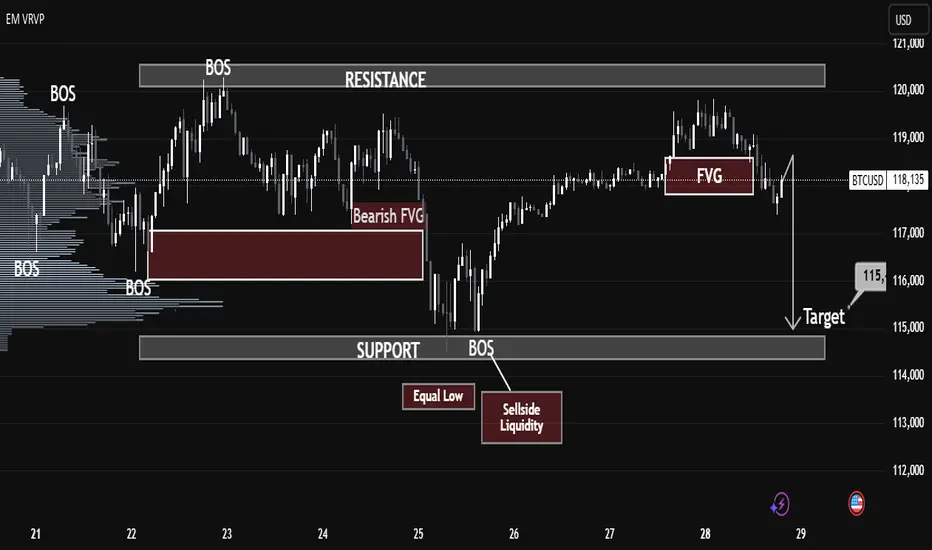
1. BOS (Break of Structure):
Multiple BOS events are identified, confirming key directional shifts in market structure. The last BOS near the support zone signals bearish intent.
2. Bearish Fair Value Gap (FVG):
A clean bearish FVG is left behind after a sharp drop on the 25th, indicating institutional imbalance and potential retracement area. Price rejected from that FVG later.
3. Equal Low & Sellside Liquidity:
The highlighted equal lows around July 25-26 mark areas of resting liquidity—prime targets for smart money manipulation.
4. New FVG Formed (July 28):
Another bearish FVG appears just before the projected breakdown, strengthening the case for a bearish continuation.
5. Support Zone Target – $115K:
A clean support zone (marked between 114,500–115,500) sits directly below the current market price. This is the likely liquidity target after sweeping equal lows.
6. Volume Profile (VRVP):
Low-volume nodes between the current price and support suggest minimal resistance to a sharp downward move.
⸻
🎯 Conclusion:
The structure, FVGs, and liquidity pools all point toward a liquidity raid below the equal lows, aiming for the support target near $115K. Traders should watch for a decisive break below the current range, especially if the FVG acts as resistance again.
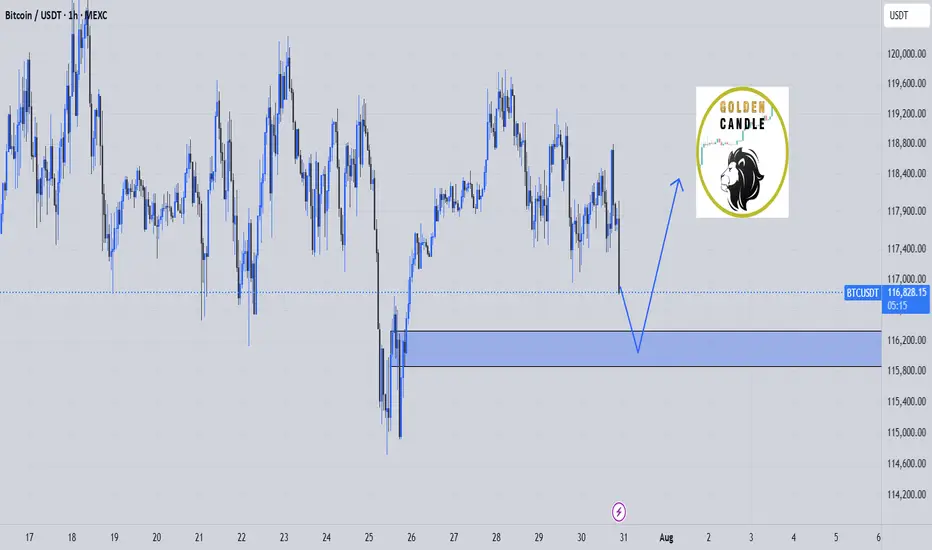
btc buy midterm"🌟 Welcome to Golden Candle! 🌟
We're a team of 📈 passionate traders 📉 who love sharing our 🔍 technical analysis insights 🔎 with the TradingView community. 🌎
Our goal is to provide 💡 valuable perspectives 💡 on market trends and patterns, but 🚫 please note that our analyses are not intended as buy or sell recommendations. 🚫
Instead, they reflect our own 💭 personal attitudes and thoughts. 💭
Follow along and 📚 learn 📚 from our analyses! 📊💡"
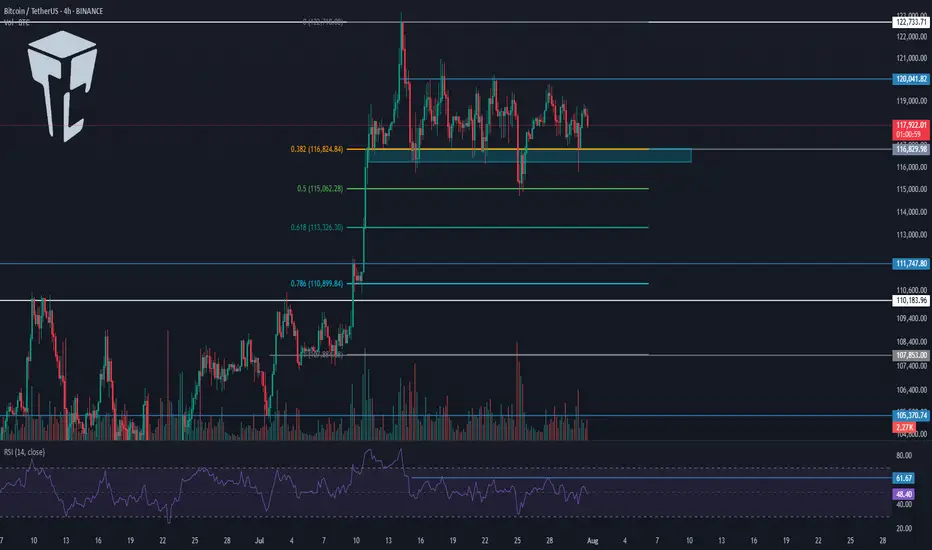
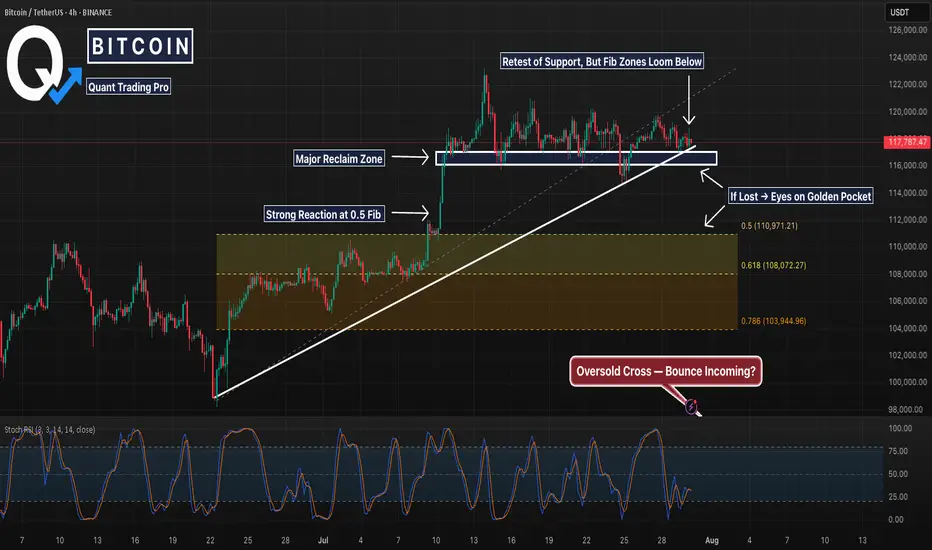
BTC 4H – Retest Holding, But Golden Pocket BelowBitcoin’s 4H chart is at a key decision point. After a strong breakout in early July, price has been consolidating just above the prior resistance zone — now acting as support. This white box represents a major reclaim level that has held multiple times, but buyers are starting to look fatigued.
Below this support lies a clean Fibonacci retracement zone:
0.5 at 110,971
0.618 (Golden Pocket) at 108,072
0.786 deeper pullback at 103,945
The structure remains intact for now, but a loss of the current level could trigger a deeper sweep into one of these fib levels — especially with momentum (Stoch RSI) resetting from oversold.
A potential bounce here keeps the uptrend alive. However, if the zone breaks, the .618 area may be the magnet.
📊 Watching for:
Strong reaction or absorption at this support
Bullish divergence forming
Sweep into golden pocket followed by reversal structure
This setup blends price action, key S/R levels, and Fib confluence — a great chart for anticipating the next move, not reacting to the last one.
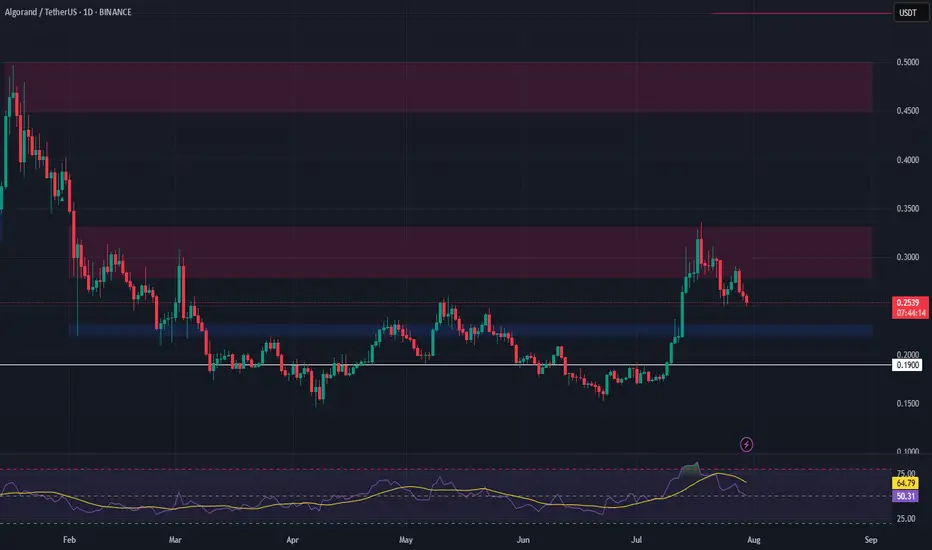
ALGO Swing Trade – Waiting for Pullback to Key SupportAfter a 100%+ surge, ALGO is now retracing and approaching a critical support zone. A dip into this area could offer a strong entry for the next leg higher.
📌 Trade Setup:
• Entry Zone: $0.22 – $0.23
• Take Profit Targets:
o 🥇 $0.28 – $0.33
o 🥈 $0.45 – $0.50
• Stop Loss: Just below $0.19
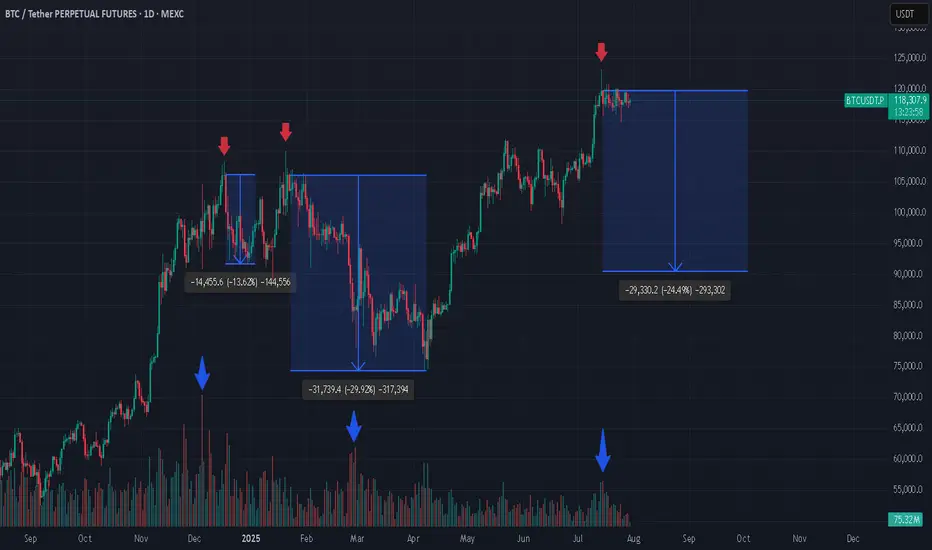
3 Bitcoin Tops, Weak Green Candles, and What’s Next? If you're closely monitoring the Bitcoin (BTC) market, patterns often begin to reveal themselves in surprising ways. In the attached chart, I’ve highlighted three major local tops that Bitcoin has made, each marked by a weak green daily candle. What’s even more striking is what comes next: a dramatic increase in trading volume, followed by steep corrections.
Spotting the Pattern: Weak Green, Heavy Volume
At each pointed top (see red arrows), BTC formed an all-time high (ATH) with a relatively weak green candle, hardly the sign of euphoric buying strength.
Look closely at the volume bars below (blue arrows). Each time, as price struggled to push higher, volume surged after the top, often a signal of major sellers stepping in or longs closing en masse.
What followed? Significant corrections: -13.6%, -29.2%, and, now it might be shaping up for another potential drop (-24.1%) if history rhymes.
Why Does This Matter?
From a technical analysis perspective, volume is the fuel behind price moves. When a new high is reached with limp buying (weak green candles) but is swiftly met with rising volume on the way down, it’s a classic sign of distribution, a strong hand selling into retail euphoria.
Is Another Drop Coming?
Given the consistency in behavior, it’s not unreasonable to ask: are we about to witness another similar correction now that BTC has again hit a top with a weak green candle and volume is ticking up? The historical evidence certainly makes it plausible.
Long-Term Perspective: Still Bullish
Despite these corrections, my long-term outlook remains bullish. Every cycle has corrections, they’re opportunities for healthy consolidation, allowing strong hands to accumulate and the market to reset for its next leg higher.
*not investment advice
#crypto #btc #bitcoin #finance #trading
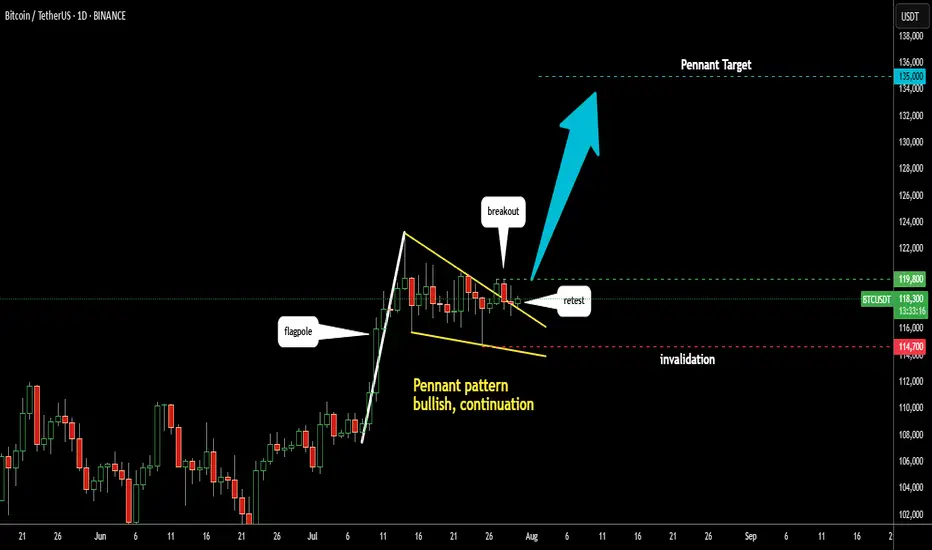
Bitcoin: Pennant - Bullish Continuation PatternI spotted a bullish continuation pattern called Pennant in Bitcoin chart
Support and resistance are marked with yellow trendlines
There is also a Flag Pole (white trendline)
The model is clean as we already see a bullish breakup and a textbook pullback
to the broken resistance.
The target is established at the height of the Flag Pole applied to the broken resistance
at $135k.
For final confirmation the price should overcome the top of breakout at $119,800
The invalidation point is located at the bottom of the Pennant at $114,700
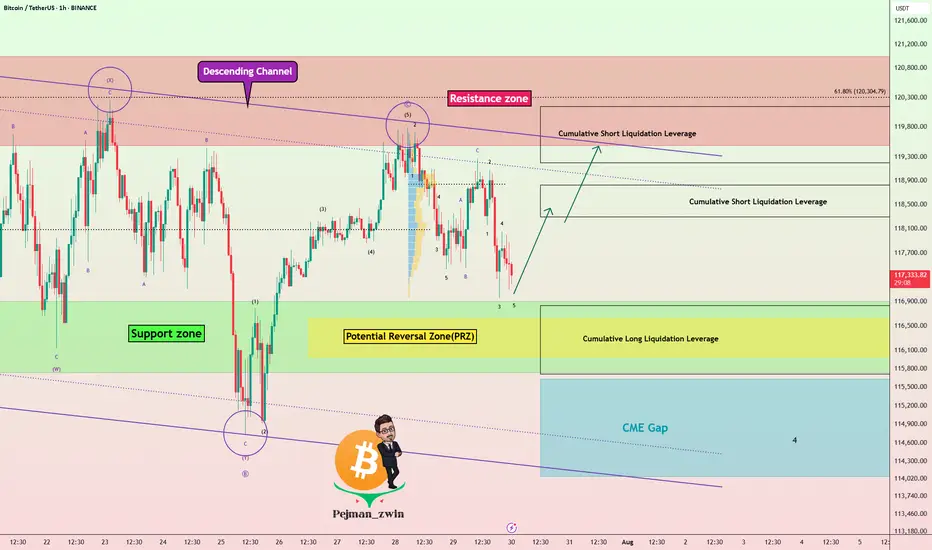
White House Crypto Report Incoming: Will BTC Pump from Support? One of the important news for Bitcoin ( BINANCE:BTCUSDT ) that was released today was that " White House confirms first Bitcoin and crypto report will be released TOMORROW ". Bitcoin is likely to rise with the release of the White House report .
What do you think? At least a temporary pump may be in store for Bitcoin.
Bitcoin fell to the Support zone($116,900-$115,730) and filled the New CME Gap( $119,500-$118,295) as I expected in the previous idea .
Bitcoin is currently moving near the Support zone($116,900-$115,730) , Cumulative Long Liquidation Leverage($116,828-$115,710) and Potential Reversal Zone(PRZ) .
I expect Bitcoin to rise from the Support zone($116,900-$115,730) to at least $118,680(First Taregt) .
Second target: Upper line of the descending channel
Note: Stop Loss: $114,680 = Worst Stop Loss(SL)
CME Gap: $115,060-$114,947
Cumulative Short Liquidation Leverage: $118,827-$118,298
Cumulative Short Liquidation Leverage: $120,144-$119,200
Please respect each other's ideas and express them politely if you agree or disagree.
Bitcoin Analyze (BTCUSDT), 1-hour time frame.
Be sure to follow the updated ideas.
Do not forget to put a Stop loss for your positions (For every position you want to open).
Please follow your strategy and updates; this is just my Idea, and I will gladly see your ideas in this post.
Please do not forget the ✅' like '✅ button 🙏😊 & Share it with your friends; thanks, and Trade safe.
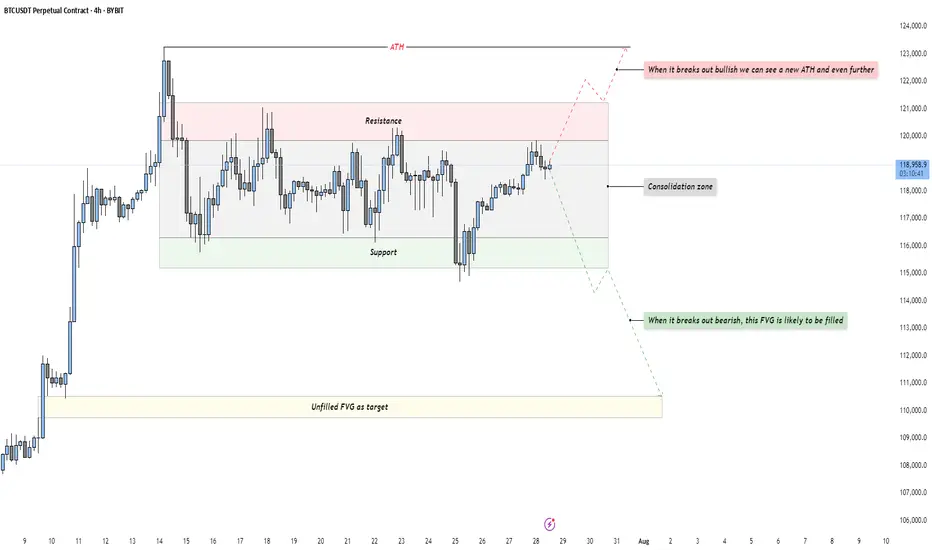
BTC - Bulls vs Bears: who will win?Market Context
Bitcoin is trading in a tight consolidation just below its all-time high after a strong impulsive rally. This phase represents a balance of power between buyers and sellers, with neither side able to take control yet. Such a pause in momentum at this key level often builds pressure for a breakout move as liquidity pools accumulate above and below the range.
Consolidation Phase
The current range is clearly defined by a resistance area at the top and a support area at the bottom. Price has been oscillating within these boundaries without any sustained breakout attempts. This range-bound behavior is an essential part of the market cycle, as it allows larger players to build or distribute positions. The longer price stays in this box, the more significant the breakout that follows tends to be.
Bullish Breakout Scenario
If price breaks out decisively above resistance, it would indicate buyers have absorbed all the supply at these levels. Such a breakout opens the path to a new all-time high and could potentially extend far beyond as trapped shorts are forced to cover. For traders, a retest of the breakout level on lower timeframes could provide a low-risk entry point for continuation to the upside.
Bearish Breakout Scenario
On the flip side, if support fails, the market will likely gravitate toward the unfilled Fair Value Gap left behind during the previous rally. This inefficiency becomes a natural draw for price, offering a logical downside target for a corrective move. A clean break below the range followed by a retest from underneath could present shorting opportunities for those aiming to capture that move into the FVG.
Final Words
Patience and precision are key when dealing with setups like this. Let the market come to your level — and react with intent.
If you found this breakdown helpful, a like is much appreciated! Let me know in the comments what you think or if you’re watching the same zones.
BTCUSDT.PThe best area to buy MARKETSCOM:BITCOIN is $119,000 and wait for the pullback to be complete.
But for selling and shorting, be sure to wait for $115,000 to break down.
⚠️Please control risk managements.