J-DXY
Just a bounce off or a real trend reversal?DXY sits on a major support zone. Price often delivers a reflex bounce at strong levels before continuing the prevailing trend, so a quick pop isn’t proof of a new bull run. DXY is closely linked to US real yields (10y TIPS): if real yields roll over as the Fed eases, USD strength likely fades; if real yields stay firm, a durable reversal is more plausible.
This post is for informational/educational purposes only and is not investment advice or a solicitation to buy/sell any security. Past performance is not indicative of future results. I may hold positions related to the instruments mentioned.

EURUSDHello Traders! 👋
What are your thoughts on EURUSD?
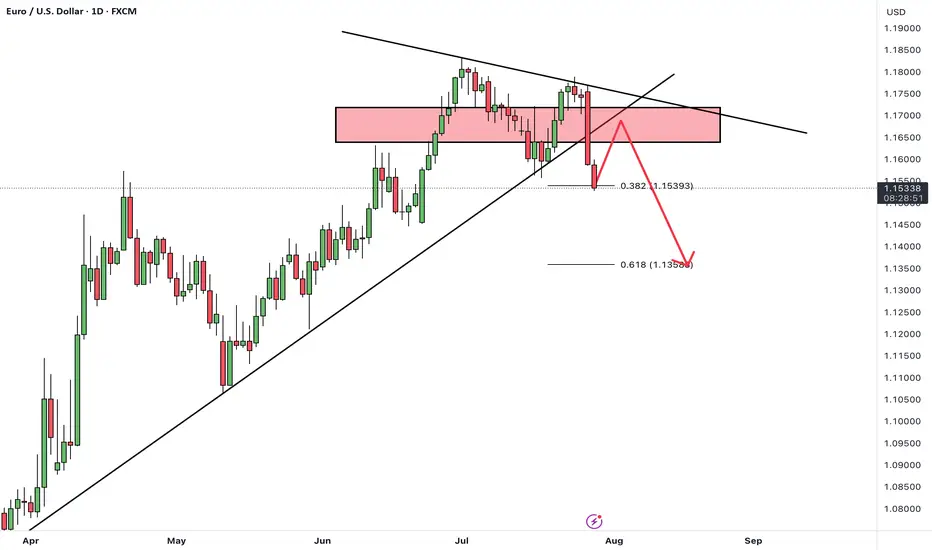
EUR/USD kicked off the week with a sharp drop of nearly 200 pips, driven by renewed concerns over U.S. tariff policies. This strong bearish momentum signals intensified selling pressure across the board.
The pair is now approaching a support zone, which has previously triggered bullish reactions.
However, given the current strong bearish sentiment, there is a real risk this support may not hold.
Our bias remains bearish overall.
If the pair finds temporary support at this level, a short-term corrective bounce is possible.
But ultimately, we expect a continuation of the downtrend toward lower support levels after the correction completes.
Can this support zone stop the bleeding, or is more downside coming? Let us know your thoughts! 👇
Don’t forget to like and share your thoughts in the comments! ❤️
DXY: Bulls Are Winning! Long!
My dear friends,
Today we will analyse DXY together☺️
The in-trend continuation seems likely as the current long-term trend appears to be strong, and price is holding above a key level of 98.471 So a bullish continuation seems plausible, targeting the next high. We should enter on confirmation, and place a stop-loss beyond the recent swing level.
❤️Sending you lots of Love and Hugs❤️

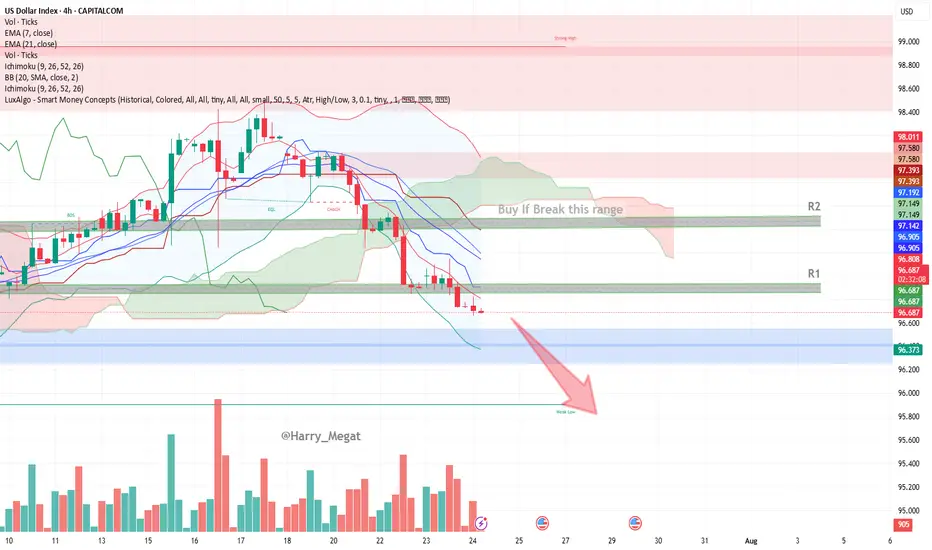
US Dollar Index (DXY) – 4H Chart AnalysisUS Dollar Index (DXY) – 4H Chart Analysis
**Current Trend:** Bearish
Price trades below EMAs, Ichimoku Cloud, and within a bearish channel.
#**Bearish Scenario (Favorable)**
* **Conditions:**
* Price remains below EMA 7 & 21
* Stays under Ichimoku Cloud and 96.812 resistance (R1)
* Lower lows forming, bearish momentum increasing
* **Confirmation:**
Break below **96.37 (blue zone)**
* **Target:**
* TP1: 96.00
* TP2: 95.60 (next weak support)
**Bullish Scenario (Reversal)**
* **Conditions:**
* Price must break above **96.81 (EMA 7 + resistance)**
* Break above **R1 → 96.90**, and then above **R2 → 97.14–97.19**
* Bullish candles close above the Ichimoku cloud
* **Confirmation:**
Break and retest of **97.20**
* **Target:**
* TP1: 97.39
* TP2: 97.58 (key structure)
* TP3: 98.00 (major resistance)
**Bias:** Bearish unless DXY breaks above **97.20** with strong volume and bullish structure.
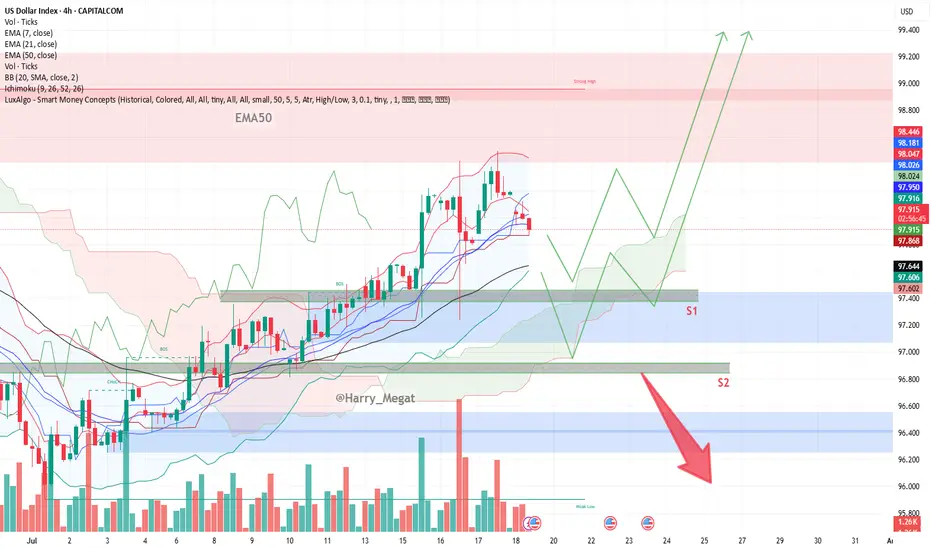
DXY Chart Outlook: Trend, Support, and Price Objectives**DXY Chart Outlook: Trend, Support, and Price Objectives (Reworded Analysis)**
**Trend Overview**
* The DXY chart reflects a **clear upward trajectory**, characterized by a sequence of **ascending highs and higher lows** — a classic sign of bullish momentum.
* Currently, the price is **retracing toward the 50-day EMA**, which appears to be holding as **dynamic support**.
* Two important **horizontal support zones** are marked:
* **Support 1 (S1):** \~97.400 (aligned with EMA-50)
* **Support 2 (S2):** \~96.800 (a deeper correction level)
**Projected Price Zones**
* **Near-Term Objective:** **98.800 to 99.000**
* A rebound from the EMA or S1 could send price higher toward this zone, continuing the current bullish structure.
* **Mid-Term Target:** **99.200 to 99.400**
* If the price successfully clears the 99.000 resistance, further bullish continuation could aim for this intermediate target range.
* **Extended Target:** **100.000+**
* A sustained breakout beyond 99.400 could open the path toward **psychological resistance at 100.000**, possibly higher on strong momentum.
**Support Zones to Watch**
* **S1 (97.400):** This level coincides with the 50-day EMA and represents a **first line of defense**.
* **S2 (96.800):** Should the price fall below S1, this secondary level could provide **stronger support** and potential bounce opportunity.
**Risk Management**
* Consider placing a **protective stop** just below S2 — around **96.500** — to safeguard against a potential trend reversal or deeper correction.
**Summary**
* The DXY remains **technically bullish**, with potential upside targets at **98.800**, **99.400**, and eventually **100.000+**.
* Traders can monitor **S1 and S2** for potential entries or trend confirmation.
* A **breakdown below 96.500** would invalidate the bullish setup and warrant caution.
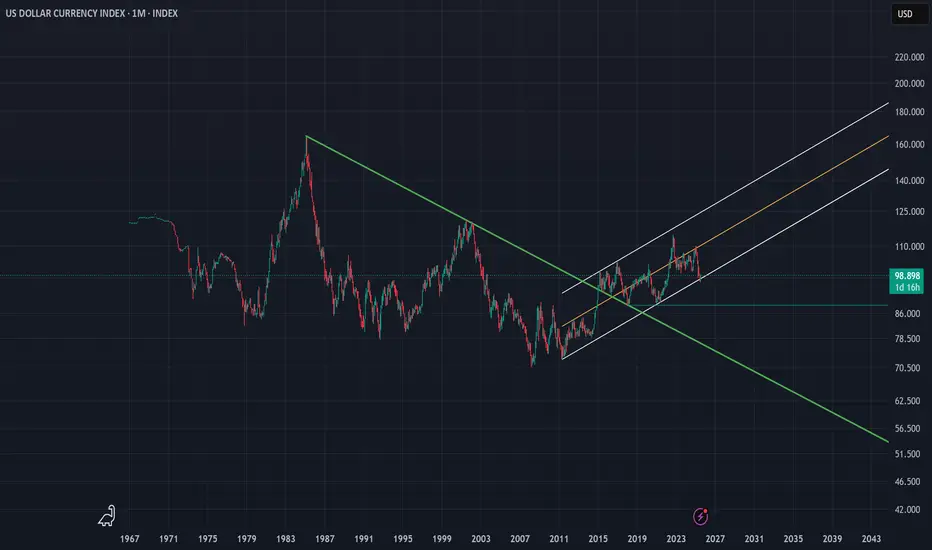
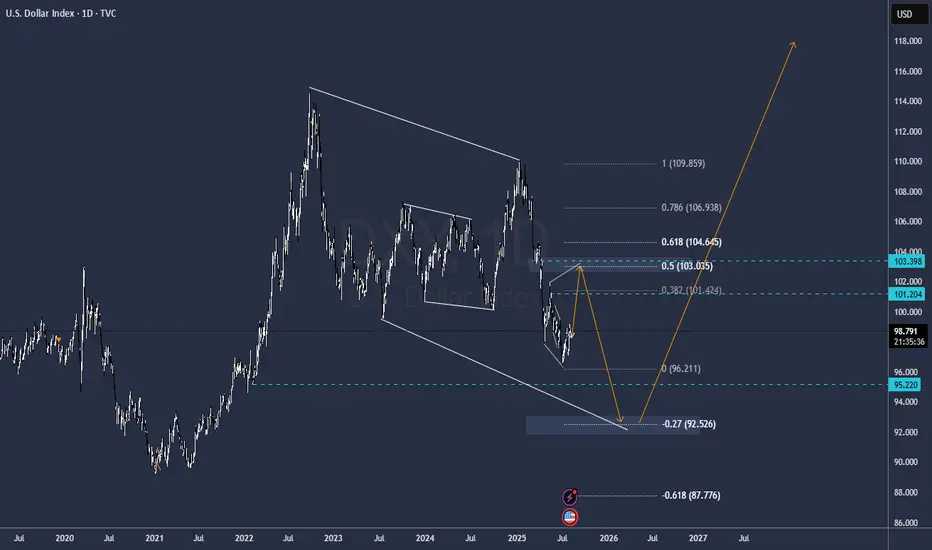
DXY | Timeframe: 1MWith the breakout of the downtrend line drawn since 1985 and its breach in late 2014, the DXY index officially entered a relatively stable upward trend and is currently oscillating within a parallel channel. Although, on the monthly timeframe, it has recently touched the lower boundary of the channel, we can expect at least a rise toward the channel’s midline. However, if the lower support of the channel is broken, a static support around the approximate rate of 88 can be considered a notable support level. Should this support also fail, the long-term downtrend dating back to 1985 would be regarded as the most important support for the DXY index. Meanwhile, moving averages such as the MA50, MA100, and other longer-period moving averages serve as dynamic supports along the way.
It is also worth mentioning that currently reaching the 120 level is considered an ideal target for the DXY index, and ultimately, it is by breaking this resistance zone that the index can reach its “Utopia”.
---------
I will try to continuously update this analysis of the TOTAL symbol according to market changes and developments. Also, I welcome reading your critiques and comments, so don’t forget to leave a comment!
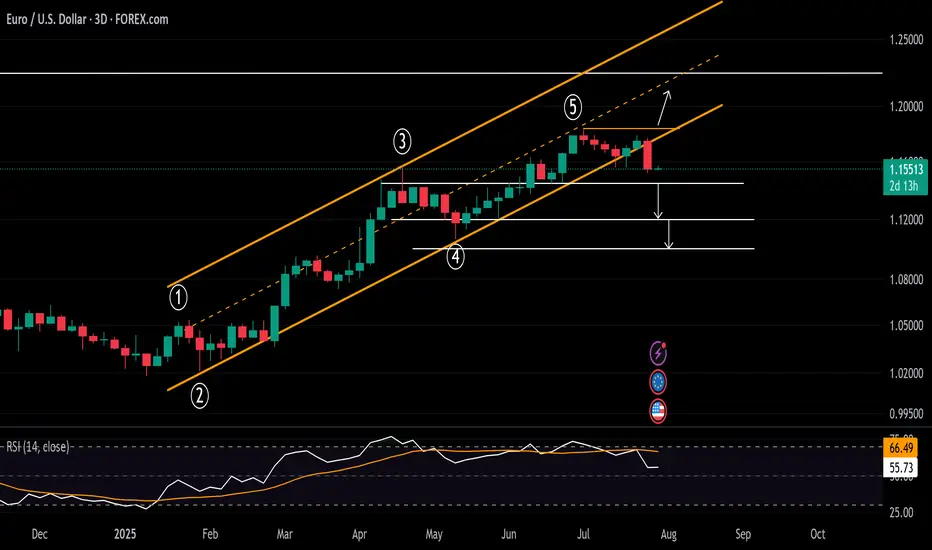
DXY Rebound Pulls EURUSD Below 1.16Following the DXY’s significant rebound off a 17-year trendline, the EURUSD has broken below a trendline that connected all consecutive lows of 2025. This opens the door to further bearish risks, with key support levels now in sight.
If the pair closes cleanly below 1.15, 1.1440 and 1.1380, downside extensions could reach 1.12 and 1.11, respectively.
On the upside, a close back above the 2025 trendline and the 1.18 mark could reinstate bullish momentum, potentially lifting the pair toward the 2021 highs between 1.20 and 1.23.
Written by Razan Hilal, CMT
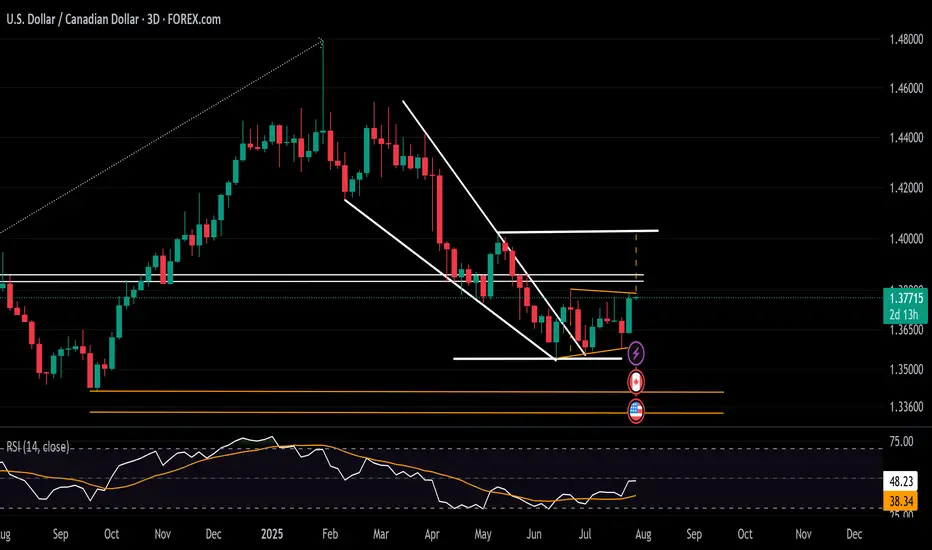
USDCAD Rebound Steadies Ahead of BOC and FOMC MeetingsAligned with the DXY holding above the 96 support and approaching the 100-resistance, the USDCAD is maintaining a rebound above the 1.3540 level.
It has maintained a hold beyond the boundaries of a contracting downtrend across 2025 and is aiming for the 1.38 resistance to confirm a steeper bullish breakout.
A sustained move above 1.38, which connects lower highs from June and July, while the RSI holds below the 50 neutral line, could extend gains toward the 1.40 level.
From the downside, should the breakout above 1.38 fail, the pair may remain trapped within the consolidation range extending from June, with initial support seen at 1.3580.
Written by Razan Hilal, CMT
DXY Surge Pressures Currency Market in Volatile Market WeekThe US Dollar Index (DXY) has held its rebound off historical support zones on both the price chart and the RSI indicator throughout July. The monthly RSI is bouncing off a support line extending between the troughs of 2008 and 2020. Meanwhile, price action is rebounding from a support trendline that connects the lows of 2008, 2014, and 2021, within the 96–94 zone.
Bearish Scenario: A solid close below this support zone may confirm a long-term bearish signal, potentially pushing the index toward the 94 and 90 levels.
Bullish Scenario: A confident move above 100 and 103 could signal a reversal in the currency market, potentially leading the DXY back toward the mid-range of the long-standing channel between 105 and 107, originating from the 2008 lows.
Written by Razan Hilal, CMT

DXY July 30 2025The US dollar remains within the projected trading band, and we expect it to continue fluctuating within this range over the coming month.
Monthly Target: 95.445-101.977
Gold Contract Rolled!Now that the contract rolled We might get a bit more movement. Yesterday was nothing but a giant flag. I want to see price go sweep levels before turning full on bullish. We must keep in mind that we are at the end of the month as well. so price can end up stalling till next week. but tomorrow there is a lot of News pending. So that can really shake things up.

DXY dayly structureMay change indeed
but its pretty much what meassures and current development is showing
GG
DXY FOMC FORECASTCristal Clear structure to me, dolar down today before FOMC and then up wild
Levels highlighted
Najors Gold and Cryptos will follow the same behavior
GG
Bearish reversal?The US Dollar Index (DXY) is rising towards the pivot and could reverse to the 1st support.
Pivot: 99.24
1st Support: 98.27
1st Resistance: 99.97
Risk Warning:
Trading Forex and CFDs carries a high level of risk to your capital and you should only trade with money you can afford to lose. Trading Forex and CFDs may not be suitable for all investors, so please ensure that you fully understand the risks involved and seek independent advice if necessary.
Disclaimer:
The above opinions given constitute general market commentary, and do not constitute the opinion or advice of IC Markets or any form of personal or investment advice.
Any opinions, news, research, analyses, prices, other information, or links to third-party sites contained on this website are provided on an "as-is" basis, are intended only to be informative, is not an advice nor a recommendation, nor research, or a record of our trading prices, or an offer of, or solicitation for a transaction in any financial instrument and thus should not be treated as such. The information provided does not involve any specific investment objectives, financial situation and needs of any specific person who may receive it. Please be aware, that past performance is not a reliable indicator of future performance and/or results. Past Performance or Forward-looking scenarios based upon the reasonable beliefs of the third-party provider are not a guarantee of future performance. Actual results may differ materially from those anticipated in forward-looking or past performance statements. IC Markets makes no representation or warranty and assumes no liability as to the accuracy or completeness of the information provided, nor any loss arising from any investment based on a recommendation, forecast or any information supplied by any third-party.

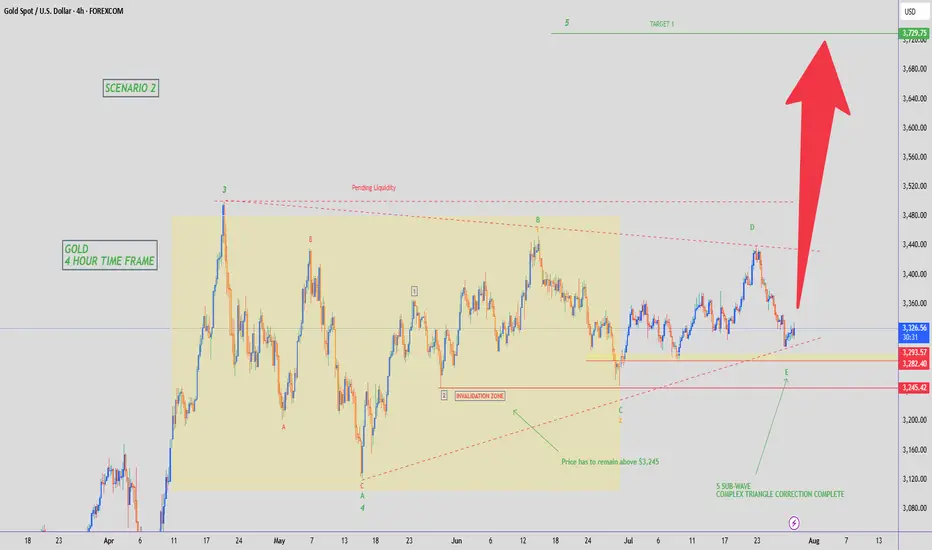
GOLD - WAVE 5 BULLISH TO $3,734 (UPDATE)Quick & simple ‘Elliott Wave Theory’ analysis for our Gold ALTERNATIVE SCENARIO.
⭕️Complex 5 Sub-Wave Correction.
⭕️Buyers Remain Above $3,245.
⭕️Pending LQ at $3,500.
DXY Goes 98.200 and then Bullish The DXY GOES 98.200 IN 1H OB then we see again dxy is bullish and next target is 99 to 100.
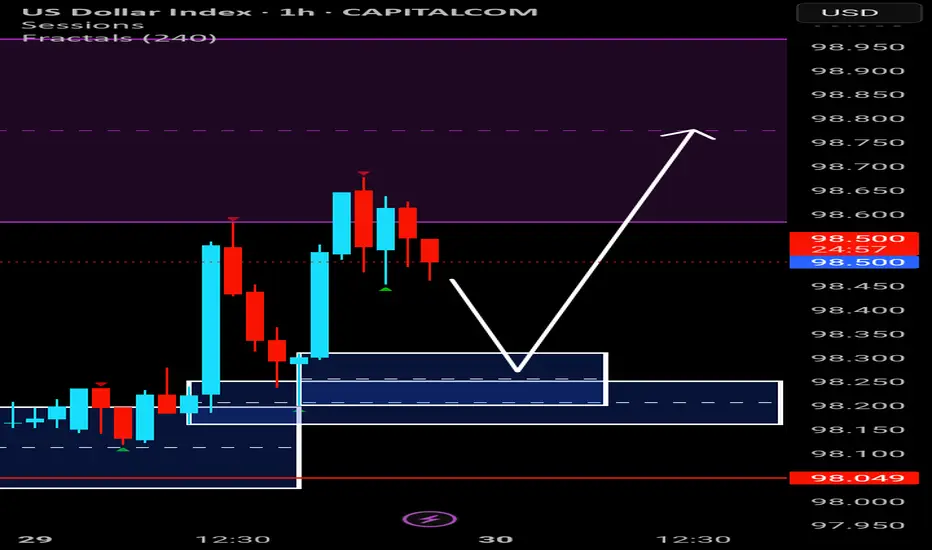
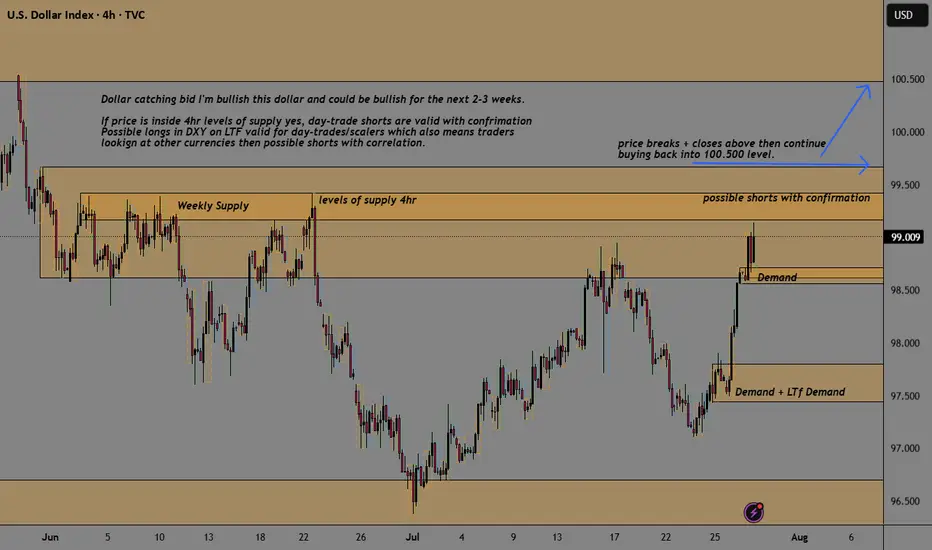
DXY Buyers Catching BidSee chart for analysis but even with price sitting inside levels of supply, we could easily see stronger Fundamentals coming out to drive this dollar back up into 100.5 areas of monthly supply. Short-term I remain bullish with long term views to the downside.
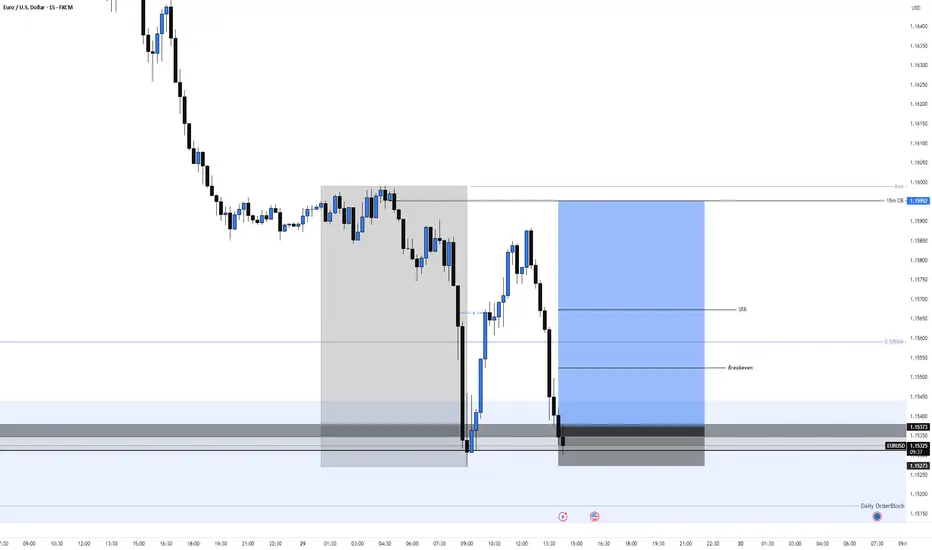
EURUSD Long, 29 JulyReversal Setup from Daily OB + LTF Confluence
Price tapped into a Daily Bullish OB with 50EMA support, signaling potential for a bullish reaction. While structure isn’t perfect, the overextension and DXY correlation offer strong intraday confluence.
📈 HTF Confluence:
✅ Sitting inside a Daily Bullish Orderblock
📍 50EMA in the same area → added support
🟢 Expecting a bounce from this zone, even if HTF trend isn’t clearly bullish yet
📉 LTF Context:
💤 Asia range formed, still unfilled → clean liquidity target
📉 Overextended bearish move into 15m POI
🪞 DXY at its own 15m POI + Asia range to complete → supports EU upside
🎯 Entry Plan:
✅ Clear 1m BOS after reacting from 15m Decisional OB
🎯 Entry taken at 5m OB inside that 15m POI zone
⚠️ Decisional OB isn’t ideal, but stacked confluences justify the risk
🛡 SL: Below 5m OB
📌 TP: Asia high + potential continuation if DXY breaks lower
US Dollar Index: Down YTD, But at a 5-Week HighThe U.S. dollar plays a leading role in the performance of U.S. stocks versus international stocks. The greenback endured its worst first-half performance since 1973, helping ex-U.S. equities post massive absolute and relative gains through June. But could the narrative be shifting? And what might it mean for investors?
The U.S. Dollar Index (DXY) sits at a five-week high ahead of the July Federal Reserve interest rate decision and the key July jobs report to be released on August 1. Up four sessions in a row, the dollar appears poised to post its best month since last December (in fact, the DXY's first positive month of 2025). If it’s the start of a protracted recovery, then the “U.S. exceptionalism” trade could be back in vogue over the second half, resulting in the same old story of U.S. over international in the stock market.

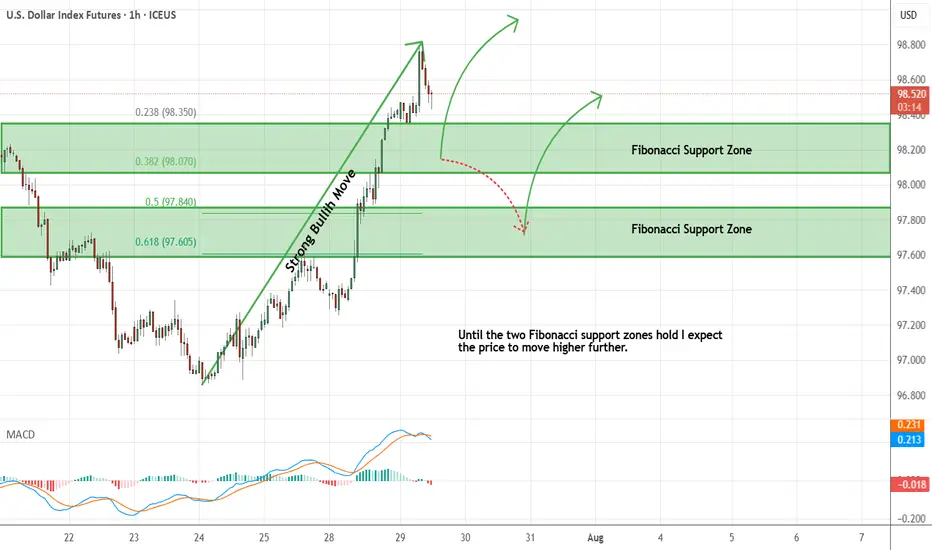
Dollar Index - Expecting Bullish Continuation In The Short TermH4 - Strong bullish momentum followed by a pullback.
No opposite signs.
Until the two Fibonacci support zones hold I expect the price to move higher further.
If you enjoy this idea, don’t forget to LIKE 👍, FOLLOW ✅, SHARE 🙌, and COMMENT ✍! Drop your thoughts and charts below to keep the discussion going. Your support helps keep this content free and reach more people! 🚀
--------------------------------------------------------------------------------------------------------------------
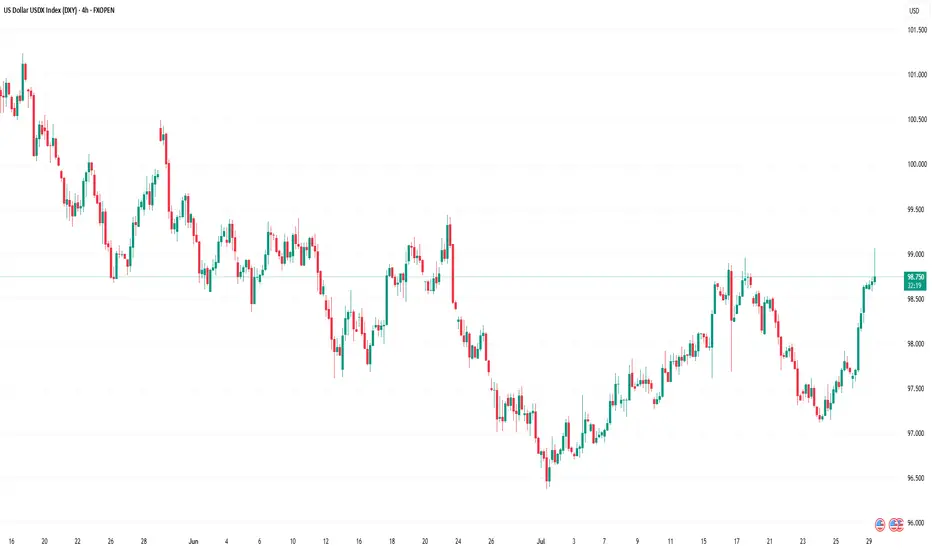
US Dollar Index (DXY) Reaches One-Month HighUS Dollar Index (DXY) Reaches One-Month High
The US Dollar Index (DXY) has risen to its highest level since early July. According to media reports, the bullish sentiment in the market is driven by the following factors:
→ Optimism around US trade agreements. A new trade deal with the EU — which includes a 15% tariff on European goods — is being perceived by the market as favourable for the United States.
→ Confidence in the resilience of the US economy. Strong Q2 corporate earnings have acted as an additional bullish catalyst. Investors may have started covering short positions against the dollar, viewing concerns over a US slowdown as overstated.
→ Expectations that the Federal Reserve will keep interest rates on hold.
From a technical standpoint, today’s DXY chart reflects strengthening bullish momentum.
Technical Analysis of the DXY Chart
Two U-shaped formations (A and B) that developed over the summer have created a bullish сup and рandle pattern — a formation that suggests waning bearish pressure, as evidenced by the shallower second dip.
This setup points to the potential for a bullish breakout above the trendline (marked in red) that has defined the downward movement in the DXY throughout the first half of 2025.
As previously analysed, there are signs that the dollar index may have found a base following a period of decline. This could indicate a shift in market sentiment and the possible end of the recent bearish phase.
This article represents the opinion of the Companies operating under the FXOpen brand only. It is not to be construed as an offer, solicitation, or recommendation with respect to products and services provided by the Companies operating under the FXOpen brand, nor is it to be considered financial advice.
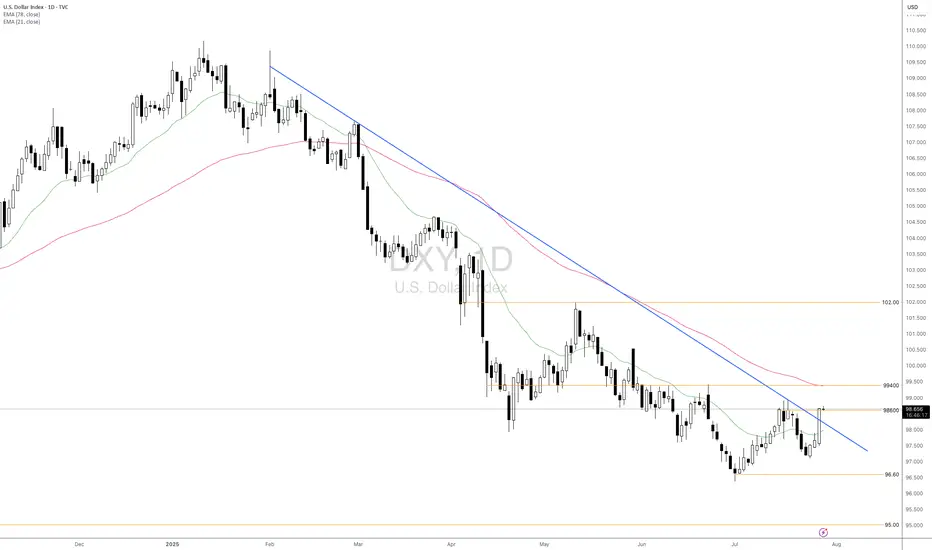
Will DXY Get Supported With Fresh US-EU Trade Agreement?Macro approach:
- The US dollar index has traded mixed since last week, pressured by lingering trade uncertainty and cautious market sentiment ahead of major economic events.
- Dovish Fed expectations and subdued US inflation continued to weigh on the greenback, while news of a fresh US-EU trade agreement and upcoming talks with China contributed to two-way price action.
- Economic data reflected a resilient labor market but flagged moderating US growth, with investors closely watching forthcoming GDP figures and the Fed's policy stance.
- The US dollar index may remain range-bound as markets await catalysts, including the Fed meeting, the 2Q GDP release, and key labor market data.
Technical approach:
- DXY surged and closed above the descending trendline and the resistance at around 98600, indicating an early signal of a shift in the market trend.
- If DXY maintains above 98600, it may retest the following resistance at 99400, confluence with EMA78.
- On the contrary, closing below the descending trendline and EMA21 may prompt a retest of the swing low at 96.60.
Analysis by: Dat Tong, Senior Financial Markets Strategist at Exness