Has gold Bottomed Out? Will the Bullishness continue from here?Looking for the bullish activity to continue from here but need to see a sweep and reject of the Previous daily Low before I want to get active. This would give confirmation that the price want to continue with this bullishness.
J-DXY

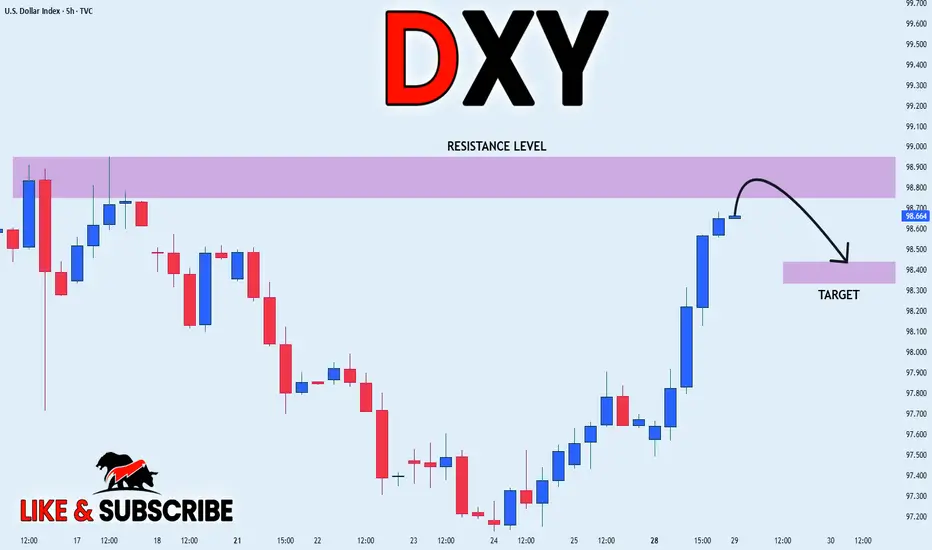
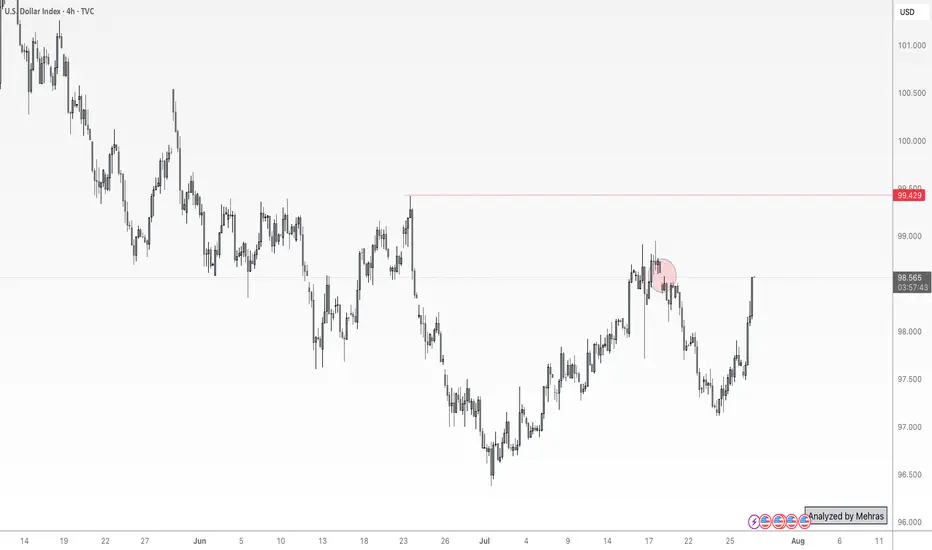
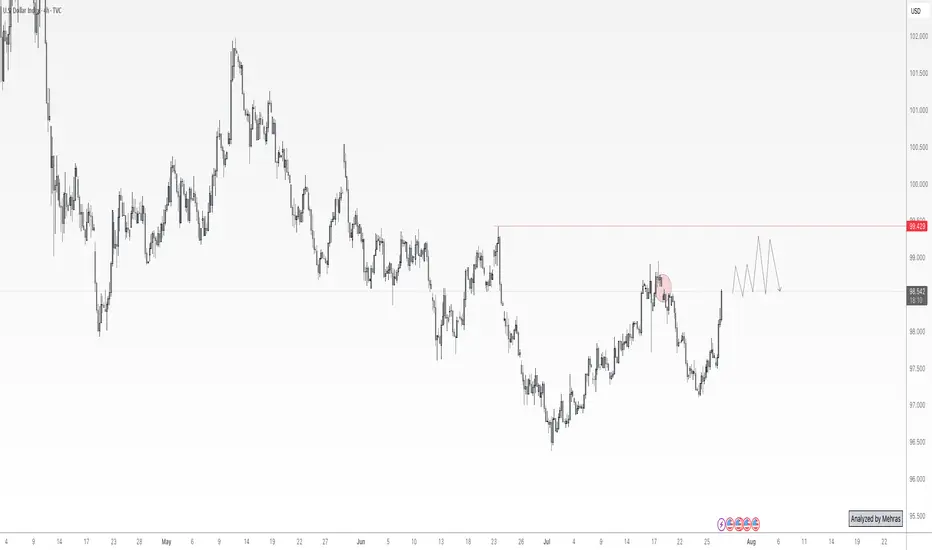
DXY LOCAL SHORT|
✅DXY is going up now
But a strong resistance level is ahead at 98.948
Thus I am expecting a pullback
And a move down towards the target of 98.451
SHORT🔥
✅Like and subscribe to never miss a new idea!✅
Disclosure: I am part of Trade Nation's Influencer program and receive a monthly fee for using their TradingView charts in my analysis.
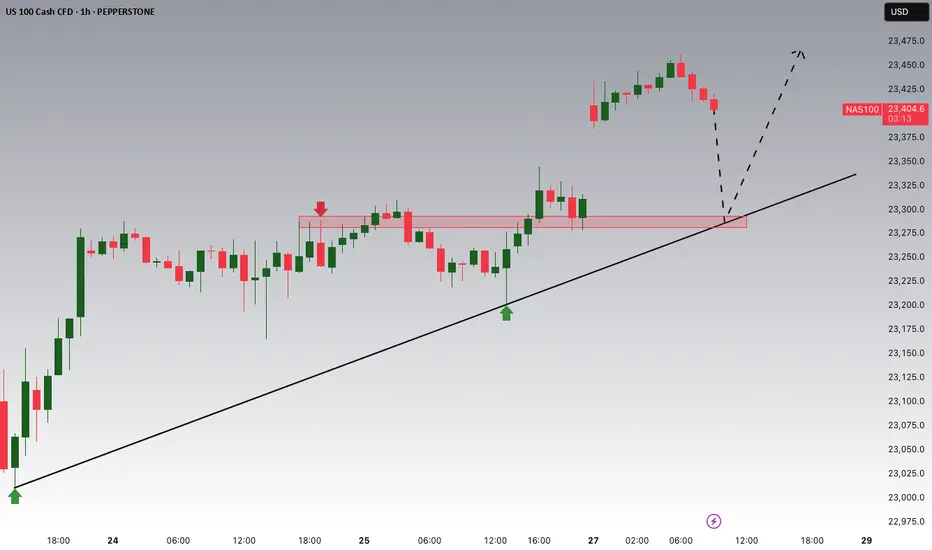
NASDAQ Potential UpsidesHey Traders, in today's trading session we are monitoring NAS100 for a buying opportunity around 23,300 zone, NASDAQ is trading in an uptrend and currently is in a correction phase in which it is approaching the trend at 23,300 support and resistance area.
Trade safe, Joe.
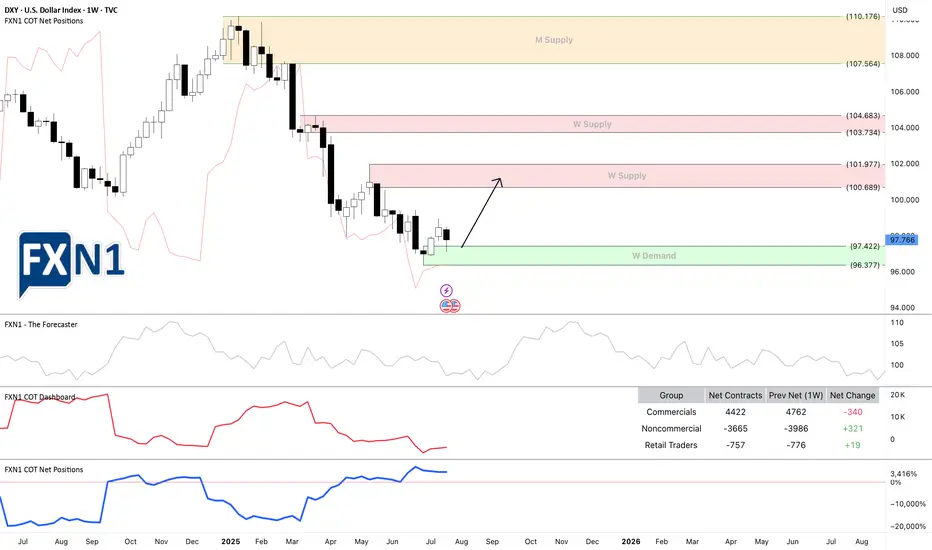
DXY: USD Flexes Muscle - Pairs SlideFriday, July 25, 2025
The foreign exchange markets are experiencing a pronounced USD bullish session this morning, with the US Dollar Index (DXY) showing robust gains of +0.35% while simultaneously pressuring all major currency pairs into negative territory. The Japanese Yen (JPY) is bearing the brunt of this dollar strength, currently registering losses between -0.4% to -0.66% across JPY pairs. This market behavior suggests traders should pay particularly close attention to DXY dynamics, as its movements will likely dictate price action across all major currency pairs in today's session.
Technical Perspective: DXY at Critical Inflection Point
A detailed examination of the Dollar Index reveals several compelling technical factors that market participants should consider:
1. Weekly Demand Zone Reaction
- The DXY has demonstrated a strong rejection from a significant weekly demand area
- The subsequent bullish spike indicates potential continuation of upward momentum
- This price action suggests institutional buyers are defending this key level
2. Commitment of Traders (COT) Report Insights
Non-commercial traders (typically hedge funds and speculators) have increased their positions from a bottom level not seen since June 2021 meanwhile the Commercial traders (often corporations hedging FX exposure) show opposing extreme positioning. This stark divergence between trader categories often precedes significant market moves
3. Seasonal Patterns Favor USD Strength
- Historical seasonal analysis indicates the current period typically supports dollar appreciation
- The combination of technical and seasonal factors creates a potentially powerful bullish setup
✅ Please share your thoughts about DXY in the comments section below and HIT LIKE if you appreciate my analysis. Don't forget to FOLLOW ME; you will help us a lot with this small contribution.
DXY at Its Most Critical Level of 2025 — Will the 100 Bank LevelThe Dollar Index (DXY), just like several other majors, is approaching a very important level. We’re now near the 100 mark, which is not only a psychological level — but also a key institutional (bank) level.
There’s also a gap zone left behind that price is about to fill. I believe the index will stay in a range over the next 1–2 days as it waits for critical data later this week — especially Wednesday’s announcements and Friday’s NFP report, which could set the tone for what’s next.
Based on current market sentiment, Trump’s remarks, Powell’s upcoming speech, and broader macro factors, I believe DXY has the potential to break above 100 and move toward 102–104, if that level is broken cleanly.
Let’s also not forget — price bounced from a monthly demand block near 96, and we’re seeing weak support across majors like EUR and Gold. That adds confluence for potential dollar strength.
📌 What do you think — is dollar strength just around the corner?
🔁 This analysis will be updated whenever necessary.
Disclaimer: This is not financial advice. Just my personal opinion.
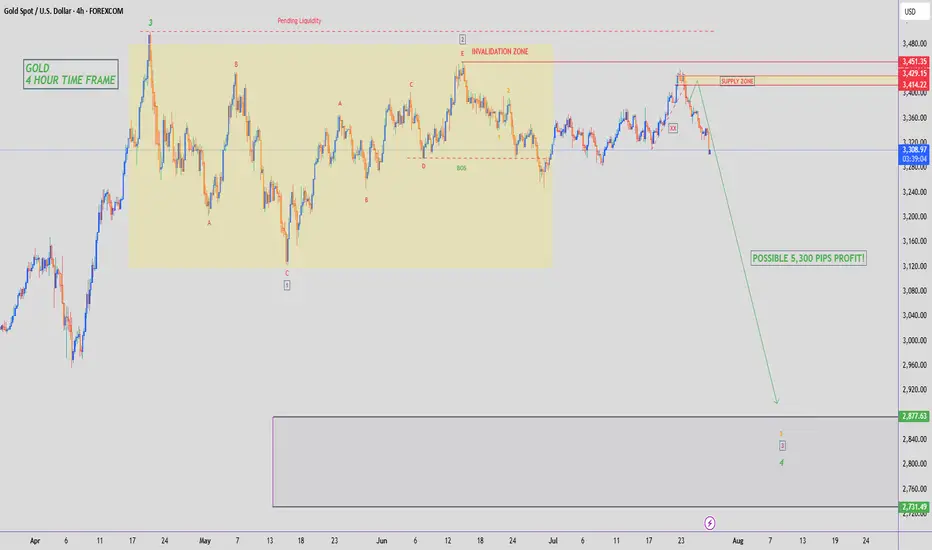
GOLD - SHORT TO $2,880 (UPDATE)Gold 'Sell Trade' running 1,130 PIPS in profit to start the week. I hope you are all taking advantage of this free analysis & profiting from Gold's downside. Amazing move to start the new week, with much more downside expected.
Drop me a message @XTBCAP for Account Management & Investment opportunities✅
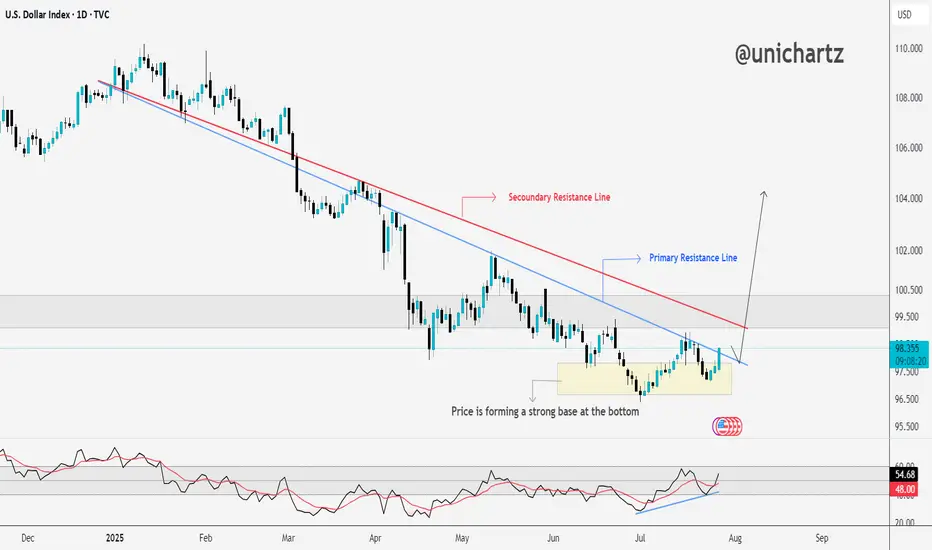
DXY Approaching Key Resistance — Trend Reversal Ahead?The DXY is forming a strong base at the bottom, showing clear signs of accumulation after a long downtrend.
Price has started pushing upward and is now approaching the secondary resistance line. A breakout here could open the path toward the primary resistance zone, which has capped rallies in the past.
The RSI is also trending higher, supporting this potential move.
If bulls clear the red resistance line, momentum could accelerate quickly.
DYOR, NFA
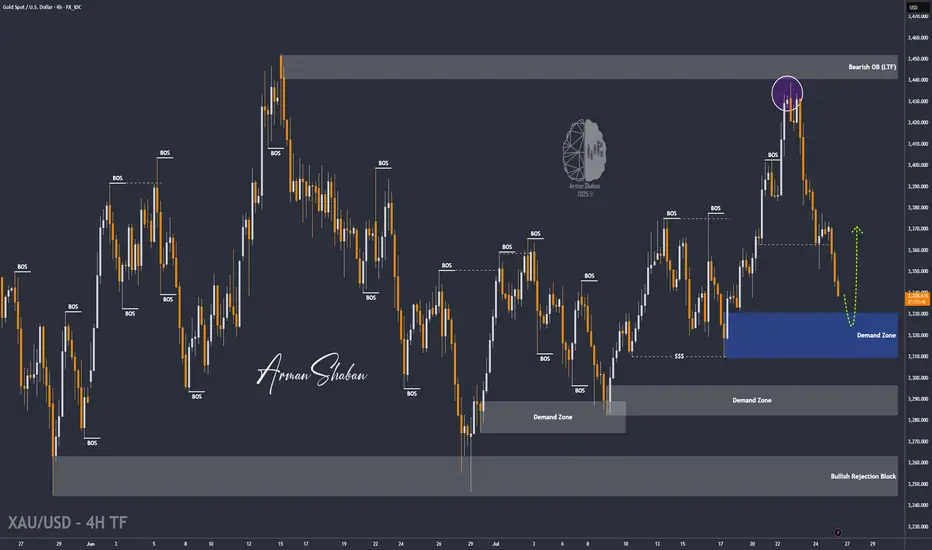
XAU/USD | Gold Holding Strong – Watching for Next Bullish Move!By analyzing the gold chart on the 4-hour timeframe, we can see that yesterday, as expected, when the price dropped to around $3357, it faced strong buying pressure and rallied up to $3377. After that, it corrected again, pulling back to $3338 so far, and is currently trading around $3341. If gold manages to hold above $3337, we can expect another bullish move, with potential targets at $3347, $3354, $3364, and $3374.
Please support me with your likes and comments to motivate me to share more analysis with you and share your opinion about the possible trend of this chart with me !
Best Regards , Arman Shaban
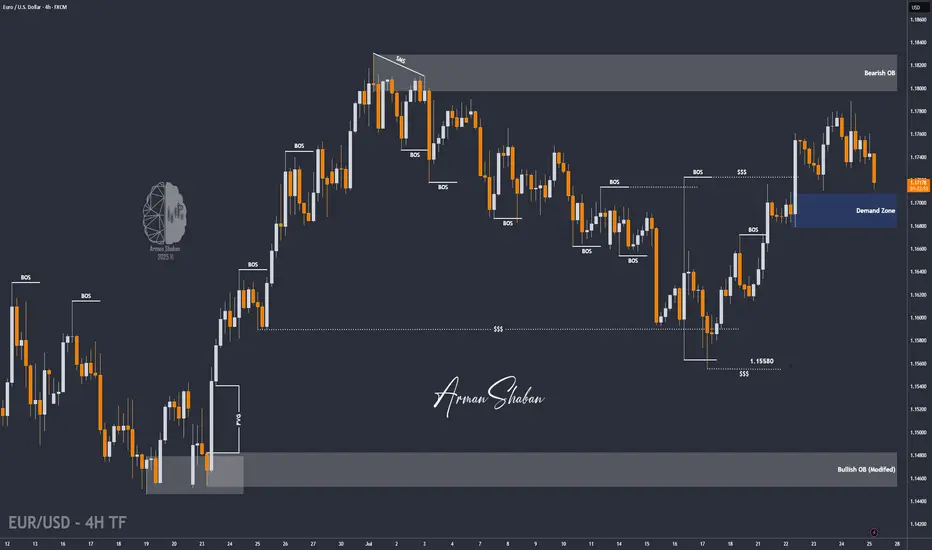
EUR/USD | Correction Near Key Demand – Watching for Rebound!By analyzing the EURUSD chart on the 4-hour timeframe, we can see that after the last analysis, the price started a correction and is currently trading around 1.17150. I expect that once it enters the 1.16780–1.17100 zone, we could see a rebound from this key demand area. If the price holds above this zone, the next bullish targets will be 1.17370 as the first target and 1.17730 as the second.
Please support me with your likes and comments to motivate me to share more analysis with you and share your opinion about the possible trend of this chart with me !
Best Regards , Arman Shaban
Analysis on the DXY – EURUSD RelationshipHello traders,
Here’s an analysis that can be useful for both short-term and swing trades on EURUSD and DXY. Our trading team’s calculations are as follows:
Analysis on the DXY – EURUSD Relationship
Currently, DXY is at 98.200. Historical statistical data indicate that if DXY declines toward 96.300, there is approximately a **1.55% probability of an upward move** in EURUSD.
Based on this scenario:
Current EURUSD level: 1.16500
Projected target level:1.1830
While the correlation data show a strong inverse relationship, it’s important to note that periodic deviations can occur in the market. Therefore, this analysis should be considered a statistical projection only, not a guaranteed outcome.

XAUUSD - Gold is in for a big week?!Gold is trading below the EMA200 and EMA50 on the 4-hour timeframe and near the bottom of its medium-term ascending channel (breakout or no break is yet fully confirmed). A correction towards demand levels would provide us with a better risk-reward buying position, and if it rises, we could consider shorting it in supply levels.
In the past week, gold experienced two distinct phases in its price movement: a strong upward trend in the first half that stalled at key resistance levels, leading the market into a more cautious mode. The latest surveys reveal a clear division among gold analysts—some foresee a bearish outlook, while others prefer to remain neutral and wait for further signals. Meanwhile, retail traders remain optimistic about gold’s short-term trajectory and emphasize the continuation of its upward trend.
Analysts at Commerzbank believe the gold market is currently directionless and searching for a clear trend. In their view, recent news around potential trade agreements has weakened demand for gold as a safe-haven asset. They have adopted a neutral stance in the short term, stating that gold prices are near their upper limit with limited room for further gains at the moment.
Conversely, some experts are confident in the continuation of gold’s bullish trend. Rich Checkan, President and CEO of Asset Strategies International, declared: “Gold is in an uptrend. Today’s pullback is setting the stage for next week’s rally. If the Federal Open Market Committee (FOMC) meets expectations and holds rates steady, both gold and silver will keep climbing. And if the Fed exceeds expectations by cutting rates, we’ll see an even stronger surge in both metals. Either way, the direction is upward.”
At the same time, other analysts remain cautious about the trend’s sustainability. Mark Leibovit, editor of VR Metals/Resource Letter, warned that the U.S. dollar may be forming a bottom, which could exert downward pressure on gold and calls for increased caution from investors.
Despite continued political pressure from President Trump, the Federal Reserve is not expected to lower interest rates at the upcoming meeting. Central bankers have stated that they want to observe the economic effects of tariffs before making any adjustments. Although some Fed officials are moving away from the “wait and see” approach, analysts still believe the Fed will leave rates unchanged this week—though markets are closely watching for any signals suggesting that rate cuts could begin as early as September.
Meanwhile, China’s gold consumption in the first half of 2025 declined, though the drop was less severe than in previous years. The primary reason was increased demand for gold as a safe-haven investment, which partially offset reduced jewelry purchases due to high prices.
According to data from the China Gold Association, a government-affiliated body, gold consumption fell by 3.54% year-over-year in the first half of the year to 505,205 tons. In comparison, Q1 saw a 5.96% annual decline, and the same period in 2024 recorded a 5.61% drop.
The association stated that growing geopolitical tensions and ongoing economic uncertainty have strengthened gold’s role as a store of value and safe asset, prompting a significant rise in private investment in bars and coins.
Gold bar and coin purchases—a key indicator of safe-haven demand—surged by 23.7% to 264,242 tons, accounting for 52% of total consumption and overtaking jewelry as the largest consumption segment. Meanwhile, gold jewelry demand fell by 26% to 199,826 tons, reflecting weakened consumer interest due to high prices.
Still, the association noted that lighter jewelry products with unique designs and higher value-added features remain popular. Additionally, official data from the People’s Bank of China (PBOC) showed that the central bank increased its gold reserves in June for the eighth consecutive month.
On the supply side, domestic gold production fell by 0.31% year-over-year to 179,083 tons in the first half of the year, while output from imported sources rose by 2.29% to 76,678 tons. Altogether, China’s total gold production grew by 0.44%, reaching 252,761 tons.

Dollar Index (DXY): Possible Reversal | Inverse Head & ShouldersThe dollar has had a tough year, but that might be changing.
I’ve spotted a well-known reversal pattern: an Inverse Head & Shoulders.
This pattern features three dips, with the middle one—the "head"—being the deepest.
Now, the price has rebounded from the Right Shoulder and is heading higher.
It’s approaching the Neckline at $98.7, which needs to be broken for a bullish confirmation.
If that happens, the projected target is around $101.6, based on the depth of the pattern.
This lines up closely with the previous high of $102 from May. The target area is highlighted in the blue box.
However, if the price falls below the Right Shoulder’s low at $97.1, the pattern would be invalidated.
Anyone else see this pattern?
Could this be the bottom for the dollar?

New Week...New Bullishness on Gold???Sorry my post have not been showing up. I have mistakenly been posting them as private! lol. But new week on gold looking to see some good bullish action this week but it also is the end of the month and price could stall till we get some news to move it. I need more confirmation before taking any moves so we are watching for now.

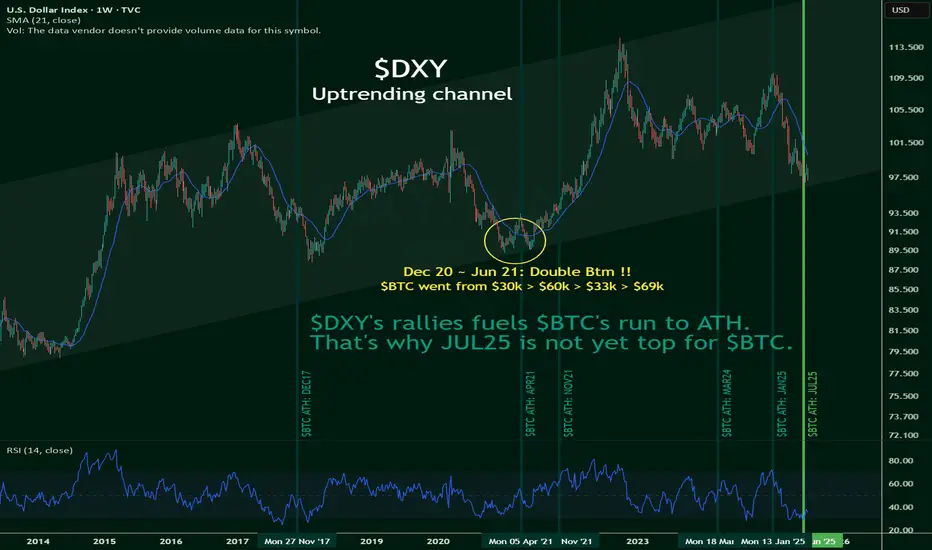
$BTC's run to ATH is fueled by $DXYNOT FINANCIAL ADVICE
I've yet to see this being mentioned anywhere on the internet, but TVC:DXY 's rally may just be CRYPTOCAP:BTC 's best friend.
This, despite the popular notion that when TSX:DXT goes up, CRYPTOCAP:BTC goes down, and vice-versa.
However, this novel idea puts a break to it.
TVC:DXY is hitting the bottoms of its uptrending channel, and it's likely to bounce back up towards the ceilings.
Which means a rally is likely, and this is kinda good for $BTC.
I'll remain bullish, until the numbers say otherwise.
Natural Gas | Oil | Dollar | Silver | Gold Price Forecast.Natural Gas | Oil | Dollar | Silver | Gold Price Forecast.
NYMEX:NG1! AMEX:UNG NYMEX:CL1! COMEX:GC1!

DXY forecast From weekly view the DXY is looking bearish at least till 95.123 key level the will see if we get a bullish power as the DXY is forming a reversal pattern. But of course many factors plays part in this economy, for example, global news like Tariffs and other factors.
So when DXY is trading on the 95.123 key level additional confluence will give us the right to put on trades, as the 95.123 key level is significant for what will take place next.
Take you all.......

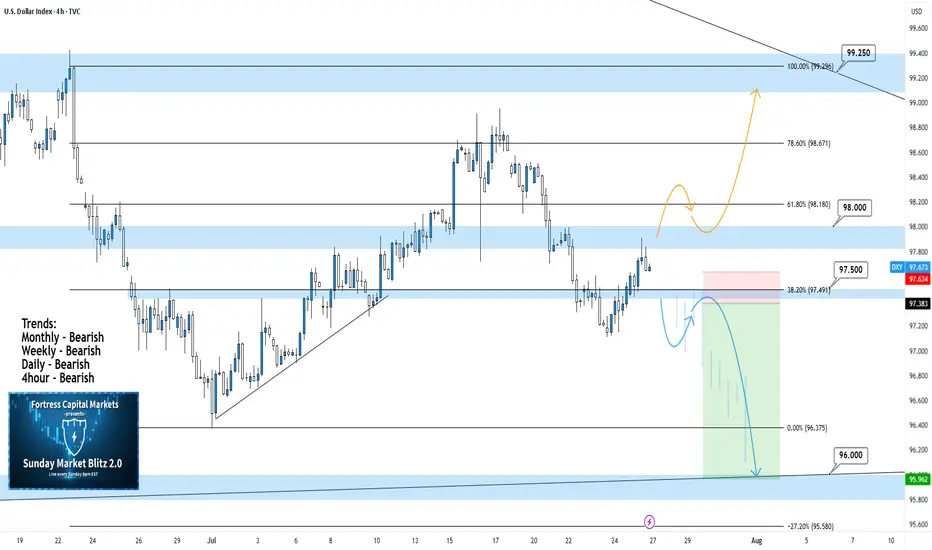
DXY 4Hour TF - July 27, 2025DXY 7/27/2025
DXY 4hour Bearish Idea
Monthly - Bearish
Weekly - Bearish
Dailly - Bearish
4hour - Bearish
**We analyze DXY as an indicator of USD strength on a week to week basis**
This week is looking like we can expect bearish momentum on USD but here are two scenarios breaking down the potential:
Bearish Continuation - USD pulled a strong bearish reversal all last week which pushed us below our major 98.000 support zone.
We are now testing that same 98.000 zone as resistance and are looking to see if it will hold. Ideally, we can confirm further bearish structure to gain confidence in a bearish USD for the week ahead.
Bullish Reversal- For us to consider DXY as bullish again we would need to see bullish structure above our 98.000 zone. This would include: A break back above 98.000 with an established HH and HL.
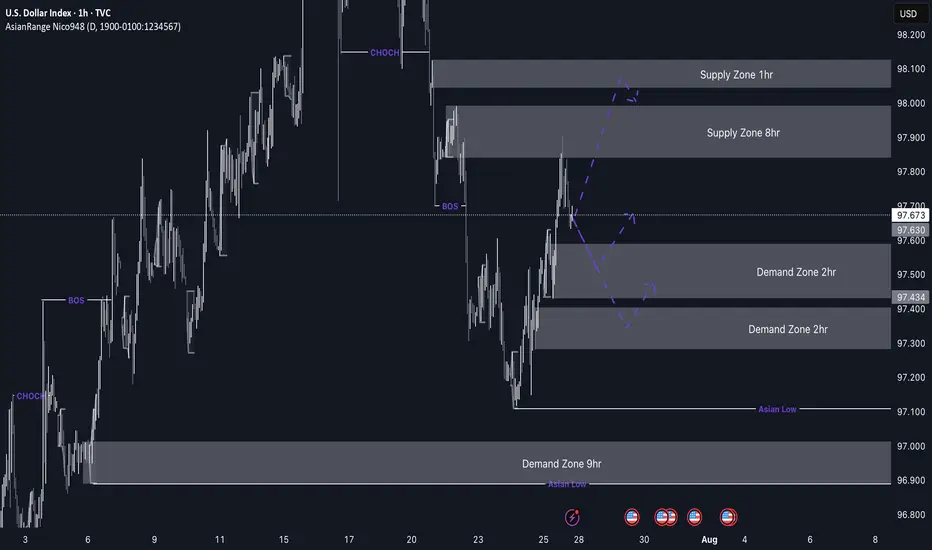
DXY weekly outlookDXY Weekly Outlook
This week, I’m watching to see if the dollar continues its bearish trend or breaks above the current supply zone. We've already seen a strong reaction from the 8hr supply, but price could still tap into the 1hr supply before making its next move.
If price drops from here, I’ll be looking at the 2hr demand zone below for a possible bullish reaction. If DXY pushes up from that zone, pairs like EU and GU could drop — which lines up with my overall short bias on those.
Gold may not always move in sync with the dollar, but DXY still gives a good idea of market sentiment.
Let’s see how it plays out and stay reactive.
I HATETO BETTING. LET SEE WHY DXY Goes to there in my scenarioon August scenario
* Trumph's 10% import Tariff (Decision imminient)
* Powell speaking at Jackson Hole (August 22-24)
* Safe Haven printing Money

DXYDXY needs some more correction, if the correction is completed before Feds decision then a drop can follow otherwise Feds will push it up and NFP will drop it again.
Disclosure: We are part of Trade Nation's Influencer program and receive a monthly fee for using their TradingView charts in our analysis.

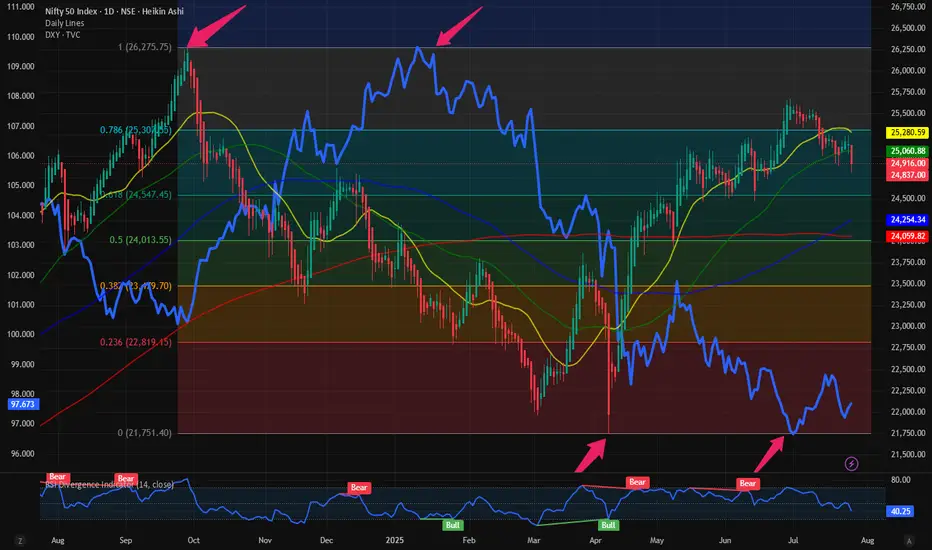
$NIFTY: Minor hiccup or downside expected. Answer: Watch $DXYRecently we have seen some weakness in NSE:NIFTY where it has failed to break out of the upward sloping Fib Retracement level. On June 16 we reflected upon the situation with $NIFTY. I was bullish on NSE:NIFTY due to the $DXY.
TVC:DXY weakness and EM markets: NSE:NIFTY more upside? for NSE:NIFTY by RabishankarBiswal — TradingView
My prediction was that the NSE:NIFTY can reach 26000 and TVC:DXY @ 96 by end of July. But the unravelling of the TVC:DXY short trade and recent strength in TVC:DXY has put pressure on our outlook.
Now we can go to the micro level and check what happening in the charts for both TVC:DXY and $NIFTY. In the daily chart below we overlayed TVC:DXY on top of the NSE:NIFTY candle stick chart. If we draw the Fib retracement level form the top to bottom of the NSE:NIFTY on the yearly chart we can see clear levels at play. It is also astounding to see how the Top and the bottom range of the Fib levels match to those from the $DXY. After making a new low of 97, TVC:DXY saw some short covering which took it back to 99. At the same time NSE:NIFTY put out a local top @ 25600 and then pulled back below to 0.786 Fib level currently below the psychological level of 25000. Hence our July end target of 26000 for NSE:NIFTY and 96 for TVC:DXY looks distant but not unrealistic. With 4 more trading days left in the month we might rally another 4.5% in NSE:NIFTY and drop 2% in TVC:DXY giving us a perfect leverage trade and meeting our July targets.
Verdict: NSE:NIFTY @ 26000 and TVC:DXY @ 96 as target remains intact. If not in July, we will achieve it in August.
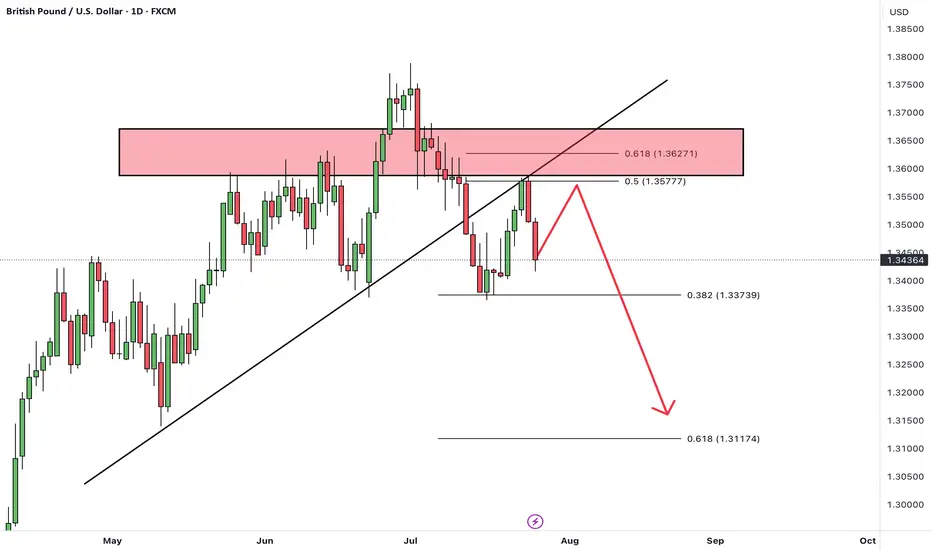
GBPUSDHello Traders! 👋
What are your thoughts on GBPUSD?
GBP/USD has broken below a trendline and has completed a retest (pullback) to the broken level.
The pair is now positioned for a potential downward move.
After some short-term consolidation, we expect price to drop at least toward the next identified support level.
As long as GBP/USD stays below the broken trendline, the bearish bias remains valid, and further downside is likely.
Don’t forget to like and share your thoughts in the comments! ❤️