ETH – Rounded Distribution Before the Punch Higher?What we’re seeing here is a potential fakeout setup within a value zone.
Notice the rounded top formation — looks bearish — but price refuses to break the low. This often sets the stage for a sharp reversal.
Structure Breakdown:
Volume profile shows acceptance in current range
Rounded top shape implies weakness — but no breakdown = trap potential
Price holds a higher low inside the range = absorption
Green box marks ideal long entry area — well-defined invalidation below
Bullish case:
We’re watching for that reclaim of the mid-level → quick push into the upper range
Target zone = 2,618 (clean inefficiency fill + local top)
Bearish trap scenario invalidated if price closes below red box (stop hunt level)
Strategy bias:
This is a compression-reversal trap — fake weakness to trap shorts, then launch.
Patience pays here — if it reclaims and consolidates at the mid, it’s time to ride.
📊 More setups like this, early in structure, are shared inside the account description. Tap in for the breakdowns.
J-ETH

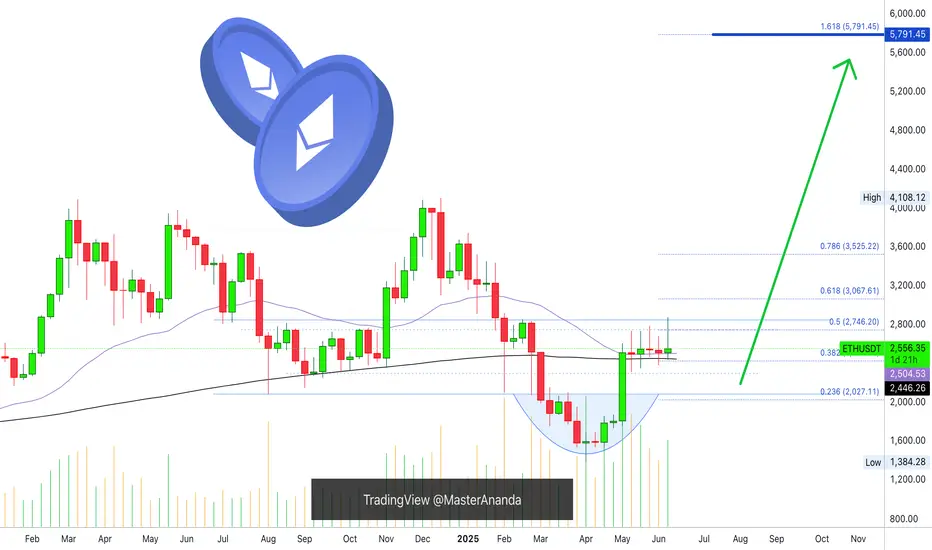
ETH | BULLISH Pattern | $3K NEXT ??Ethereum has established a clear bullish pattern in the daily as we're seeing an inverse H&S:
The war issues across the globe must also be considered. So far, it's been bullish for crypto but this can also change overnight since it's a very volatile situation - and crypto being a very volatile asset.
For the near term, I believe ETH is due for another increase - at least beyond the current shoulder. This is IF we hold the current support zone:
It seems to be a bit of a slow burn with ETH for this season's ATH. In the ideal world, we'd either:
📢 consolidate under resistance (bullish)
📢make a flag (bullish)
📢OR smash right through the resistance.
But there's likely going to be heavy selling pressure around that zone.
__________________________
BINANCE:ETHUSDT

ETH at critical levelsCRYPTOCAP:ETH is at the bottom of the structure, great risk-to-reward ratio. However, the bearish thesis needs to consider a dip to 2kish level. To make the DCA strategy work best, buying on dips is vital.
Full TA: Link in the bio

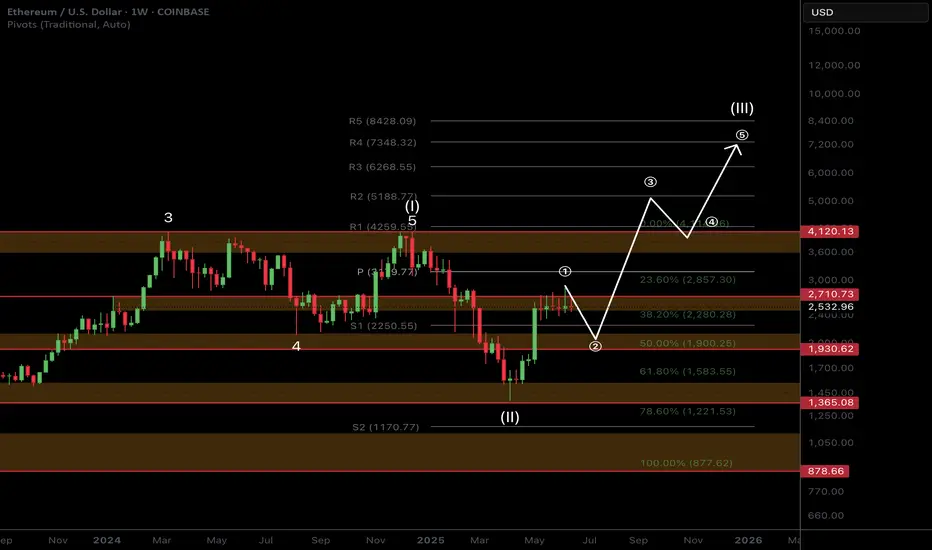
ETH Macro Analysis☕ 𝙂𝙈. CRYPTOCAP:ETH Macro analysis update...
📈 𝙇𝙤𝙣𝙜 𝙩𝙚𝙧𝙢 outlook remains unchanged and recent price action printing a doji. Target is still $7k for this cycle.
📉 𝙎𝙝𝙤𝙧𝙩 𝙩𝙚𝙧𝙢 outlook has investors looking lower towards the $1900 target but this isn't guaranteed to be reached and price action may front tat $2200.
War escalation's and retail selling are keeping price suppressed. ETF inflows and staking continue to grow!
The time for patience continues. Money is made in the sitting, weathering volatility, not flipping in and out of trades on every bit of news and price movement
𝙏𝙚𝙘𝙝𝙣𝙞𝙘𝙖𝙡 𝘼𝙣𝙖𝙡𝙮𝙨𝙞𝙨
Price is consolidating at its recent highs. Consolidation under resistance has high probability of breaking out, the longer it remains the higher the probability.
Elliot Wave (EW) analysis suggests a motif wave ended at the $2700 resistance, with a wave 2 retracement underway, likely a shallow one.
Safe trading
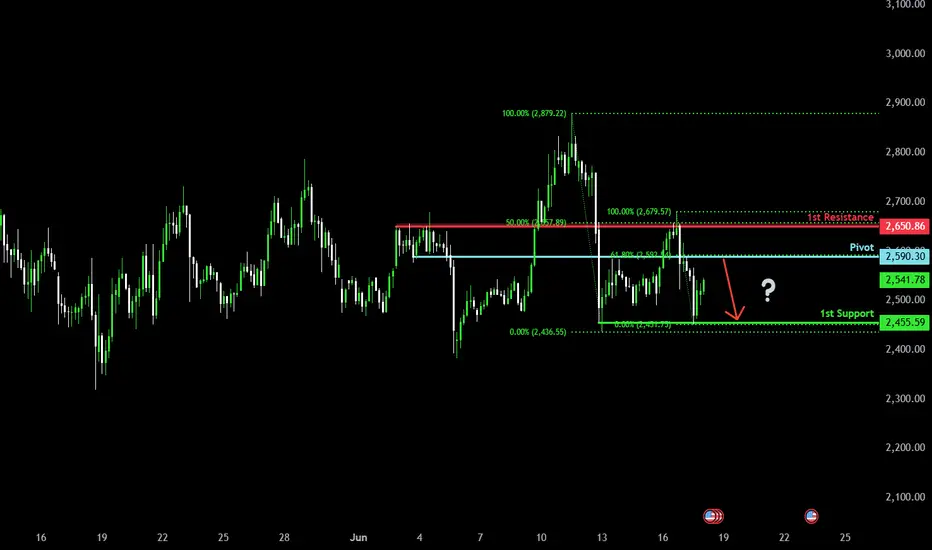
Potential bearish drop?Ethereum (ETH/USD) is rising towards the pivot and could reverse to the pullback support.
Pivot: 2,590.30
1st Support: 2,455.59
1st Resistance: 2,650.86
Risk Warning:
Trading Forex and CFDs carries a high level of risk to your capital and you should only trade with money you can afford to lose. Trading Forex and CFDs may not be suitable for all investors, so please ensure that you fully understand the risks involved and seek independent advice if necessary.
Disclaimer:
The above opinions given constitute general market commentary, and do not constitute the opinion or advice of IC Markets or any form of personal or investment advice.
Any opinions, news, research, analyses, prices, other information, or links to third-party sites contained on this website are provided on an "as-is" basis, are intended only to be informative, is not an advice nor a recommendation, nor research, or a record of our trading prices, or an offer of, or solicitation for a transaction in any financial instrument and thus should not be treated as such. The information provided does not involve any specific investment objectives, financial situation and needs of any specific person who may receive it. Please be aware, that past performance is not a reliable indicator of future performance and/or results. Past Performance or Forward-looking scenarios based upon the reasonable beliefs of the third-party provider are not a guarantee of future performance. Actual results may differ materially from those anticipated in forward-looking or past performance statements. IC Markets makes no representation or warranty and assumes no liability as to the accuracy or completeness of the information provided, nor any loss arising from any investment based on a recommendation, forecast or any information supplied by any third-party.
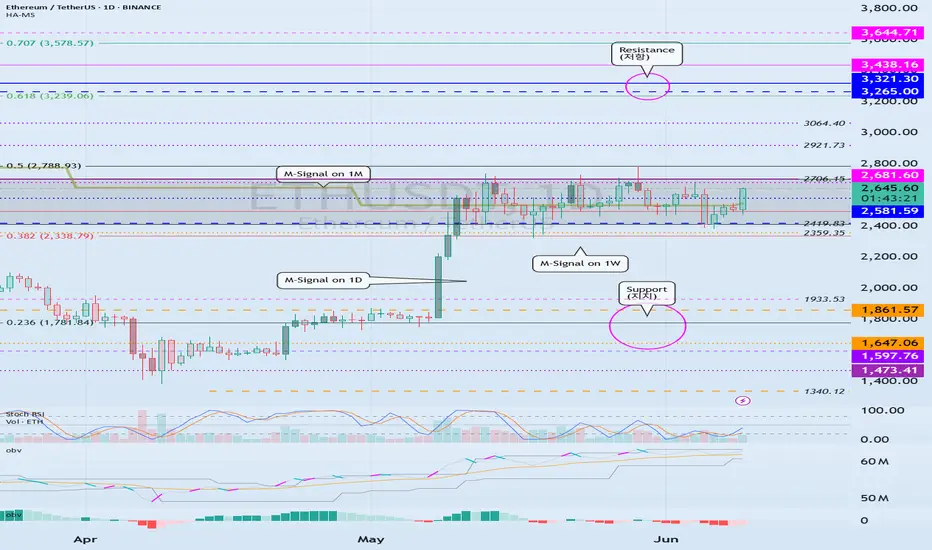
Breakout point: 2706.15
Hello, traders.
If you "follow", you can always get the latest information quickly.
Have a nice day today.
-------------------------------------
(ETHUSDT 1D chart)
The key is whether the price can rise above the important support and resistance area of 2419.83-2706.15 and maintain it.
Therefore, when the 2706.15 point is broken upward, it can be said that a breakout trade is possible.
The conditions for a breakout trade are:
- OBV must rise above the High Line and be maintained,
- OBV oscillator must show an upward trend,
- StochRSI indicator must show an upward trend.
However, it is better if StochRSI indicator has not entered the overbought zone.
When the rise begins, the resistance zone is expected to be around 3265.0-3321.30.
-
Although funds are continuously flowing into the coin market, it may feel like the trading volume has decreased.
The reason for this is thought to be that BTC dominance is generally showing an upward trend.
The meaning of BTC dominance rising means that funds in the coin market are concentrated toward BTC.
Therefore, I think that the overall trading volume has decreased because more funds are needed for the price to rise.
When the altcoin bull market begins, more transactions will occur, which will make you think that liquidity has increased in the coin market.
Therefore, for the altcoin bull market to begin, the BTC dominance must fall below 55.01 and remain there or continue to fall.
If the USDT dominance remains below 4.97 or continues to fall, the coin market is likely to rise.
At this time, depending on the BTC dominance mentioned earlier, you can distinguish whether the rise is focused on BTC or whether the altcoin is also rising.
If the BTC dominance continues to rise, most altcoins are likely to gradually move sideways or fall.
Therefore, if you are trading altcoins in this situation, I think it would be useful to increase the number of coins (tokens) corresponding to profit while responding quickly and briefly.
In other words, it means selling the purchase amount (+including transaction fees) when the price rises by purchase price, leaving the number of coins (tokens) corresponding to profit.
The coins (tokens) increased in this way are coins (tokens) with an average purchase price of 0, which will reduce the psychological burden when the altcoin bull market begins, allowing you to obtain a good average purchase price.
-
Thank you for reading to the end.
I hope you have a successful transaction.
--------------------------------------------------
- This is an explanation of the big picture.
(3-year bull market, 1-year bear market pattern)
I will explain more details when the bear market starts.
------------------------------------------------------
HolderStat┆ETHUSD continues to accumulateOKX:ETHUSDT is catching bids at the 2.50 k rail after triangle retest, converting shakeout into upside continuation. Staying above 2.40 k keeps bias north; clearing 2.75 k releases the 3 k target rocket 🚀
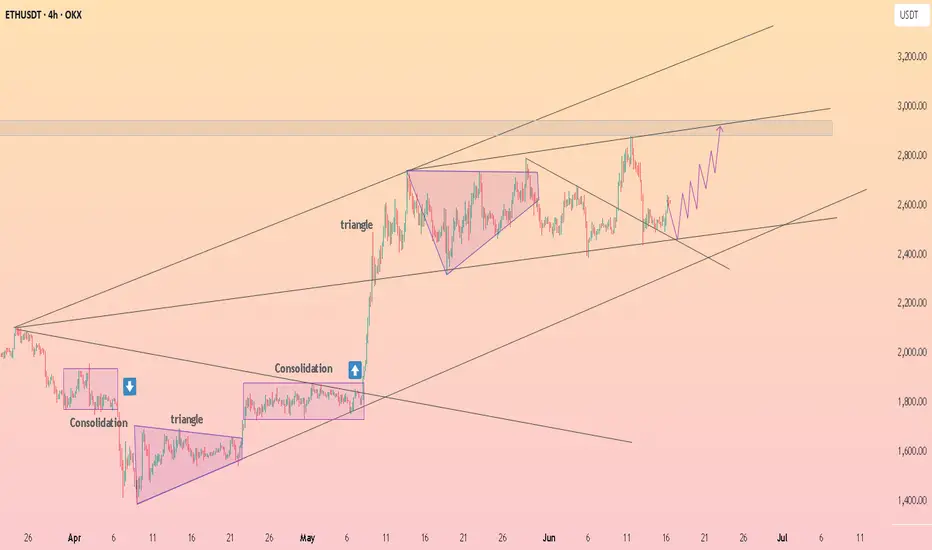
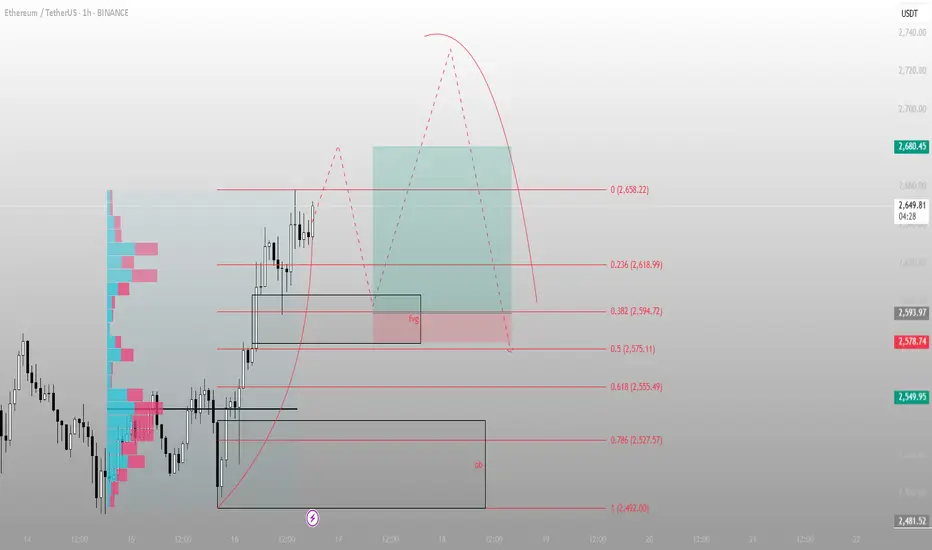
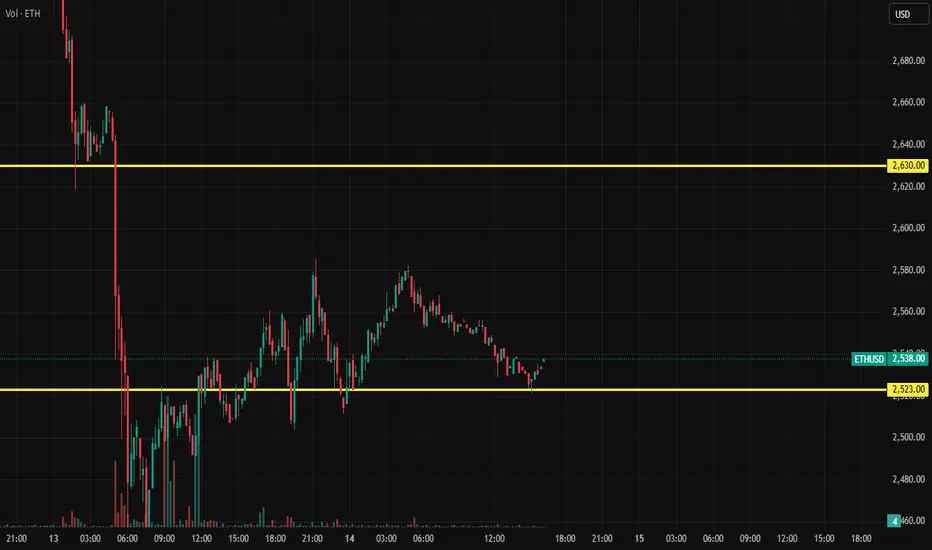
ETH didn’t rally — it cleared inefficiency and pausedThis isn’t the move. This is the setup for the move.
ETH tagged 2658.22 — premium — and stalled right where Smart Money pauses before redistributing or rotating.
Here’s how this lines up:
Price swept into the 0 fib (2658.22), then hesitated — that’s not weakness, that’s precision
Just below sits a clean FVG at 2594–2575, right between the 0.382–0.5 fibs
Below that: OB near 2527–2492 — last line of defense before momentum flips
Right now, ETH is offering a reactive pullback opportunity. If bulls hold 2594–2575 with a bounce, we rotate higher again. But if they don’t — 2527 becomes the decision zone.
Execution lens:
Ideal re-entry zone: 2594–2575
Invalidation: sustained close below 2555 = expect OB tap
If FVG holds, expect revisit of 2658 → extension toward 2680s
This setup isn’t done. It’s developing. Wait for price to speak — not hope.
For more plays built like this — mapped in advance, not after the fact — check the profile description
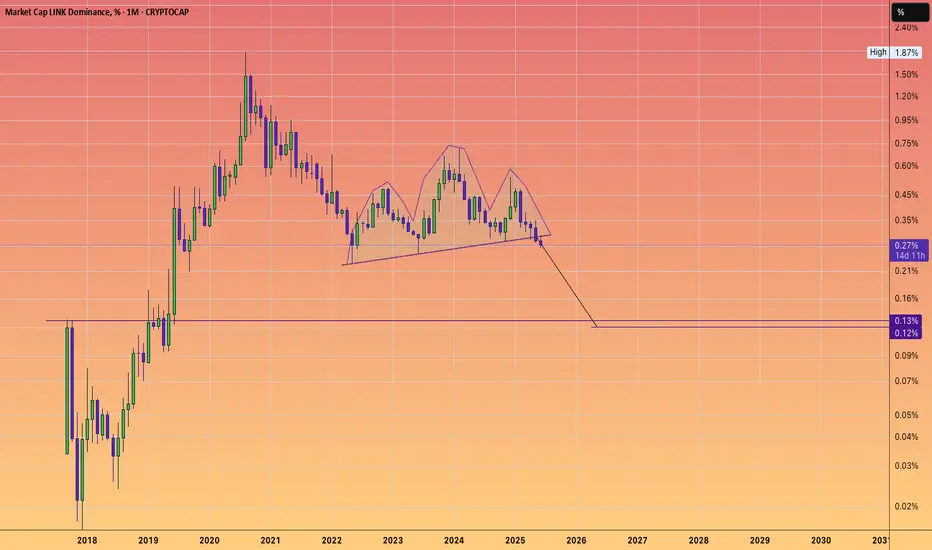
LINK MARINES are becoming a dwindling force.It was likely a fabricated tag solely for Crypto Twitter, conceived by early ICO investors. Something to rally a war cry behind.
Similar to the LINK Crypto dominance chart.
There’s a continuation head & shoulders pattern with a logarithmic target indicated.
Indeed, the token might increase in dollar value.
However, with 700 employees to compensate through token sales,
The salaries are excessive given the stagnant growth of token holders, and I must say, the decline in holders over the years makes it difficult to sustain the price/valuations.
If a #DEFI season was to occur, I would probably take advantage and unload old bags into the pumps.
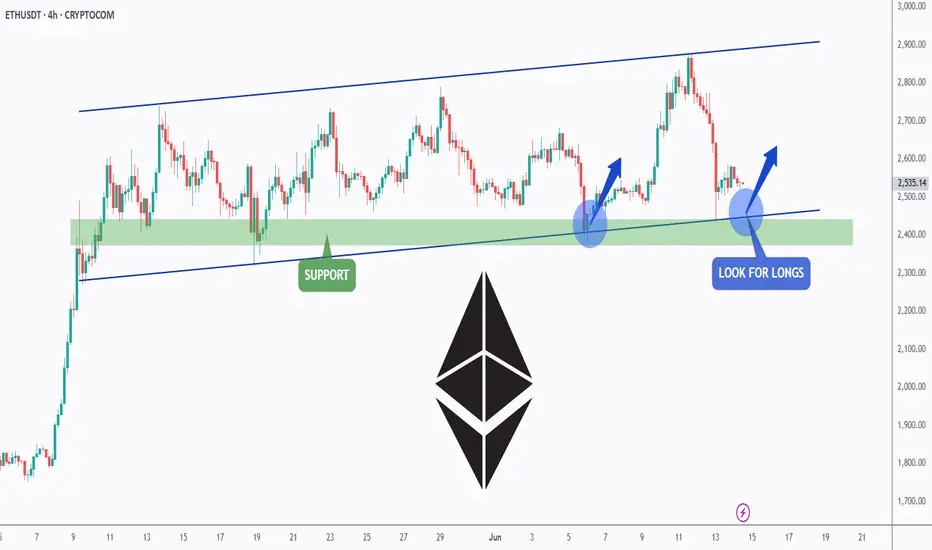
ETH is doing it AGAIN!Hello TradingView Family / Fellow Traders. This is Richard, also known as theSignalyst.
📈ETH has been overall bullish trading within the flat rising channels marked in blue.
Moreover, the green zone is a strong support zone!
🏹 Thus, the highlighted blue circle is a strong area to look for buy setups as it is the intersection of support and lower blue trendlines acting as non-horizontal support.
📚 As per my trading style:
As #ETH approaches the blue circle zone, I will be looking for bullish reversal setups (like a double bottom pattern, trendline break , and so on...)
📚 Always follow your trading plan regarding entry, risk management, and trade management.
Good luck!
All Strategies Are Good; If Managed Properly!
~Rich
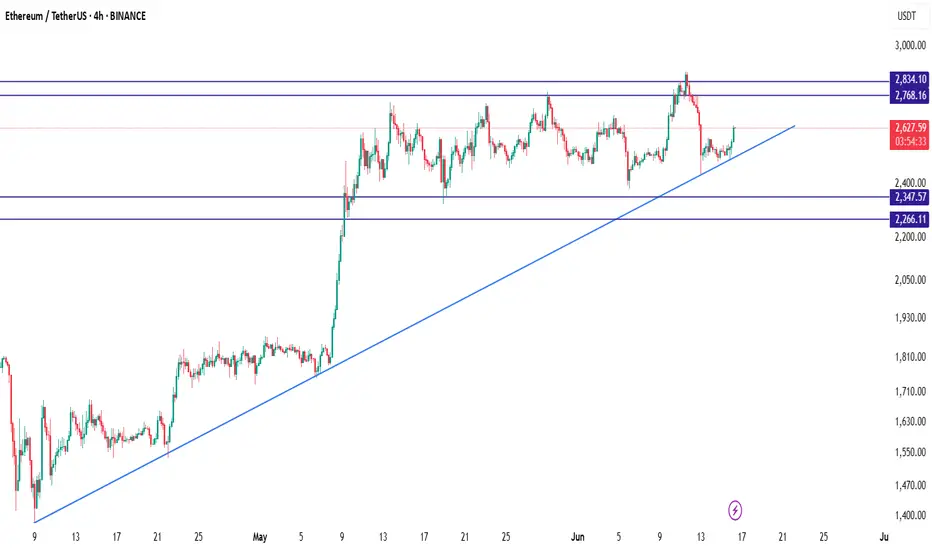
ETH/USDTEthereum (ETH/USDT) is currently maintaining its bullish momentum above a well-respected ascending trendline that has been active since early April. After a strong breakout above the 2347 level, the price entered a consolidation phase between 2600 and 2800, suggesting that the market is preparing for its next significant move. As of now, ETH is trading near 2627 and forming higher lows, which is a positive sign of buyer strength.
The key support zones are located at 2347 and 2266, while resistance levels to watch are 2768 and 2834. As long as the price holds above the ascending trendline, the bullish structure remains intact. A bounce from the current region, especially near the trendline, may present a favorable long opportunity. In such a scenario, a breakout above 2768 could open the path toward 2834 and potentially higher levels in the medium term.
A suitable long setup would involve entering around the 2620–2640 zone with a stop loss below 2347 to protect against trend invalidation. The first profit target can be set at 2768, and the second at 2834. However, traders should remain cautious: if ETH breaks below the trendline with strong bearish volume, the bullish outlook would weaken, and the price may revisit lower supports. Until then, the market structure favors buying the dips in alignment with the prevailing uptrend.
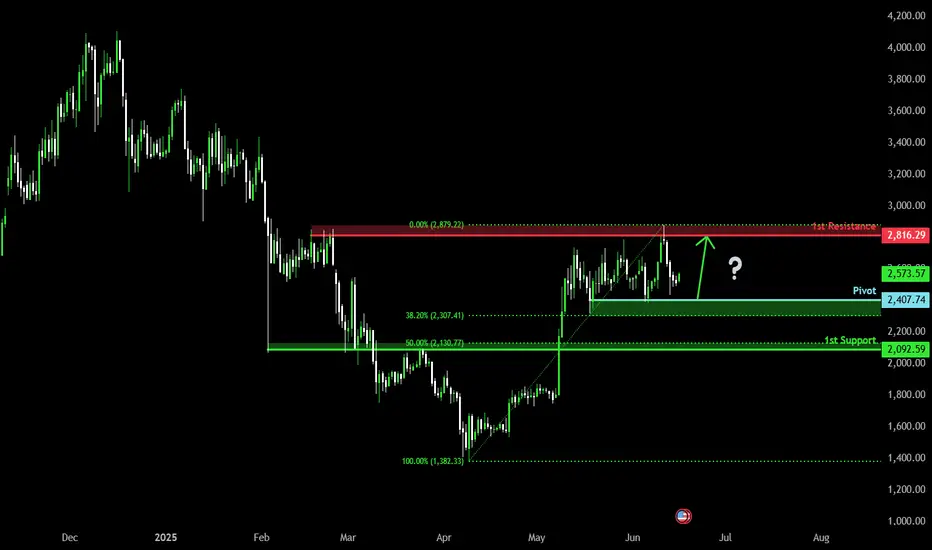
Bullish bounce off pullback support?The Ethereum (ETH/USD) is falling towards the pivot and could bounce to the 1st resistance.
Pivot: 2,407.74
1st Support: 2,092.59
1st Resistance: 2,816.29
Risk Warning:
Trading Forex and CFDs carries a high level of risk to your capital and you should only trade with money you can afford to lose. Trading Forex and CFDs may not be suitable for all investors, so please ensure that you fully understand the risks involved and seek independent advice if necessary.
Disclaimer:
The above opinions given constitute general market commentary, and do not constitute the opinion or advice of IC Markets or any form of personal or investment advice.
Any opinions, news, research, analyses, prices, other information, or links to third-party sites contained on this website are provided on an "as-is" basis, are intended only to be informative, is not an advice nor a recommendation, nor research, or a record of our trading prices, or an offer of, or solicitation for a transaction in any financial instrument and thus should not be treated as such. The information provided does not involve any specific investment objectives, financial situation and needs of any specific person who may receive it. Please be aware, that past performance is not a reliable indicator of future performance and/or results. Past Performance or Forward-looking scenarios based upon the reasonable beliefs of the third-party provider are not a guarantee of future performance. Actual results may differ materially from those anticipated in forward-looking or past performance statements. IC Markets makes no representation or warranty and assumes no liability as to the accuracy or completeness of the information provided, nor any loss arising from any investment based on a recommendation, forecast or any information supplied by any third-party.
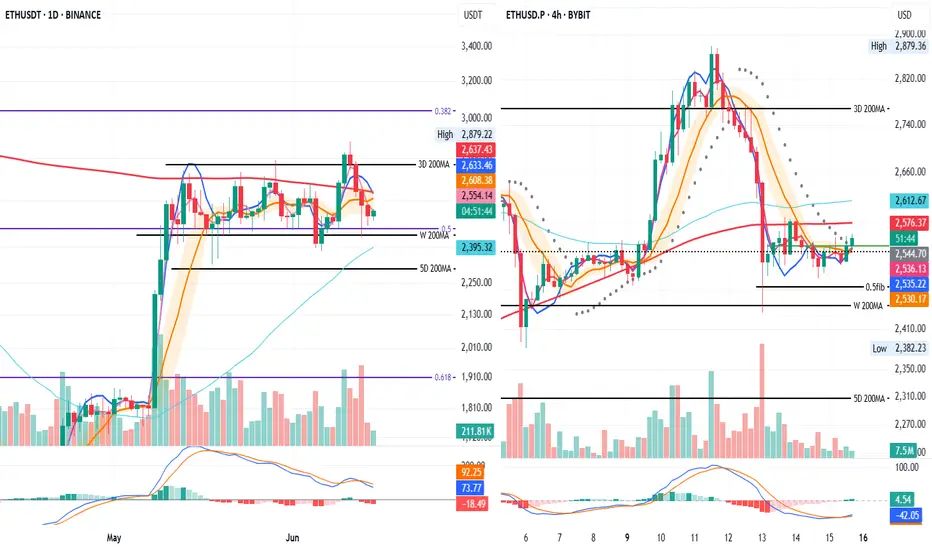
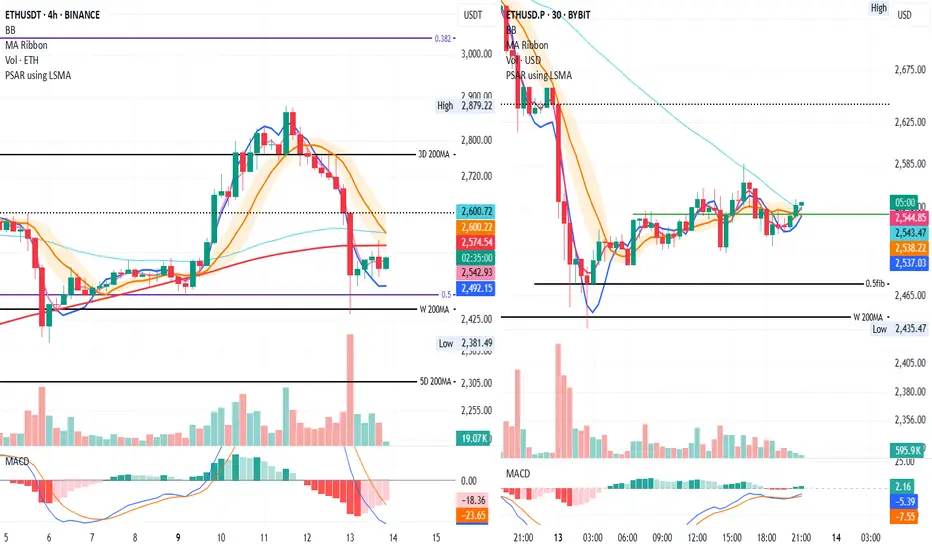
Daily vs 4H: Mixed Signals, Clear BounceOn both the 1D and 4H timeframes, price is still below the 200MA.
On the daily chart, it's also trading under the BB center line, the SMA, and the MLR.
However, on the 4H chart, price is now above the BB center line, SMA, and MLR — and it’s not far from triggering a long entry signal.
On the daily, we’ve seen a bounce from strong support: the 0.5 Fib level and the 200-week MA.
On the 4H, price looks ready to close above the last daily close — a promising sign.
Always take profits and manage risk.
Interaction is welcome.
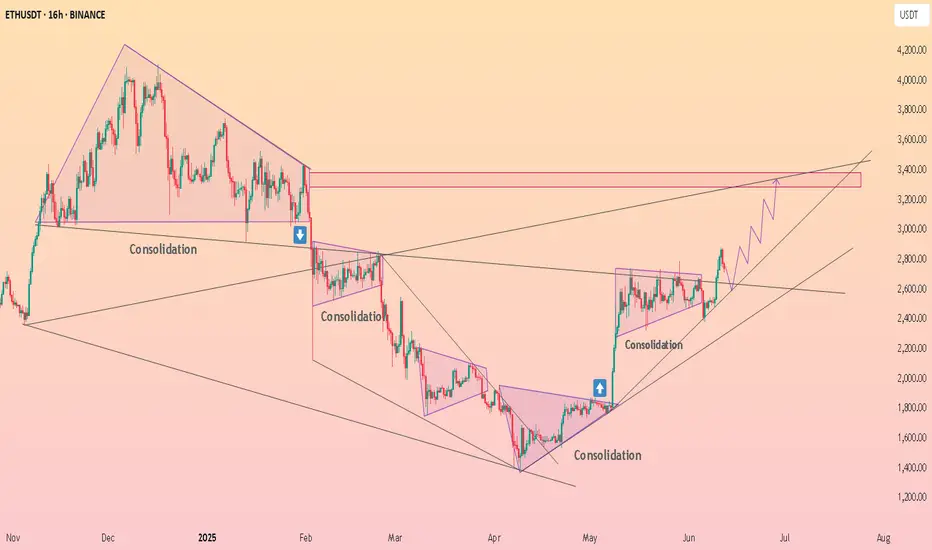
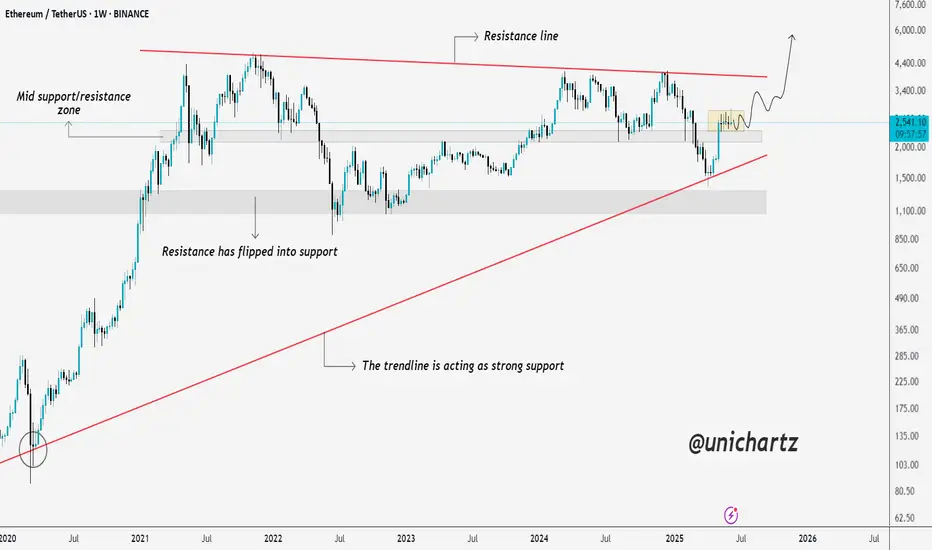
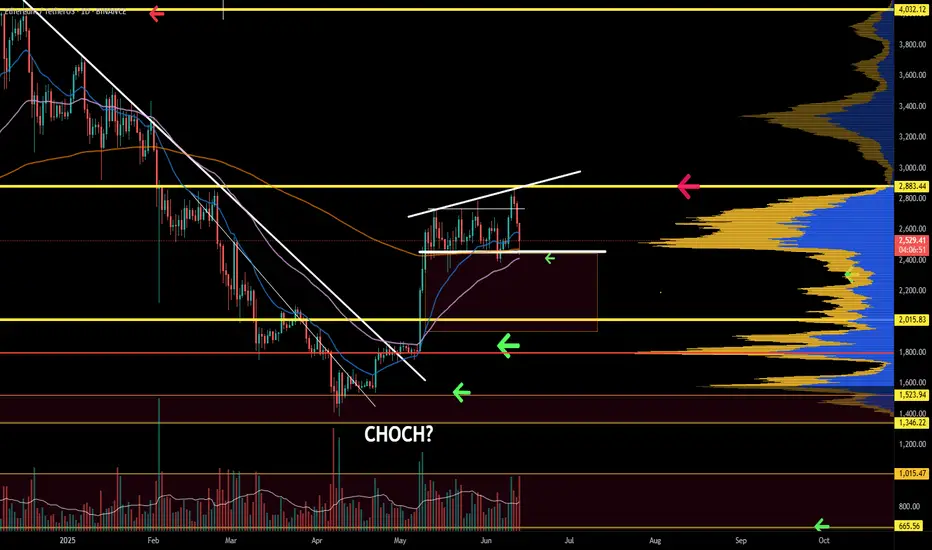
Ethereum Weekly Chart Shows Strength Above Key SupportEthereum is showing strong structure on the higher time frame. After rejecting lower levels, price has reclaimed the mid support/resistance zone, and is now consolidating just above it.
What’s key here is the long-term rising trendline, which has held beautifully since 2020 and once again acted as a springboard for the recent bounce. This kind of confluence — trendline + zone flip — adds weight to the current price structure.
If ETH maintains this zone, we could see accumulation continue, followed by a breakout toward the upper resistance line. For now, the chart leans bullish, but patience is key as consolidation plays out.
DYOR, NFA
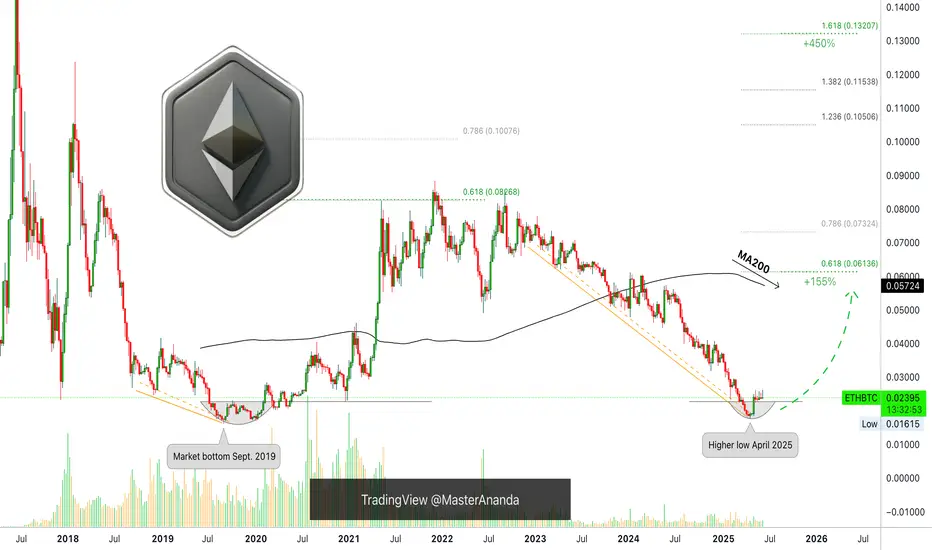
Ethereum vs Bitcoin 450% Growth Potential, Already ConfirmedEthereum is preparing a 155% rise vs Bitcoin, ETHBTC. The bottom is already in and this bullish wave confirmed. The 155% target is the minimum, "back to baseline," and it happens to match MA200 and the 0.618 Fib. extension level.
The main signal is a rounded bottom after a major multiple-years long downtrend. The same signal ETHBTC produced back in September 2019 but smaller in size.
The second signal is not specific to this pair only and relates to the cyclical nature of this market. Every four years, there is a bull market.
» ETHBTC produced a bull market in 2017.
» ETHBTC produced a bull market in 2021.
» ETHBTC will produce a bull market in 2025.
(Due to changing and evolving market conditions, the 2025 bull market can extend into early 2026. Just a possibility.)
This is true also for the small and medium cap. altcoins that are yet to grow. Strong projects such as Bitcoin and many big altcoins have been bullish for very long. These are on a league of their own. They cannot wait for the end of 2025 to produce a bull market because they have too much too strong demand and so they have been growing for years on end. The other part of the market, the neglected part, is about to go nuts. Extremely bullish in short.
This is a friendly reminder, load up and hold.
You will be happy with the results.
Prepare yourself to wait for months. On the safe side, 6-8 months. That would be minimum. The longer you are prepared to wait, the better it is for your mental state. There is no way to go wrong with Crypto unless you are doing leveraged trades. If you want to have certain profits, choose reputable projects through spot, and watch your money grow. Focused always on the long-term of course.
Namaste.
BRIEFING Week #24 : is Stagflation Coming next ?Here's your weekly update ! Brought to you each weekend with years of track-record history..
Don't forget to hit the like/follow button if you feel like this post deserves it ;)
That's the best way to support me and help pushing this content to other users.
Kindly,
Phil

Ethereum Weekly: Bullish & Bearish ExplainedEthereum has been sideways five weeks straight. Market conditions here are bullish and bearish short-term. Let me explain.
The market has bearish potential because of resistance. Ethereum has been facing resistance and fails to move forward for more than one month, but the bias isn't bearish, this is just a potential based on short-term price action.
The market has bullish potential because of a strong recovery after the 7-April low; because it trades above the August 2024 low and because there is very little retrace since the 5-May break of resistance in the form of EMA34 and MA200.
Ethereum is bullish because it trades above MA200 and remains above this level.
We are seeing bullish consolidation. There was an advance recently and after this advance the market went sideways. This means bullish.
While there can be a retrace short-term, market conditions remain bullish for this pair; ETHUSDT.
The bulls have the upper-hand and the majority of signals are bullish. Ethereum will continue to grow.
There is no scenario where Ethereum moves and closes weekly below its 3-Feb and 24-Feb lows ($2,075). It is simply consolidating before additional growth. It is going to go up, sooner rather than later.
Thanks a lot for your continued support.
Namaste.
Sell Bitcoin and buy Altcoins!🚨 Controversial Take Ahead – Packed With High-Value Insights 🚨
Let’s dive deep.
👨💻 A bit about me:
I’ve been riding the tech wave since the beginning:
Programmed video games in the 80s and 90s
Built VSTi plugins in the early 2000s
Started creating websites when Internet Explorer 1.0 launched
Sold 3D assets when Unity 2.5 (first PC version) dropped
Launched my own blockchain in 2016
Deployed smart contracts on TRON in 2018
I don’t follow trends—I predict them. My instincts are backed by decades of hands-on experience.
Now, here’s what I see coming:
⚠️ 1. Sell Your Bitcoins
Yes, Bitcoin is obsolete. It’s a technology—not a precious metal—and like all tech, it must evolve or die.
Ask yourself:
Do you use a Blackberry today?
Still flying in 1930s planes?
Gaming on an Atari or Commodore 64?
Surfing the web with Lycos or Altavista?
No? Then why are you betting on a 2009 technology?
Most people don’t even understand how Bitcoin works—ask around what SHA256 or RSA means.
Crypto is misunderstood, and that’s dangerous.
Back in 1998, I created the UPL library, which handled data compression & encryption using all major algorithms—Huffman, LZSS, DES, RSA, etc. I’m not just throwing words around—I’ve built this stuff.
Politicians and financial institutions (yes, even Saylor) are 15 years late to Bitcoin. They're missing the truth: BTC’s upgrades failed (Ordinals, Runes, etc). Its value holds due to FOMO from the uninformed, not innovation.
One day, your Bitcoins will be as worthless as mp3.com stock. That’s not opinion—that’s technological reality.
🪙 2. Buy Altcoins
Not every altcoin is a winner—but that’s where the real opportunity is.
Remember:
Nokia and Blackberry ruled before Samsung and Xiaomi.
The next Amazon, Google, or Nvidia already exists—and it's trading for pennies.
When people laugh at altcoins, that’s the time to buy low.
Altcoins like CRYPTOCAP:SOL , CRYPTOCAP:SUI , MIL:UNI could 100x… even 100,000x.
Bitcoin might double—and then crash.
Smart traders buy when everyone else is mocking.
🌍 3. Consequences of the BTC Collapse
This collapse will come at a turning point in global power.
Wall Street and U.S. states are heavily exposed to BTC. If it crashes, the Western financial system could implode—a dot-com-level disaster.
China, on the other hand, is stable, adaptive, and tech-forward.
Crypto without staking, DeFi, NFTs, GameFi, smart contracts? That’s not the future—that’s Bitcoin. Altcoins are the future.
Bookmark this post. Re-read it in 10 years.
You’ll remember I said it first: Innovation is unstoppable.
Enjoy the last Bitcoin pump. Then watch what comes next.
DYOR.
#CryptoRevolution #AltcoinSeason #BitcoinCollapse #Web3Future #BlockchainInnovation #SellBitcoin #BuyAltcoins #CryptoTruth #DeFi #GameFi #SmartContracts #CryptoShift #UnstoppableInnovation
Watching 4H and 30min Reaction
Price is now finding resistance on the 4H at the 200MA, and on the 30min at the 50MA.
On the 4H, the SMA has flattened, and the MLR is starting to flatten too—after price found support at the 0.5 Fib and weekly 200MA.
Buying volume is starting to pick up on both timeframes.
For stop-loss, I’m using push notifications instead of an open order.
Always take profits and manage risk.
Interaction is welcome.
ETH rang is being respected. ETH is holding strong within range. As long as the price stays in range, a bullish bias is supported. If the price breaks below, there is a volume gap sub 2k. Be ready with the plan.
Full TA: Link in the bio
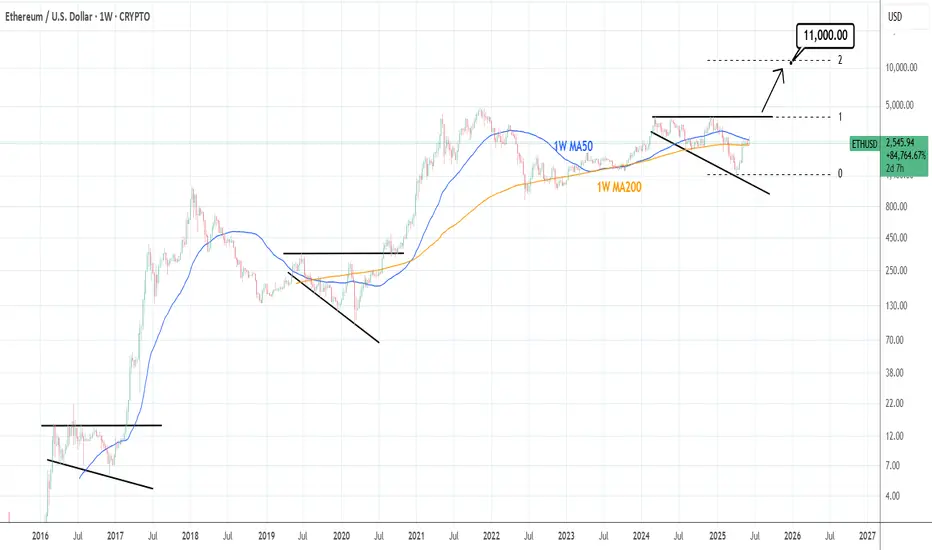
ETHUSD: This pattern always ends with massive rally.Ethereum has turned neutral on its 1D technical outlook (RSI = 50.794, MACD = 85.840, ADX = 26.701) as it's been compressed inside the 1W MA50 and 1W MA200 in the past month. The long term pattern here is a Megaphone - Broadening Wedge. Every Cycle formed one and historically once broken, it led to an enormous rally. We are still expecting the price to approach the top of this pattern on the medium term but if broken, you can aim for the 2.0 Fibonacci extension (TP = 11,000) if you want to pursue some risk.
## If you like our free content follow our profile to get more daily ideas. ##
## Comments and likes are greatly appreciated. ##
HolderStat┆ETHUSD above the consolidation zoneCRYPTOCAP:ETH
→ Basing above 2 400 while probing triangle apex
↳ Crack 2 550–2 600 for runway to 2 850–3 150
⇢ Trend guard sits at 2 650 → 2 500
⤴ Close < 2 650 drops Ether back into old range