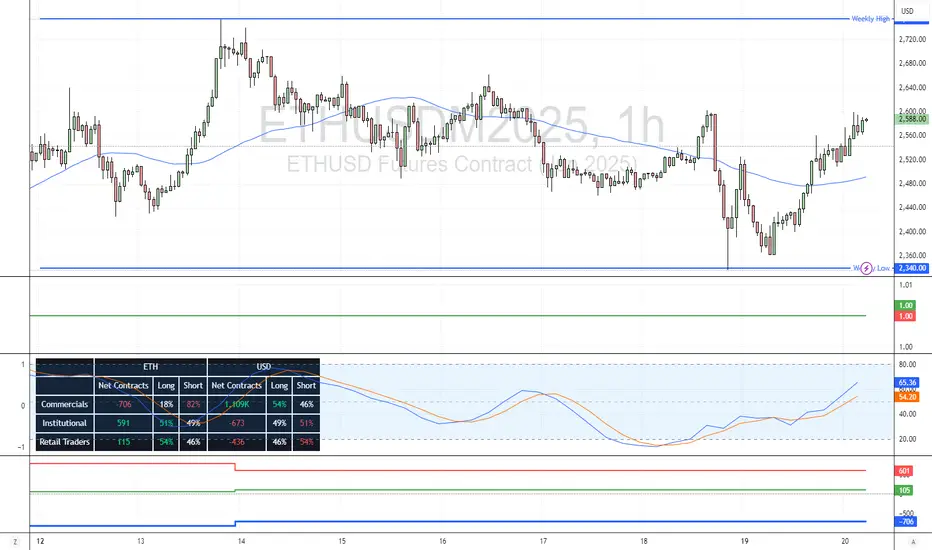
Ethereum is on Bullish TrackFenzoFx—Ethereum resumed its bullish trend after testing last week's low at 2,340. Price action and candlestick patterns support the current momentum.
The Stochastic Oscillator at 65.0 suggests the market is not overbought, indicating a likely continuation of the uptrend. The next bullish target is last week's high at 2,755.
Bearish Scenario : If ETHUSD falls and holds below 2,340.0, the downtrend from 2,755 may extend to 2,130.0.
Trade ETH/USD at F enzo F x
J-ETH
Binance Blinked! High level of USDC volume across Binance..Binance has for many years tried their own versions of buying US debt with USD made from selling a stablecoin of their own. This has been squashed nearly every time and has most likely hindered the flow on binance itself.
It seems binance may have blinked. USDC has been flooding into Binance this year maintaining often very high levels of relative volume. This flow is overall better than if neither party capitulated. Must be careful of different streams of volume fragmenting both bullish and bearish data. While USDT is seeing all time highs its market share is falling with the wider adoption of stablecoins on chain and in traditional finance.
All this is occuring as stablecoin regulation is being passed in the US tradingview.sweetlogin.com and Dimon says NYSE:JPM will be buying COINBASE:BTCUSD for clients soon

ETH pulling back will be an opportunity. ETH is showing some weakness after a strong rally. This is normal. Expect profit taking and re-accumulation at lower levels. Picking up bullish bits on dips is how ETH makes a higher high.
Full TA: Link in the BIO
Solana – Speculative Long Trade Setup Ahead of Narrative CatalysDespite BTC and ETH rallying, SOL has lagged, making it a potential rotation play as capital moves across majors. With attention building around the Internet Capital Markets narrative, SOL may soon attract speculative inflows, especially given its historical performance during sector-wide momentum shifts.
🔹 Entry Zone:
$152 – $154
🎯 Take Profit Targets:
🥇 $172 (local resistance / prior rejection zone)
🥈 $181 (next HTF resistance and possible momentum breakout zone)
🛑 Stop Loss:
$144 (invalidates current short-term bullish structure)

ETH + ALTSEASON | NEW All Time Highs Soon ??This would have been the first time that BTC made a new ATH during a bullish cycle, but ETH didn't - are we too hasty?
Very interesting to compare the two side by side and see that ETH has much more to gain than BTC:
The BTC new ATH update can be found here:
______________________
BINANCE:BTCUSDT BINANCE:ETHUSDT

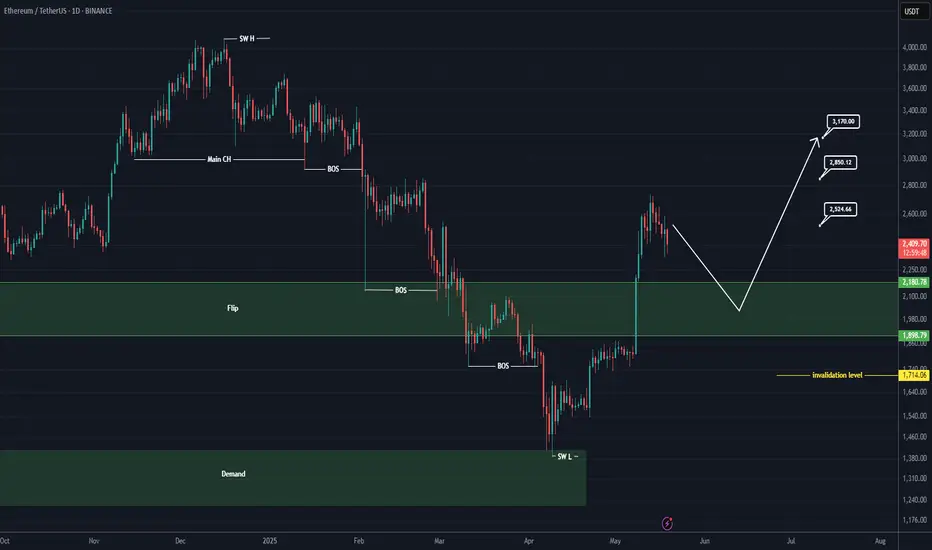
ETHEREUM New Update (1D)Ethereum has reclaimed the flip zone, but it hasn't tested this area or made a proper pullback yet.
It's expected that this zone will be tested before the price moves toward higher targets.
If we see a strong reaction around the green zone, we can look for potential buy/long positions.
A daily candle closing below the invalidation level would invalidate this analysis.
For risk management, please don't forget stop loss and capital management
When we reach the first target, save some profit and then change the stop to entry
Comment if you have any questions
Thank You
BRIEFING Week #20 : ETH Reversed, WTI Next ?!Here's your weekly update ! Brought to you each weekend with years of track-record history..
Don't forget to hit the like/follow button if you feel like this post deserves it ;)
That's the best way to support me and help pushing this content to other users.
Kindly,
Phil

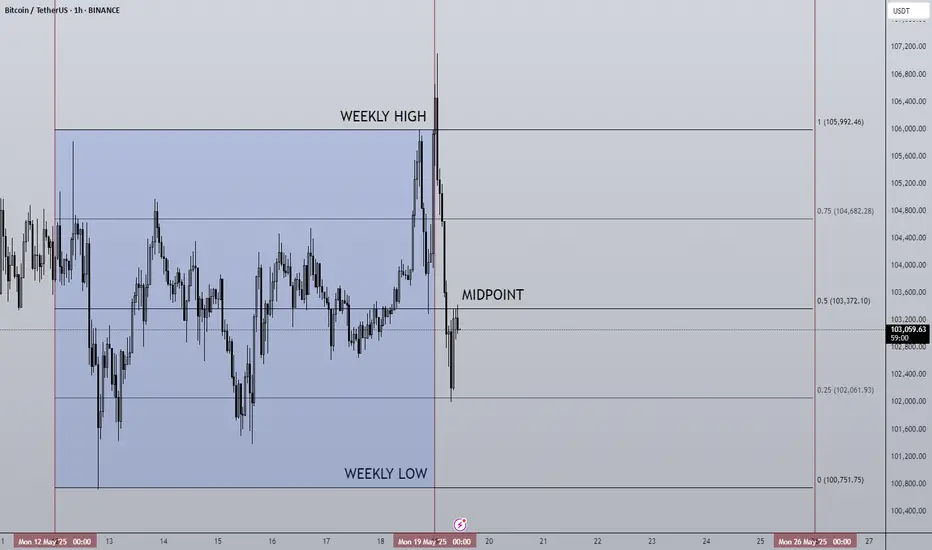
19/05/25 Weekly OutlookLast weeks high: $105,46
Last weeks low: $100,751.75
Midpoint: $103,372.10
In my weekly outlook post from last week I mentioned how there was a clear pattern of consolidation with a tight range for a week with a week of expansion that followed, and that if the pattern were to continue we would see BTC consolidate around the weekly high. The theory was proven correct on this occasion with a tight range between weekly high and the 0.75 line, as theorized with only momentary dips below the 0.75 line. Now if the pattern were to continue this week would be expansion week, but for me this time it's slightly different as BTC approaches ATH there is a massive level of resistance just above this weeks weekly high. We've seen an initial early attempt to breakout above weekly high and that attempt has so far failed quite aggressively, which leads me to believe there will be volatility this week as both bulls and bears contest this very important area of the chart.
For the bulls maintaining momentum and breaking into price discovery with acceptance above $109,000 would be incredibly, the headlines will read new ATH, FOMO kicks in and retail follows etc, we know the drill. For the bears the objective is to hold the line and reject weekly high ($106,000) at all costs and print a strong SFP and unfortunately this does seem viable with $97,000 being the target area IMO. RSI on the daily is around the overbought level, combined with key resistance level a pullback would make sense.
For me this week I want to see how ETH and other major alts react to any pullback, do they get bought up with purpose? Is the structure strong to maintain this move or is this a HTF lower high? An interesting week coming up I'm sure.
Good luck this week!
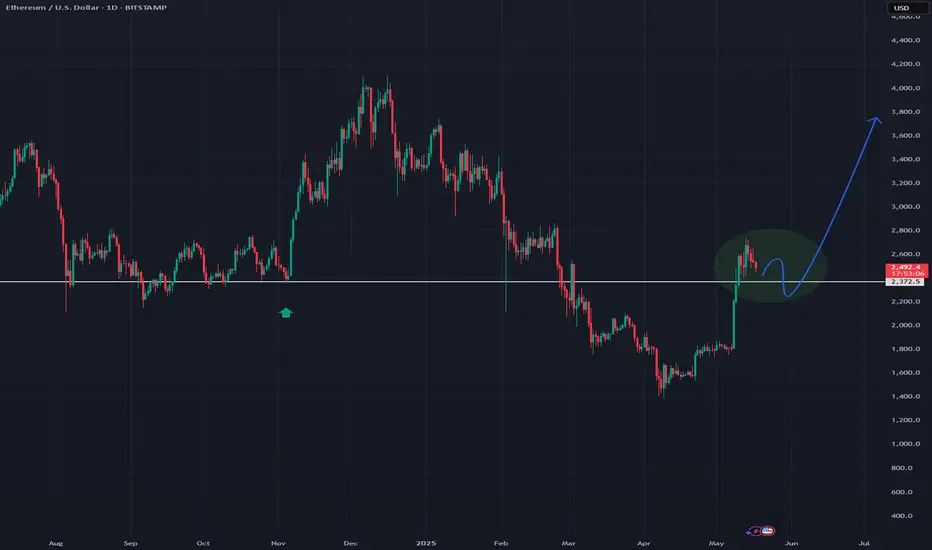
ethereum local peak + $10k or nothingethereum local peak + $10k or nothing
In the current cycle we are in, ethereum, which has not yet appreciated and has not made a real run, will close the correlation difference with bitcoin in the coming period and I think it will accompany a major run.
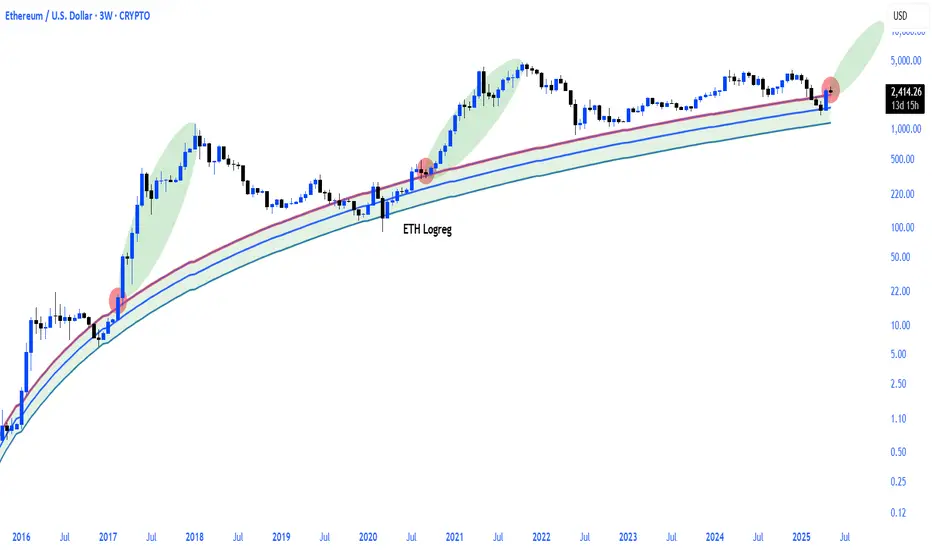
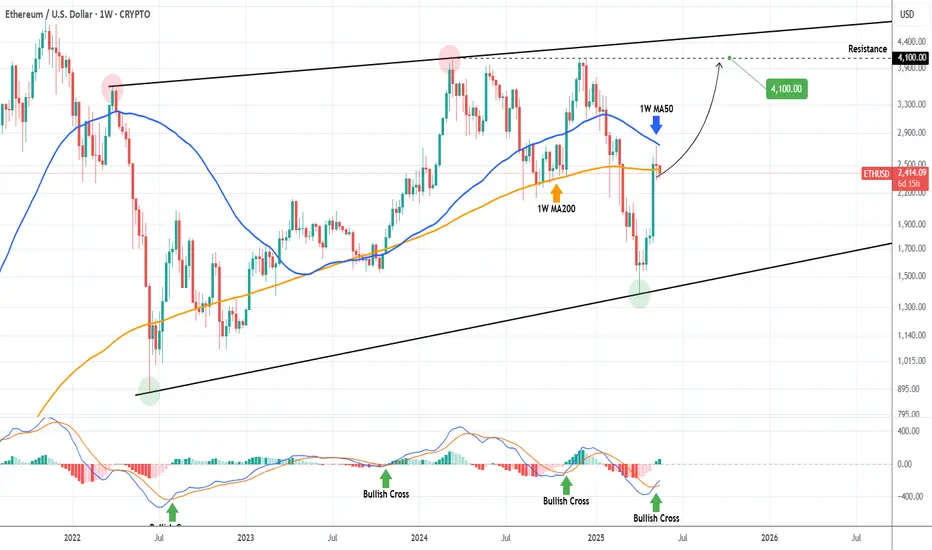
ETHEREUM Massive rejection on the 1W MA50. Will it break?Ethereum (ETHUSD) has seen its strongest 1-month rise in recent times since the April 07 rebound and last week that stopped and got rejected exactly on the 1W MA50 (blue trend-line). This rebound is technically the new Bullish Leg of the multi-year Rising Wedge.
The 1W MA50 turned into a Resistance when it last broke on the week of January 27 2025, so almost 4 months ago. Once it breaks and closes a 1W candle above it, we can continue to expect the bullish trend to continue by at least as much as the rise below it (that happened in late 2024).
Technically for now, if it breaks, the upside is limited by the 4100 Resistance, so that will be our Target in that event.
-------------------------------------------------------------------------------
** Please LIKE 👍, FOLLOW ✅, SHARE 🙌 and COMMENT ✍ if you enjoy this idea! Also share your ideas and charts in the comments section below! This is best way to keep it relevant, support us, keep the content here free and allow the idea to reach as many people as possible. **
-------------------------------------------------------------------------------
💸💸💸💸💸💸
👇 👇 👇 👇 👇 👇
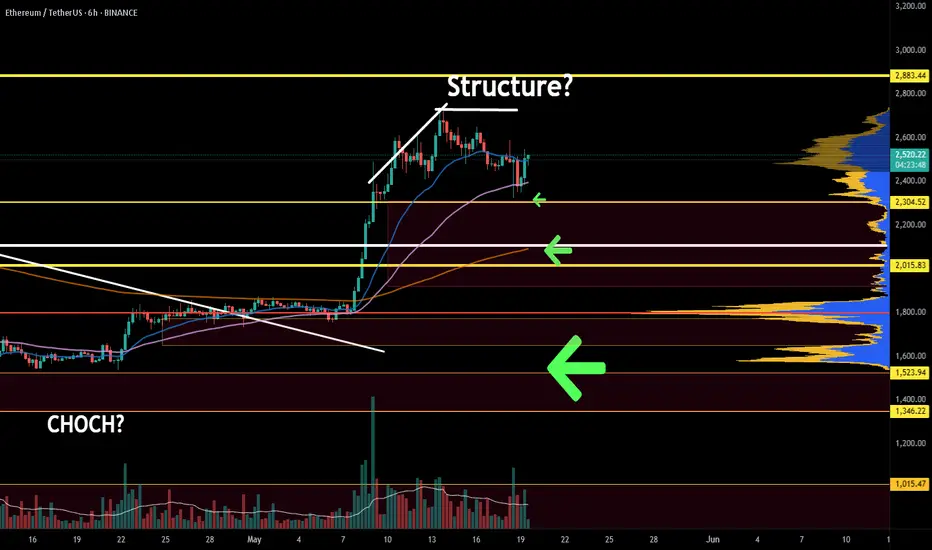
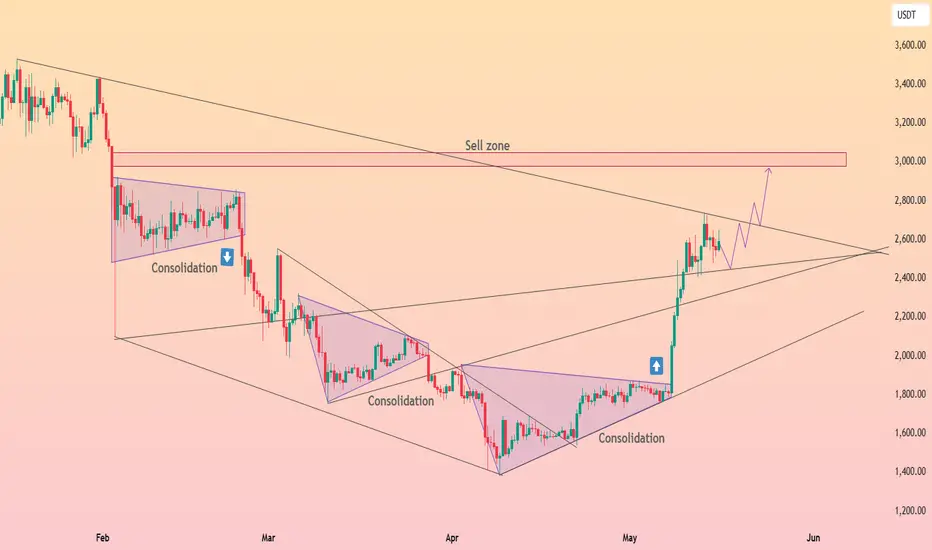
HolderStat┆ETHUSD wedge liftoff eyes 3 k sell zoneCRYPTOCAP:ETH blasted out of a multi-month falling wedge, erupting from 1.8 k to 2.7 k in one vertical burst. Price is now hovering above the broken wedge roof and an intersecting long-term trend line at roughly 2.55-2.60 k. If this freshly minted support holds, the pattern’s measured move directs attention to the 2.9-3.1 k sell zone in red. A dip under 2.45 k would simply delay, not negate, the bullish structure while the broader trend stays up-sloping.
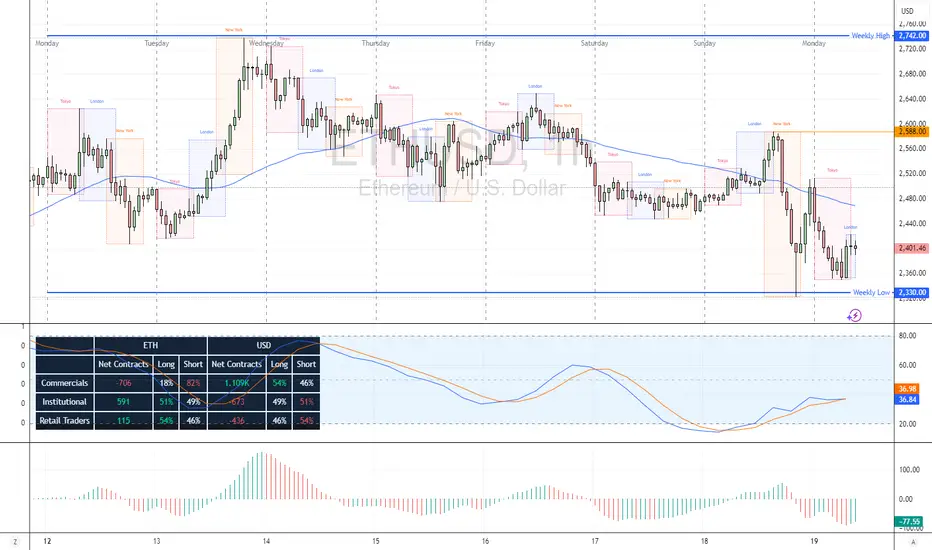
ETH/USD Technical AnalysisFenzoFx—Ethereum is retesting last week's low at 2,330 in today's session. A bullish candlestick pattern formed on Sunday after the price touched this support.
Ethereum is now trading around 2,400, showing strength in the London session. The outlook remains bullish above 2,330, with a potential target of 2,588, possibly during the New York session.
Bearish Scenario : A drop below 2,330 would invalidate the bullish view, likely resuming the downtrend toward 2,200.
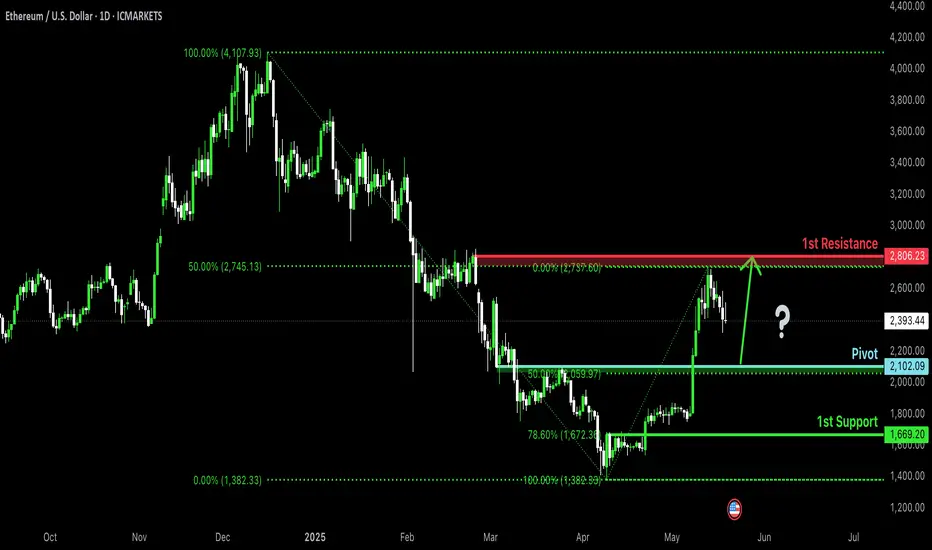
Falling towards 50% Fibonacci support?Ethereum (ETH/USD) is falling towards the pivot and could bounce to the 1st resistance.
Pivot: 2,102.09
1st Support: 1,669.20
1st Resistance: 2,806.23
Risk Warning:
Trading Forex and CFDs carries a high level of risk to your capital and you should only trade with money you can afford to lose. Trading Forex and CFDs may not be suitable for all investors, so please ensure that you fully understand the risks involved and seek independent advice if necessary.
Disclaimer:
The above opinions given constitute general market commentary, and do not constitute the opinion or advice of IC Markets or any form of personal or investment advice.
Any opinions, news, research, analyses, prices, other information, or links to third-party sites contained on this website are provided on an "as-is" basis, are intended only to be informative, is not an advice nor a recommendation, nor research, or a record of our trading prices, or an offer of, or solicitation for a transaction in any financial instrument and thus should not be treated as such. The information provided does not involve any specific investment objectives, financial situation and needs of any specific person who may receive it. Please be aware, that past performance is not a reliable indicator of future performance and/or results. Past Performance or Forward-looking scenarios based upon the reasonable beliefs of the third-party provider are not a guarantee of future performance. Actual results may differ materially from those anticipated in forward-looking or past performance statements. IC Markets makes no representation or warranty and assumes no liability as to the accuracy or completeness of the information provided, nor any loss arising from any investment based on a recommendation, forecast or any information supplied by any third-party.
$SPY Daily Chart Taz Plan - May 2025 into June-July Breakdown📉 SPY Daily Chart Trading Plan — May 2025
Thesis:
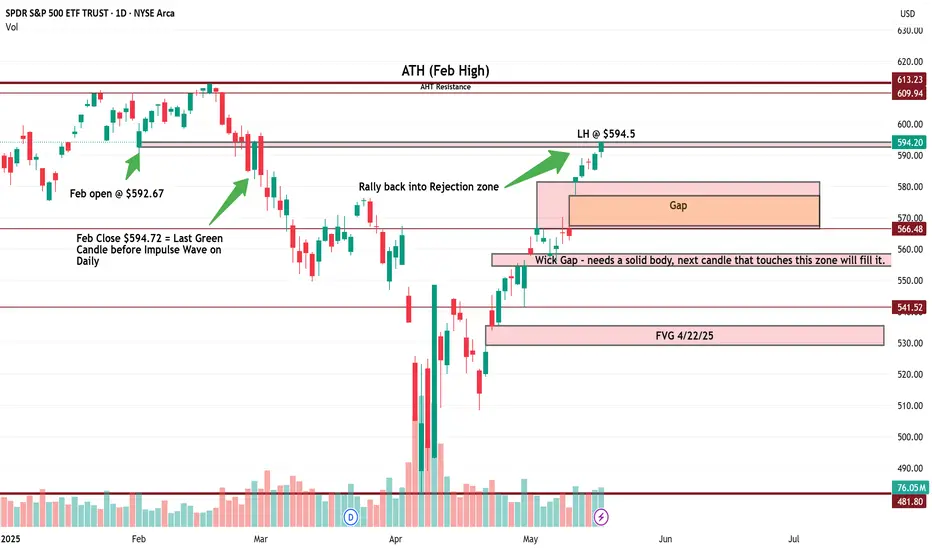
Price has returned to the exact level ($594.20) where the February impulse breakdown began. This zone is acting as a Lower High rejection within a broader bearish structure. A clean rejection here opens the door to multiple inefficiency fills below.
🔍 Structure Breakdown:
Feb High (ATH): $613.23
Feb Open: $592.67
Feb Close (last green candle before impulse): $594.20
Current Price: $594.20
Marked LH: $592.50
This is a rally back into rejection, not strength.
📉 Key Zones & Gaps:
🔺 Gap Supply: $566.48 – $578.50
🔺 Wick Gap: $558 – $566 → Needs a full-body candle to initiate fill
🟥 FVG (4/22): $528 – $541.52
🧱 Major Support: $481.80
🧠 Trade Plan:
Short Entry 1 (Confirmation-Based):
🔻 Red candle rejection under $592.50 = starter short
🔻 Watch RSI and MACD for momentum fade
Short Entry 2 (Gap Breach):
🔻 If $578 is broken and retested → scale in
🔻 Gap fill expected quickly once triggered
Short Entry 3 (Wick Gap):
🔻 Body close through $558 = last add
🔻 Sets up for final flush to FVG
🎯 Targets:
$578.50 → $566.48 (Gap Fill)
$558 → $541.52 (Wick Gap & FVG Top)
$528 – $530 (FVG Close)
$481.80 (Long-Term Panic Target)
❌ Invalidation:
Daily close > $595.50 = Pause thesis
Weekly close > $600 = Structural shift, short squeeze zone
🧠 Final Thoughts:
This isn’t just a gap fill play — it’s a structural fade from a lower high back into memory. The Feb impulse wave left behind layers of inefficiency, and price just tapped the origin of the breakdown.
Momentum is peaking. If this is a trap, the downside should begin immediately.
Let the chart prove it.
Ethereum: The Bullish Cycle Starts Now!The minimum new 2025 All-Time High for Ethereum is $5,794. The next target sits at ~$8,500.
Ethereum took some time out and used this week to challenge resistance. Resistance was found at 0.5 Fib extension with exactitude, that is, $2,746.
Two supports mainly: 1) $2,424 and 2) $2,026.
The bottom is in and it is really far away. The $2,026 is the 0.236 Fib extension and also the baseline of the rounded bottom pattern.
The correction low sits at $1,383 and Ethereum (ETHUSD) will never ever in its entire history trade at this price ever again. It is gone forever. Right now it is still relatively early but this will be more obvious as the month reaches its end.
Good evening my fellow Cryptocurrency trader, I hope you are having a nice Sunday and the week is about to close.
Ethereum is still early, early in its trading session based on the long-term bullish cycle, and I say this based on market data and the chart. Not my speculative opinion.
This is the biggest exchange in the list, it comes up first.
Exchanges are listed by volume when you look up a pair here on TradingView.
It turns out that trading volume is still low but prices are going up. This is what tells me that it is still early, wave 1. When the action gets going and bullish momentum grows, volume will reach its highest; wave 3. Then the action will continue and will go crazy but volume won't keep up; wave 5.
I say the minimum is $5,794 and this is an easy target. Can go higher, much higher but 5.8K is an easy bet.
Go LONG hold spot trade options do what it takes.
Buy the funds, the ETFs, the actual coins holding or staking it doesn't matter as long as you participate. Even with stablecoins through DYDX or whatever way you prefer. As long as you participate in this awesome market the market will reward you.
Thank you for reading.
Namaste.

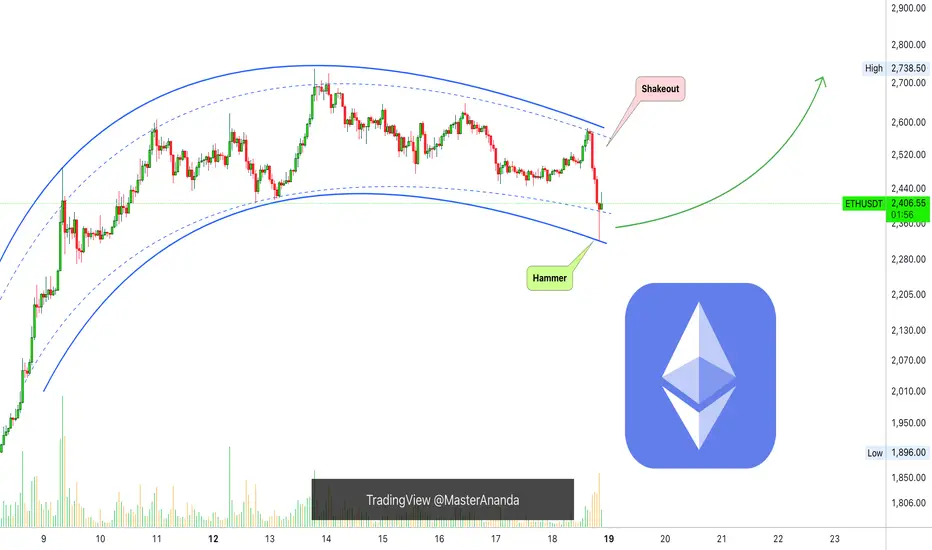
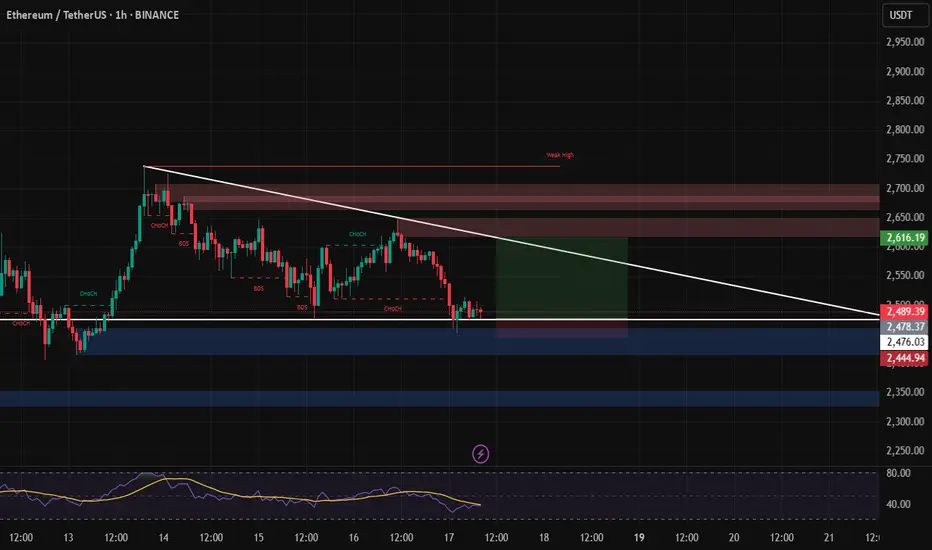
Ethereum Short-Term, Bullish Or Bearish?Notice this recent shakeout on the chart, this is a major move and surely removes lots of over leveraged positions. It also traps the bears, a bear-trap.
If this move continued lower it would be bad news but the 1H candle ended with a long lower wick, producing a hammer which is a reversal signal. This candle produced the lowest price since 9-May, 9 days ago, and the current candle is green, this tells us that a shakeout is confirmed.
The bearish move is a failed signal so the next move is up. With a very small bullish continuation, the current candle closing at current price or higher, it is confirmed ETHUSDT to continue rising.
(If the current candle were to close red and lower this would be a bearish confirmation.)
Short-term bullish structure intact. It is normal to see the market shaking before a major move. Remember, Bitcoin is about to close its 6th consecutive week green, the most bullish development of the decade. This affects Ethereum of course and the entire Cryptocurrency market.
Namaste.
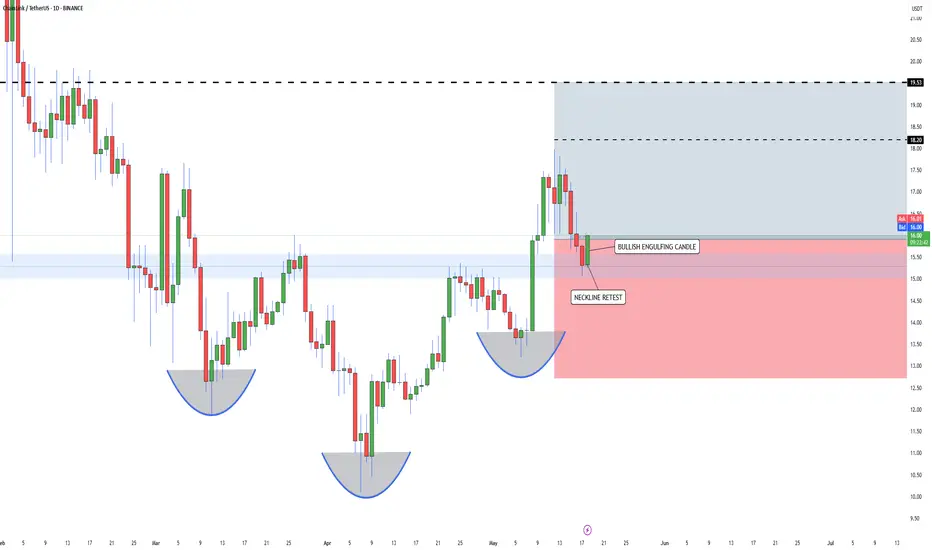
LINK/USDT - Long trade LINK / USDT Update 🔔
I couldn’t be more bullish on the LINK trade we’re holding right now.
We’ve got a textbook inverse head and shoulders playing out... neckline broken, perfect retest, and now a bullish engulfing candle confirming the move. Structure couldn’t be cleaner. This is exactly what you want to see after a breakout. Now could be a good idea to add to your position size on the LINK trade.
Holding strong here with eyes on the $18.20 and $19.53 short term targets. As long as price holds above the neckline zone, this setup remains high-conviction.
Big upside potential from here. Let’s ride it. 🔥
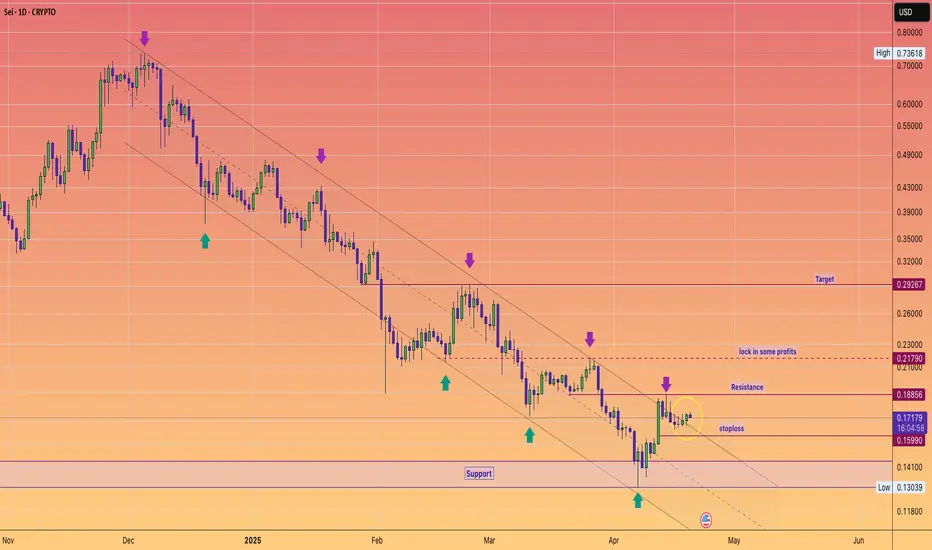
SEI breaks the downtrend targets 30cThe SEI network is currently displaying positive price movement after recently breaking out of a downward trend channel that had been in place since the peak on December 5th. On the daily chart, it has been trading sideways within the upper channel, indicating a potential retest of that breakout. However, the momentum isn't particularly strong, especially since Ethereum, the frontrunner in the altcoin resurgence, isn't exhibiting explosive upward movement either.
Should the situation shift and Ethereum regain its leading position, I believe that many struggling smart contract platforms, which have seen their prices plummet by over 80%, could also experience a robust recovery.
If Ethereum manages to climb back into the $2,000+ range, I anticipate that SEI will reach its target on the chart, which is approximately 30 cents.
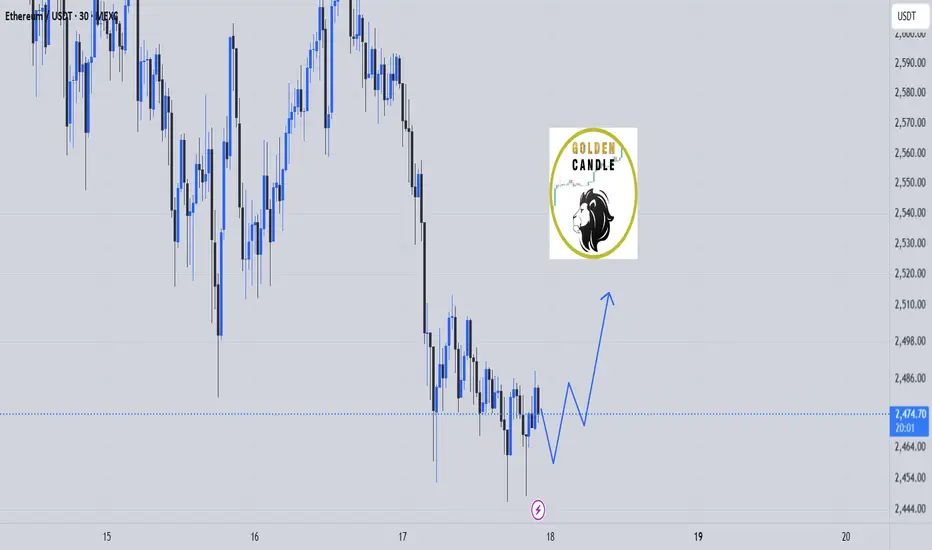
eth buy midterm"🌟 Welcome to Golden Candle! 🌟
We're a team of 📈 passionate traders 📉 who love sharing our 🔍 technical analysis insights 🔎 with the TradingView community. 🌎
Our goal is to provide 💡 valuable perspectives 💡 on market trends and patterns, but 🚫 please note that our analyses are not intended as buy or sell recommendations. 🚫
Instead, they reflect our own 💭 personal attitudes and thoughts. 💭
Follow along and 📚 learn 📚 from our analyses! 📊💡"
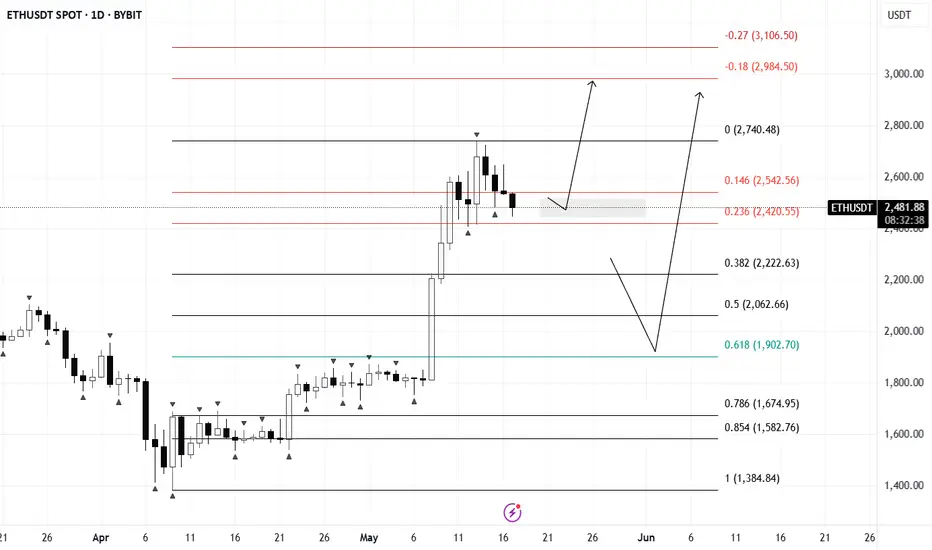
ETH/USDTAlt Market on Watch — All Eyes on ETH ⚠️
Despite a strong start to the week, some red flags are starting to show up on the horizon.
The spotlight is on ETH — it’s the key to what’s next for the altcoin market.
In the last update, I shared altcoin levels to work from,
but right now ETH should be your primary reference.
📍 $2400 is a major zone — I’m watching for a reaction there to get aggressive on alt entries.
❌ If that zone doesn’t hold, we’re likely heading down to $2200–2100, possibly even $1900.
No need to overexpose — I’m sitting mostly in cash, waiting for clear signals.
🚫 And most importantly — this is not a short setup (yet).
Let’s wait for the new weekly open before making any big moves.
$ETH quick longWe have in a demand zone while we are on a weekend, so I expect a push to test the trendline
Targets in chart.
ETHUSD - Support Line Reestablished A major support line has been recovered on this ETH daily chart
One that previously led to a strong breakout
From here price will find support on this line and then pop off again
Good time to buy ETHUSD
Daily chart
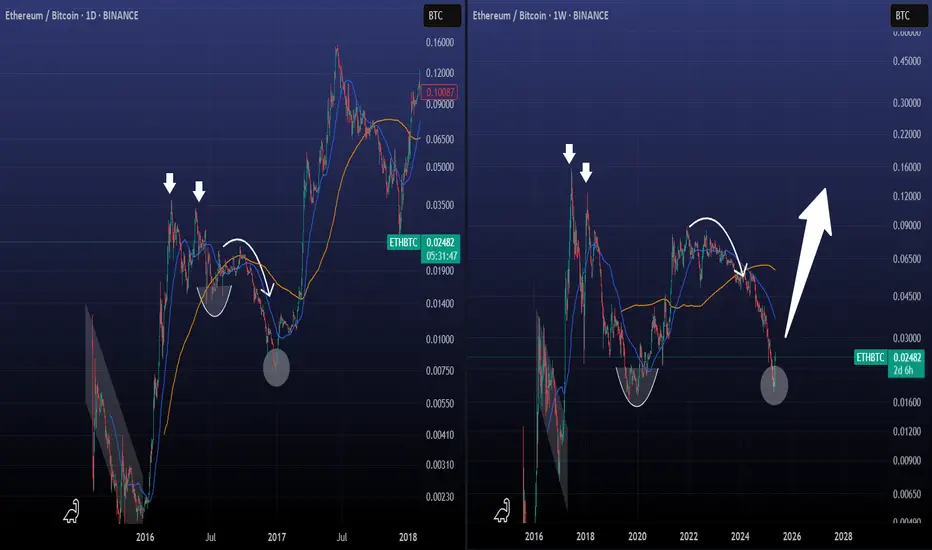
ETHBTC Is it repeating its first Cycle?I know that the timeframes are not the same but don't tell me that the structure between then and now isn't similar.
The biggest difference is that in 2016 ETHBTC made a deeper low than now, but the current rebound is showing signs that we might have a similar parabolic rise.
Now will that be enough to give a new All Time High?
We will see, but don't tell me that this can't target 0.0900 byu the end of the year.
Follow us, like the idea and leave a comment below!!