Ethereum Mid Week Update - Swing Long Idea📈 Market Context:
ETH remains in a healthy bullish structure. Despite the recent retracement, price action is still supported by strong demand zones on higher timeframes. No change in the overall sentiment from earlier this week.
🧾 Weekly Recap:
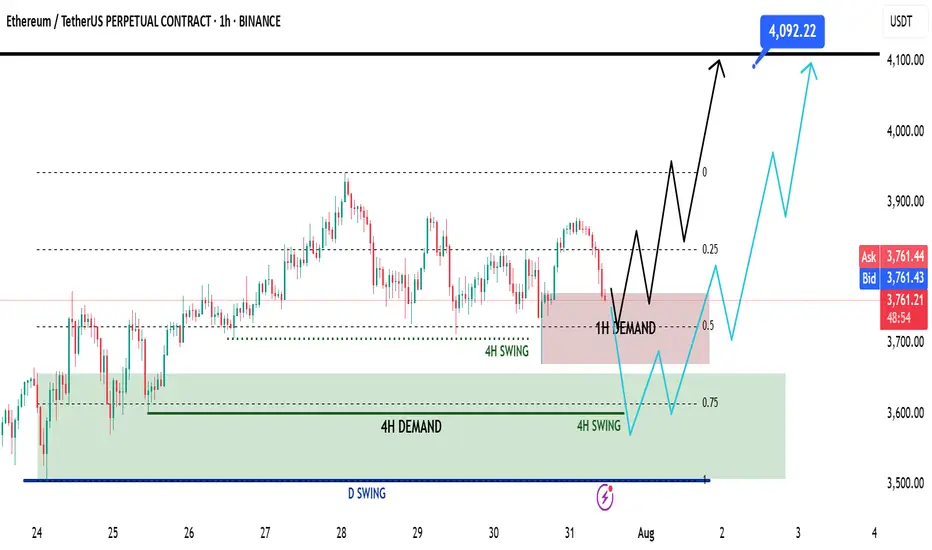
• Price rejected from the Fibonacci 0.5 EQ level — a discounted zone in my model.
• While doing so, it also ran 4H swing liquidity.
• After taking liquidity, ETH formed a 1H demand zone — a sign to look for lower timeframe confirmations for long setups.
📌 Technical Outlook:
→ Price has already tapped into the 1H demand zone.
→ From here, we have two possible scenarios:
Black scenario (ideal):
• Wait for 15M bullish break of structure (BOS).
• Enter after confirmation for long setups from 1H demand.
Blue scenario (deeper retrace):
• If no bounce from 1H demand, expect price to dip toward 0.75 Fib level (max discount).
• Watch for another liquidity run & 1H–4H demand formation.
🎯 Setup Trigger:
✅ 15M bullish BOS inside 1H or 4H demand zones
→ This would be the entry confirmation trigger for longs.
📋 Trade Management:
• Stoploss: Below the swing low of the 15M BOS
• Target: 4090$
💬 Like, follow, and drop a comment if this outlook helped — and stay tuned for more setups each week!
J-ETH
ETH Holding Steady in the Noise
ETH on the 4H
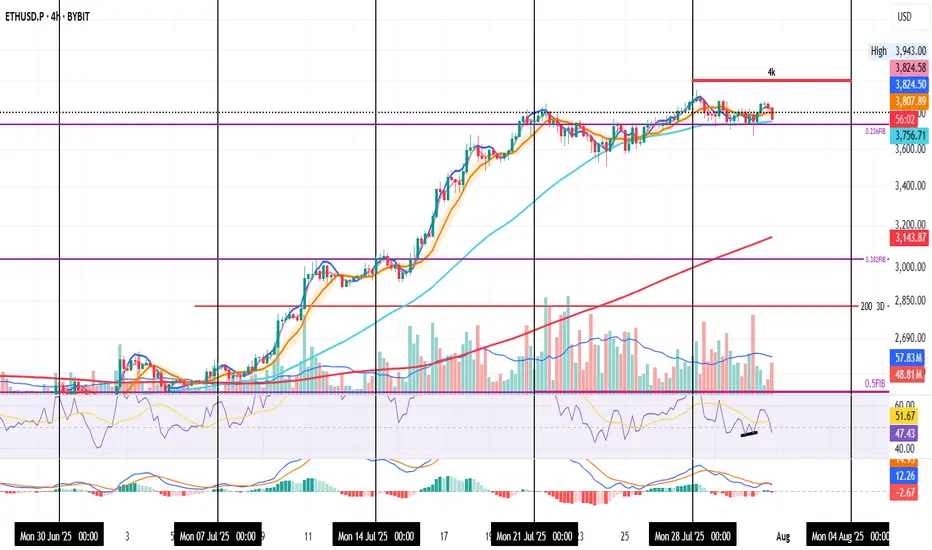
Price is pulling back again — mostly due to sticky inflation.
Even though YoY CPI came in at 2.8% (vs 2.7% expected), MoM data was on target, so the market may just be pricing in “higher for longer.”
Back to the chart — not much has changed.
ETH is still holding above both the 0.236 Fib and the 50MA.
The next real resistance is around $4,000.
Personally, I’d rather see price consolidate and gear up for a clean breakout than rush into it and get rejected.
Right now, it feels like ETH is waiting for direction.
It had a reason to drop — and didn’t.
It had a reason to fly — and paused.
Could be prepping for a boring chop before a sudden move.
I'm still bullish overall. Holding a long.
If it moves against me, I’ll scale out.
If it breaks higher, I’ll scale in.
Always take profits and manage risk.
Interaction is welcome.
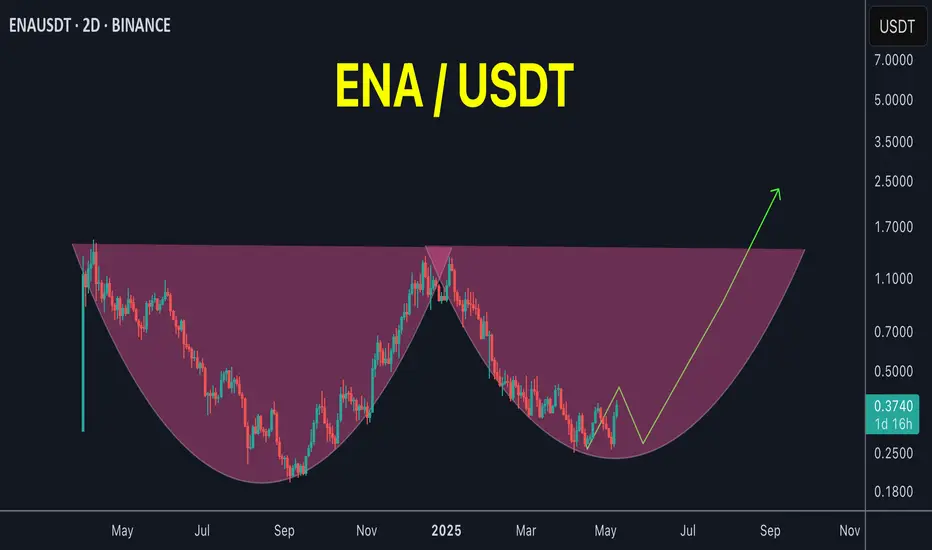
ENA / USDT#ENA / USDT
Iam expecting big returns from ETH and its related coins in this season
This chart is also looking good
Another Potential round bottom pattern under formation
Keep an eye
ETHUSDT - SCalp your day!Small scalps, extreme targets on yellow mid targets on the green, Keep in mind that a temp spike can happen for a fall, to a great extent, maybe?

ETH: Buyers Show Their HandETH on the 4H
The Fed noise is gone, now it’s just pure market intent.
Price wicked below the 0.236 Fib, but buyers stepped in fast, showing strength at that level.
A small bullish divergence is forming on the RSI. If ETH holds above the Fib, that signal could gain momentum.
Always take profits and manage risk.
Interaction is welcome.

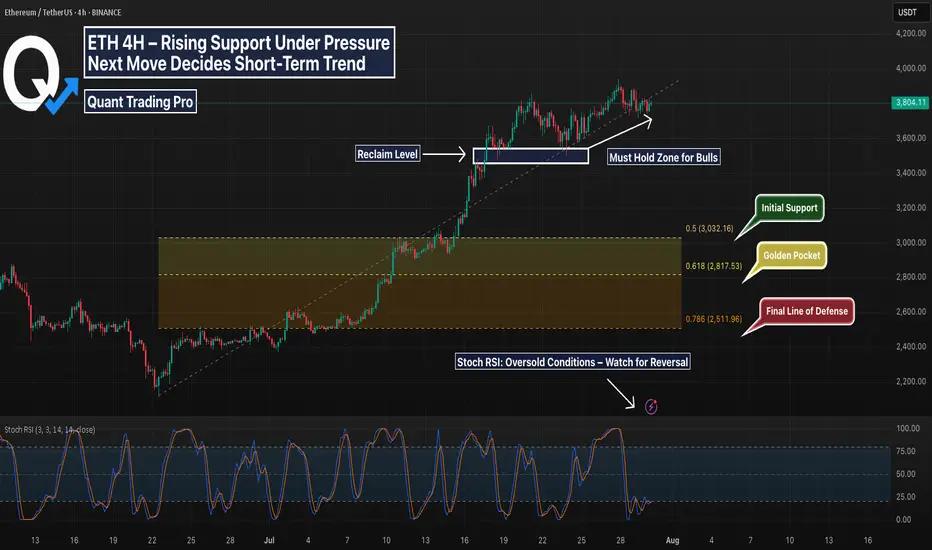
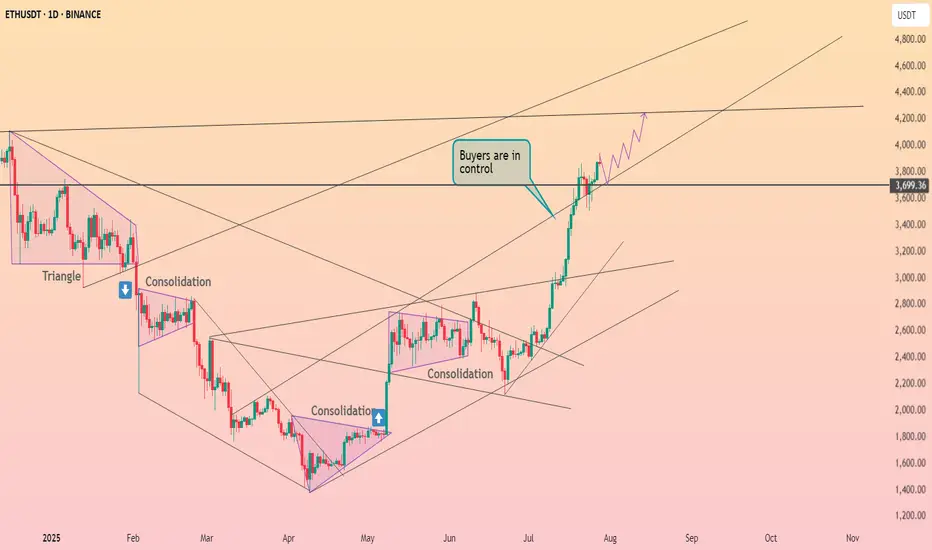
ETH 4H – Trendline Test or Trap? Golden Pocket BelowEthereum’s 4H chart shows price compressing against rising trendline support after a strong impulse move in July. While bulls have defended the key reclaim zone (white box) multiple times, momentum is fading and structure is at risk.
Price is now coiling just above the diagonal trendline — a decisive bounce here could spark continuation. However, a breakdown opens the door to deeper retracements.
Key Fib retracement levels below:
0.5 at $3,032 – Initial reaction zone
0.618 (Golden Pocket) at $2,817 – High confluence support
0.786 at $2,511 – Extreme retracement target
The Stoch RSI is deeply oversold, suggesting a bounce may be near — but confirmation is needed.
📊 Things to watch:
Reaction at trendline support
Sweep of reclaim zone followed by reclaim
Golden Pocket retest with bullish divergence
If support holds, this could be a textbook higher low. If not, expect liquidity hunts toward the fib zones. Stay nimble.
Perfect candidate for a strategy backtest or reactive plan using alerts and confirmation tools.
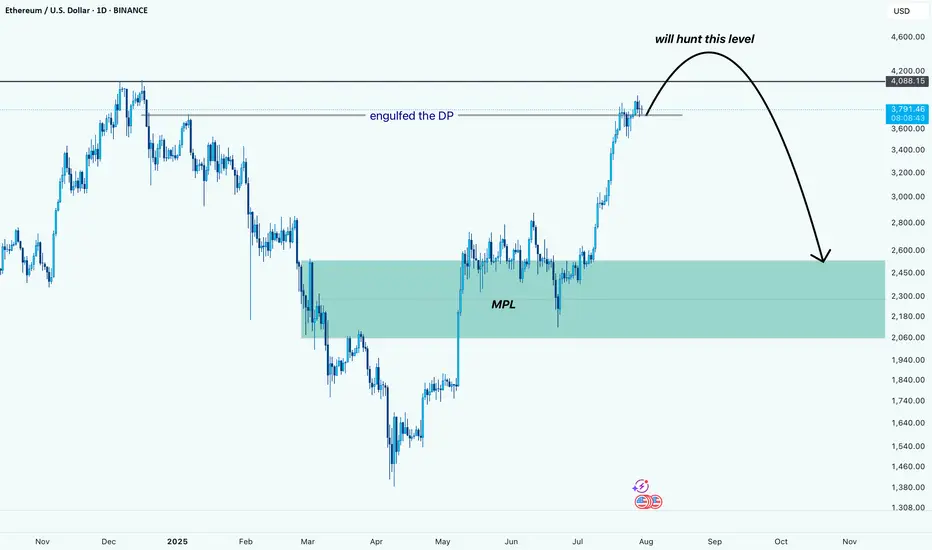
ETH (just a perspective): Potential Liquidity Grab Before DeeperPrice has engulfed the DP and is now pushing higher. Based on the current structure, it looks like ETH wants to hunt the liquidity resting above the $4,080 level.
After grabbing that liquidity, we might see a sharp reversal back down toward the MPL, which sits in the $2,100–$2,500 zone. This area is a strong demand zone and also where the most pain would be felt for late buyers, making it a key level to watch.
⚠️ This is not a prediction, just a perspective based on price behavior and structure.
Ethereum Above $4,000 Bullish Signal RevealsNo major drops and low volatility is a major bullish signal. Ether is bullish now with all sellers gone. Look at the down wave from December 2024 and see what three days red would do to Ethereum's price. Today we are on the third red day and ETH is hardly a few dollars below the most recent peak. A signal of strength. This strength also means that we are likely to see a continuation of the bullish move soon, Ether will continue growing.
Good morning my fellow Cryptocurrency trader, I hope you are having a wonderful day.
Everything seems calm now, a small pause... Sell at resistance, buy at support; right?
Well, not always. It depends on the context.
Here we have a rising trend and Ethereum has been advancing nicely. Now we reach resistance, is this the time to go SHORT? It is possible to SHORT at resistance and do good but here we have a very clear uptrend. When ETHUSDT peaked 28-July there wasn't much selling. This is telling us that the bullish move is not over, not complete.
Ethereum will produce additional growth. Seeing this, it would be unwise to sell SHORT. If prices drop, it is better to wait for support and go LONG. Trade with the trend, it reduces risk and increases your chances for success.
Namaste.
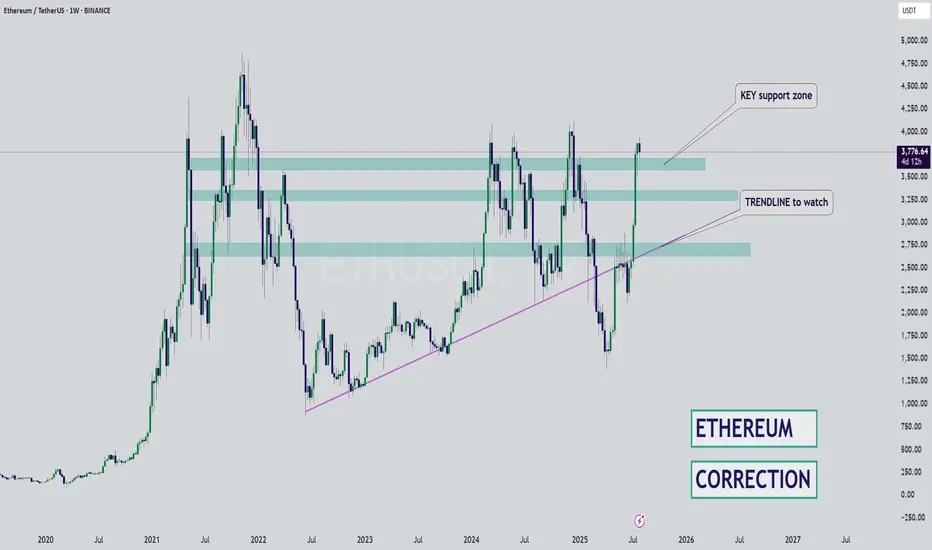
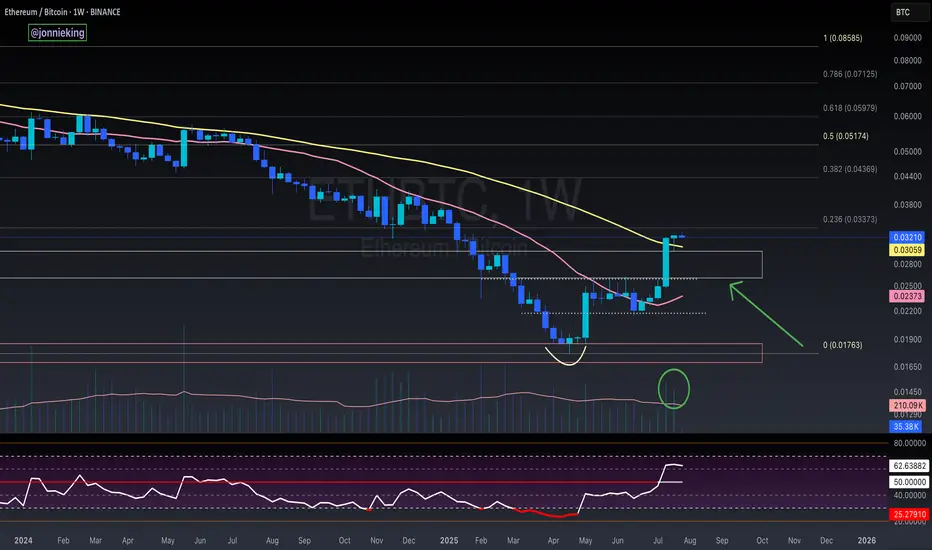
ETH - Bounce Zones - Nears the End for BULLSHello Fello's ☕
I'm watching Ethereum today and I believe it may be very close to the end of it's bullish cycle.
I think what could become likely is an extended altseason, where Bitcoin trades around the same price for some time, and Ethereum increases slightly. Afterwhich smaller altcoins (by marketcap) make random rallies before the beginning of a bearish cycle (which is due, see my previous BTC update).
There's an interesting channel here that previously determined bounce zones... I don't believe the channel itself will hold as much value going down, but this zone may be a likely bounce zone - around $3k.
Key bounce zones to watch include:
I'm not saying it will be this straightforward, but this image demonstrates the power of bounce zones for swing trades:
Next update will be when we've lost the first support zone.
Until then!
Ethereum destroyed resistance at the $3700 level ┆ HolderStatBINANCE:ETHUSDT remains stuck between $3,260 and $3,320, forming a tightening range with bullish undercurrents. Price is holding a higher low and consolidating under resistance, hinting at re-accumulation. A breakout above $3,325 could send ETH toward $3,400+ in short order. Bulls remain in control above $3,260.
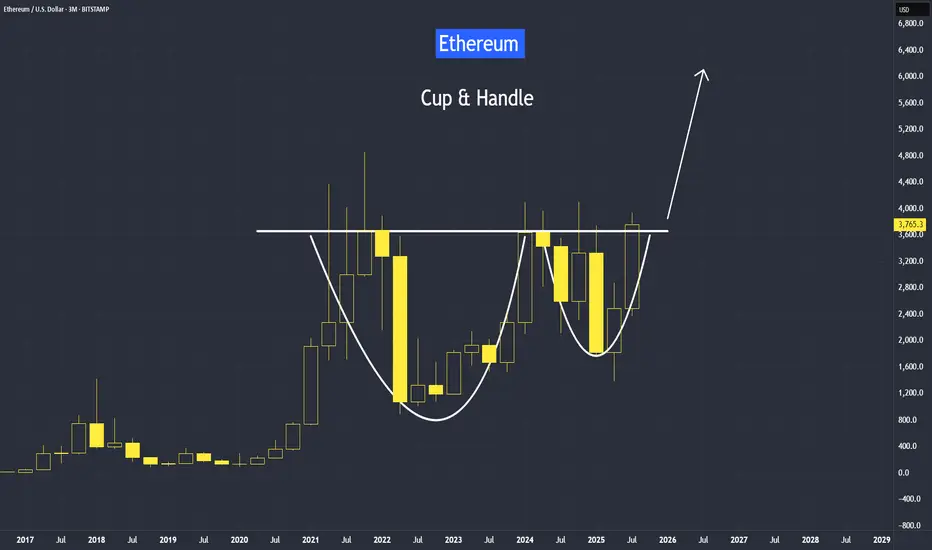
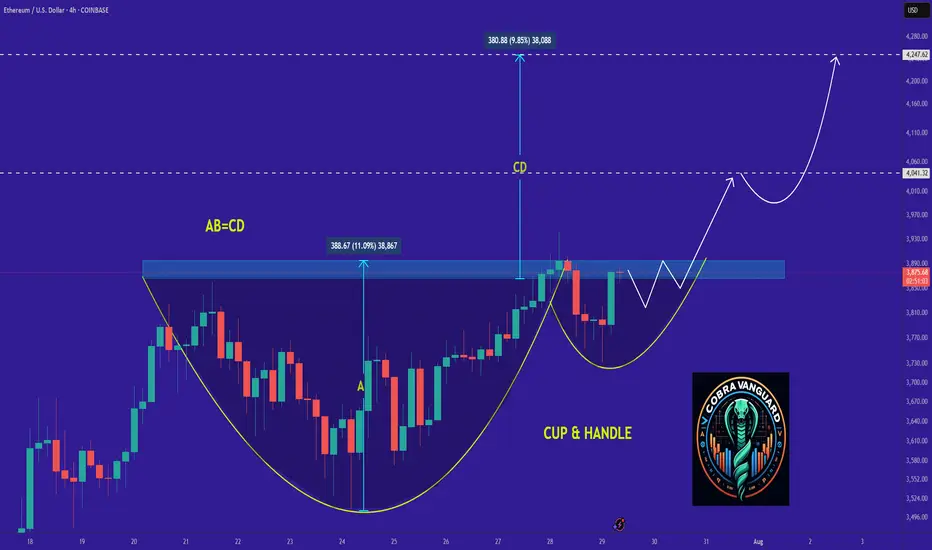
Cup and Handle Setup in Ethereum Since April trough, Ethereum has risen by 179%, delivering a higher rate of return than Bitcoin at 66%.
But most of our attention is on Bitcoin, breaking above the 120,000 level.
Why is Ethereum quietly gaining ground —and what does the future hold for Ethereum?
It's video version on its trading strategies:
Mirco Bitcoin Futures and Options
Ticker: MET
Minimum fluctuation:
$0.50 per ether = $0.05 per contract
Disclaimer:
• What presented here is not a recommendation, please consult your licensed broker.
• Our mission is to create lateral thinking skills for every investor and trader, knowing when to take a calculated risk with market uncertainty and a bolder risk when opportunity arises.
CME Real-time Market Data help identify trading set-ups in real-time and express my market views. If you have futures in your trading portfolio, you can check out on CME Group data plans available that suit your trading needs tradingview.sweetlogin.com
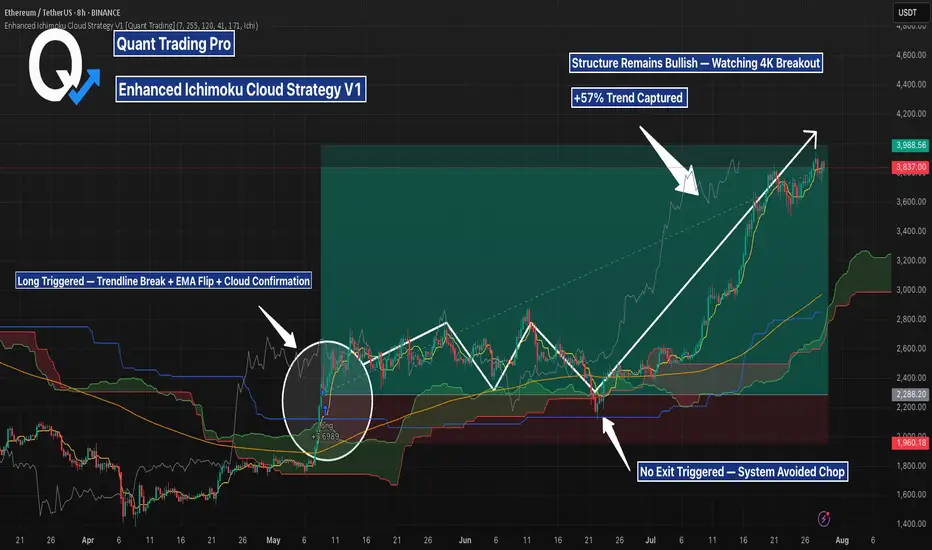
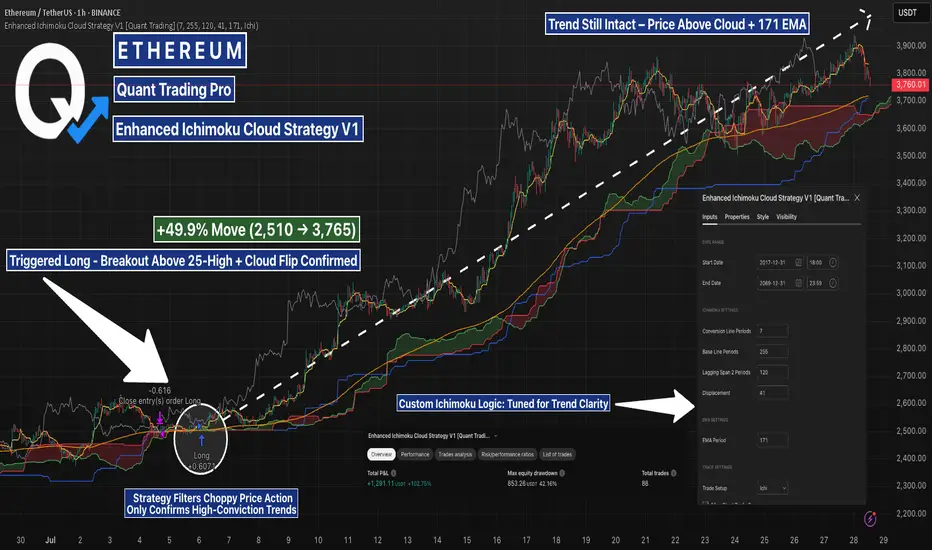
ETHUSD 8H — Strategy Nailed the Breakout, But Is $4K Next?This Ethereum 8H chart captures a powerful trend reversal, triggered by the **Enhanced Ichimoku Cloud Strategy V1**. After months of chop, the system delivered a clean entry and held the full breakout — now nearing key resistance around \$4K.
---
**📊 Setup Breakdown:**
* Entry triggered after **three major confirmations**:
* Breakout above long-term trendline
* Flip above the **171 EMA**
* Bullish **Ichimoku Cloud alignment**
* Strategy entered long near **\$2,530**, and has held the move for over 80 days
* Current price: \~\$3,988 — a **+57% trend** captured without exit signal
---
**⚙️ Strategy Logic:**
The strategy uses:
* Custom Ichimoku inputs: *(7 / 255 / 120 / 41)*
* A 171 EMA trend filter for signal clarity
* Optional “Cloud Mode” to confirm direction
* A memory-based system that reduces false chop signals
On this trade, the system **ignored mid-trend noise**, stayed in position, and let the move fully play out — exactly what it’s designed for.
---
**🔍 What to Watch Next:**
* Price structure remains bullish as ETH nears the psychological **\$4K resistance**
* Cloud support rising beneath — confirming healthy structure
* A clean break above \$4K could trigger another leg, while rejection may form a range
---
This is a prime example of how **low-frequency, high-conviction signals** can lead to massive upside when paired with disciplined exits. Backtest this strategy on your favorite altcoin pairs and compare.
Let me know when you’re ready to move to the next chart brother — this one’s ready for the spotlight 🔥
YOU ARE NOT BULLISH ENOUGH ON ETHEREUM! ethereum linear chart 3m timeframe major resistance level breakout occurred. if it continues to maintain the current area in the coming period, the major will continue to rise

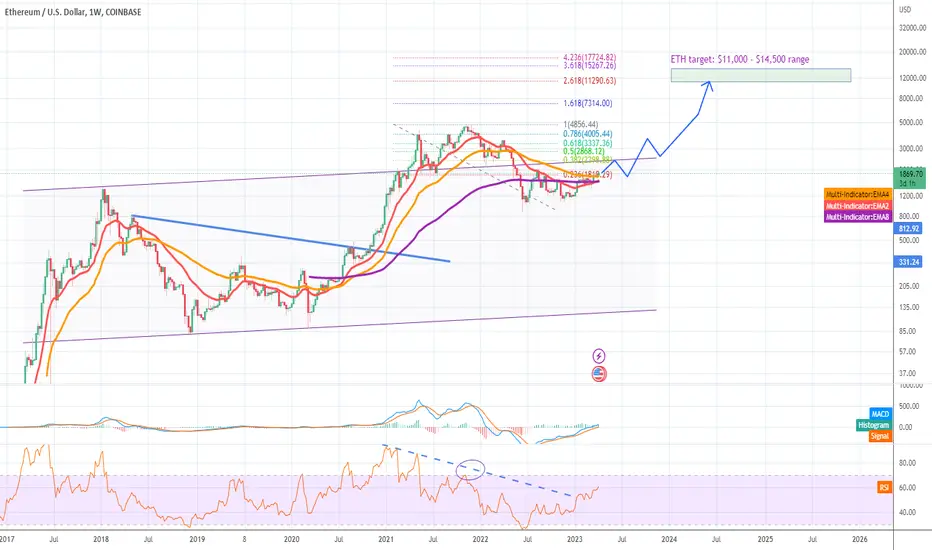
Ethereum - Time to buy again!It can be said that the price has formed a cup and handle pattern, which it is completing soon. If the price follows this pattern, it can be expected that Ethereum will reach its peak again.
Best regards CobraVanguard.💚
Strong ETH on the 4H !
ETH is now in the process of retesting both the 50MA and the 0.236 Fib level.
This current candle is closing strong — with solid volume. If momentum holds, both systems are close to flipping bullish:
– PSAR is about to flip
– MLR and SMA are lining up to cross above the BB center
RSI has cooled off, giving room for more upside, and MACD is close to turning bullish.
In short:
We’ve got a confirmed Fib retest on good volume
Both systems are preparing to signal long
And both oscillators are backing the move
We’ll be here to watch it unfold.
Always take profits and manage risk.
Interaction is welcome.

$ETH 2nd Weekly Close Above 50MA = Alt Season2nd Consecutive Weekly Close
above the 50MA for CRYPTOCAP:ETH
✅ Volume to confirm the breakout.
✅ RSI has bottomed.
WHAT TO WATCH 👀
┛Bullish Cross on the 20/50MA to confirm the next leg up.
┛Approaching some resistance ahead at the .236 Fib
┛Expect a small pullback in the next week or two so make sure to get your bids in.
Remember the rotation:
✅ BTC > ✅ ETH > Large Caps > Mid Caps > Micro Caps.
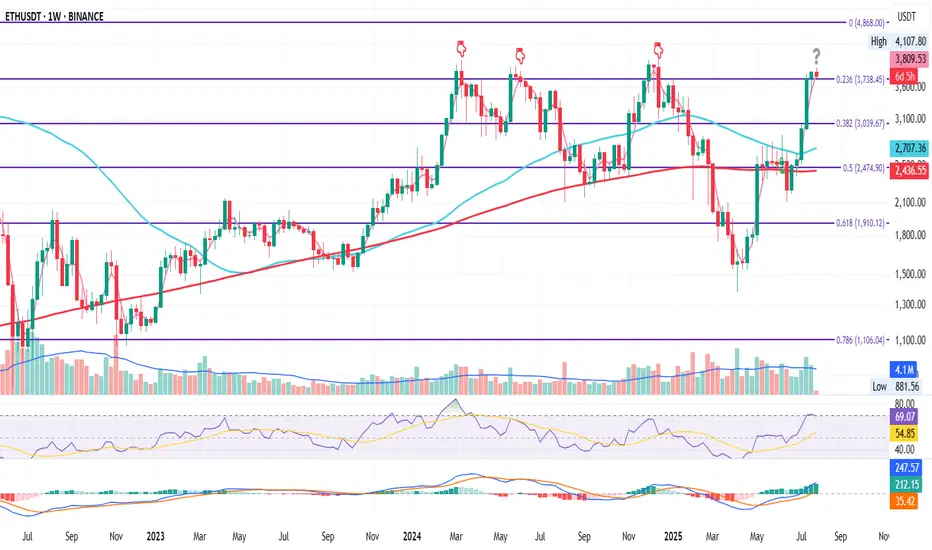
ETH Weekly Flip ZoneETH on the Weekly
ETH just closed the week above the 0.236 Fib level at $3738.45.
It’s the fourth attempt to conquer this zone since the June 2022 bottom.
If price holds above this level, the odds of continuation increase.
If it fails, we could see downside.
It may also just consolidate here for a while.
RSI just touched overbought, and MACD remains green — still some room for upside.
I remain bullish long term, but this looks like a smart area to manage risk if you’re late to the move, or take partial profits.
Always take profits and manage risk.
Interaction is welcome.
ETH 1H Cloud Strategy Nailed the Trend, But Is It Losing Steam?This Enhanced Ichimoku Cloud Strategy filtered out the chop and triggered a high-conviction long at 2510 — backed by a bullish cloud flip, 25-period breakout, and alignment above the 171 EMA. Since then, price has climbed nearly +50%, with the trend still intact above both cloud and EMA.
The custom parameters (7 / 255 / 120 / 41) are tuned for clarity and patience, making it ideal for swing entries on volatile assets like ETH and SOL.
Want to optimize for your own asset? Just load the strategy, tweak the inputs, and run a parameter test using TradingView’s Strategy Tester.
#ETHUSD #Ichimoku #TradingStrategy #TrendFollowing #TradingView #CryptoTrading #AlgoTrading
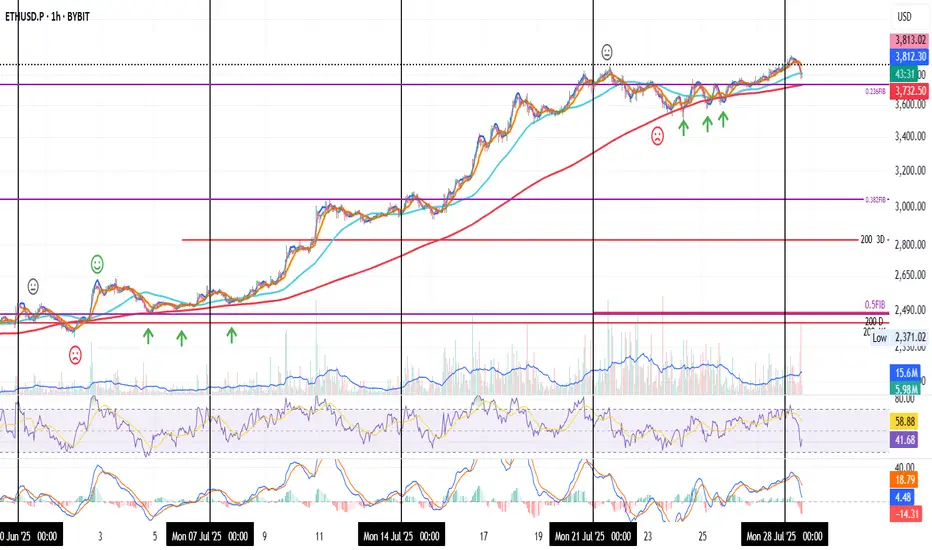
New Week New High for ETH
It’s just the start of the week, and ETH is already printing new highs.
But let’s zoom in on a familiar pattern in price action:
During the week of June 30 – July 7, ETH floated above the 0.5 Fib and the 200MA early in the week. Then it dipped below both levels, only to bounce back and start holding the Fib as sup
port. From there, price slowly climbed alongside the 200MA, bouncing off it a few times, then it took off.
Last week showed a similar setup, this time around the 0.236 Fib and 200MA.
Now both levels are sitting close together again. So, we might see another dip below them before ETH pushes higher.
Of course, if price fails to reclaim the zone, more downside could follow.
But as always: we’ll be here to watch it unfold.
Always take profits and manage risk.
Interaction is welcome.
Why hello there ETH, can we be friends?barring any black swan events - now that we have the new ETH release forthcoming, the bitcoin halving in the future, and the bear market behind us (fingers crossed?), this is the trend - we'll see some stops and volatility at the major support/resistances for trading.
I'll just be holding for the next year or two. Less stress!
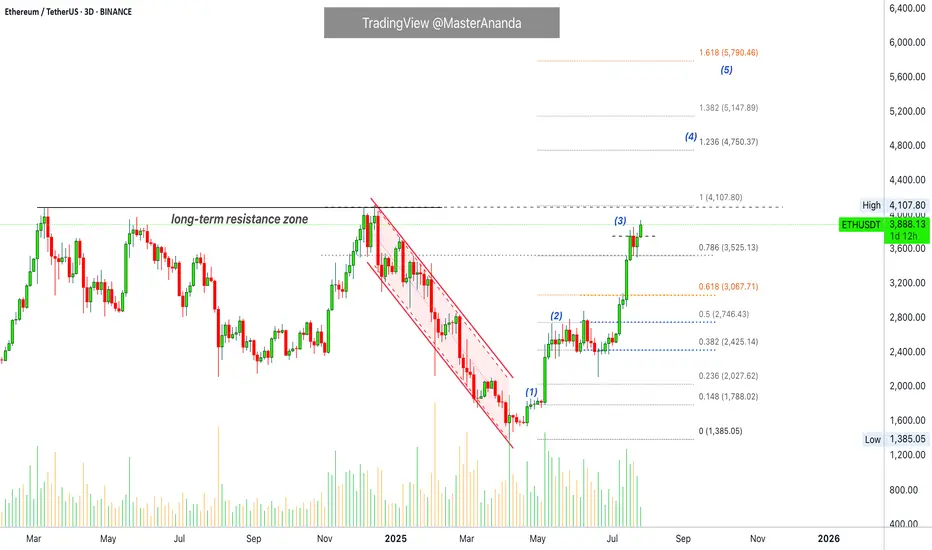
Ether Update · Accumulate, Buy & Hold · 2025 StrategyGood morning my fellow Cryptocurrency trader, I hope you are having a wonderful day.
Ethereum continues really strong and today is trading at the highest price since December 2024. Right now getting close to a long-term resistance zone that was first established in March 2024. As soon as ETHUSDT manages to break $4,100 as resistance, we can expect a major advance toward a new all-time high. Remember, sustained long-term growth, just as it is happening already. Notice the slope on the rising wave since April. It will continue just like this, prices going higher and higher until a final jump produces very high prices based on a long wick.
Market conditions have not change since our last update. Everything is extremely bullish and the chart looks even better now, the rest of the market is also looking better so the focus should be on hold and preparing a profit taking strategy. How will you profit from this trade? How do you intend to sell? How will you reduce or close your position when the time is right? You can start preparing now.
There are many ways to approach the targets but it is always wise to wait at least until a new all-time high. Since we have enough data support a new all-time high as a high probability scenario, we want to benefit as much as possible from the uptrend and thus we ignore the initial easy targets. We go for the higher targets because we are now in the 2025 bull market.
When in doubt, you don't have to be 100% right but neither 100% wrong. If you don't know how the market will behave next, instead of thinking to sell the entire position, you can sell a small portion only, say 10%. And continue like this long-term.
There are many strategies, many ways to plan and win, but for now focus on holding patiently, patience is key. Those who can wait the longer without being tempted can produce the best results. Just let it roll... The market is set to grow. Accumulation and buying now the best choice.
Namaste.
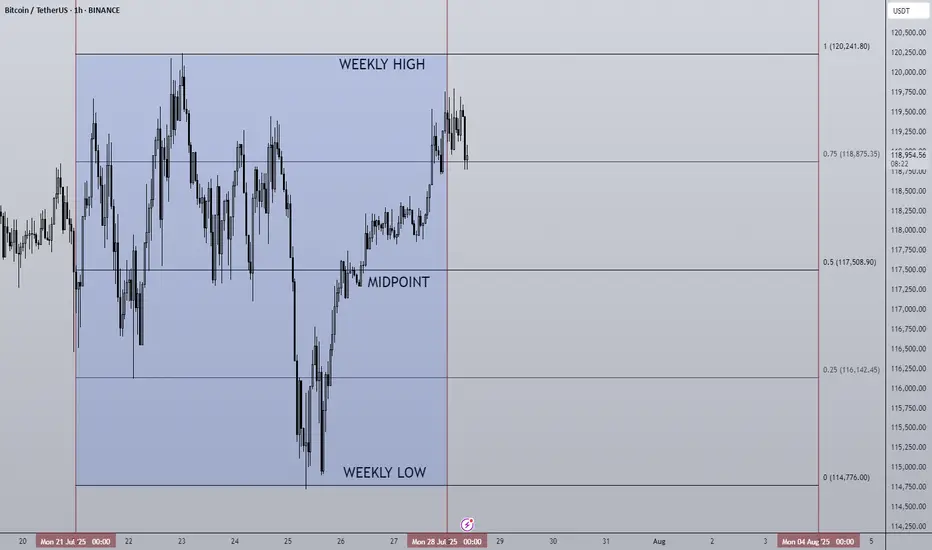
28/07/25 Weekly OutlookLast weeks high: $120,241.80
Last weeks low: $114,776.00
Midpoint: $117,508.90
As we approach the end of the month BTC continues to trade sideways during a cooling off period as altcoins finally take the stage. Last week Bitcoin saw a relatively flat net inflow via ETFs of $72m, ETH on the other hand posted the second largest net inflow week ever at $1.85B! The concentration has certainly shifted...
This IMO is still a very bullish structure for BTC, very shallow pullbacks being bought up/absorbed by still happy to purchase at these levels. As long as this continues altcoins have a strong base to continue growing on, if BTC breaks structure and price accepts below ~$110,000 then the altcoin rally will be over for now I believe.
This week some major altcoins are set to reach HTF resistance areas, ETH has already tagged $4,000 which looks to be a battleground level of major importance.
TOTAL2 which is the combined market cap of all altcoins is currently ~8% from the highs, keeping this in mind for where altcoins may run out of steam...
Good luck this week everybody!