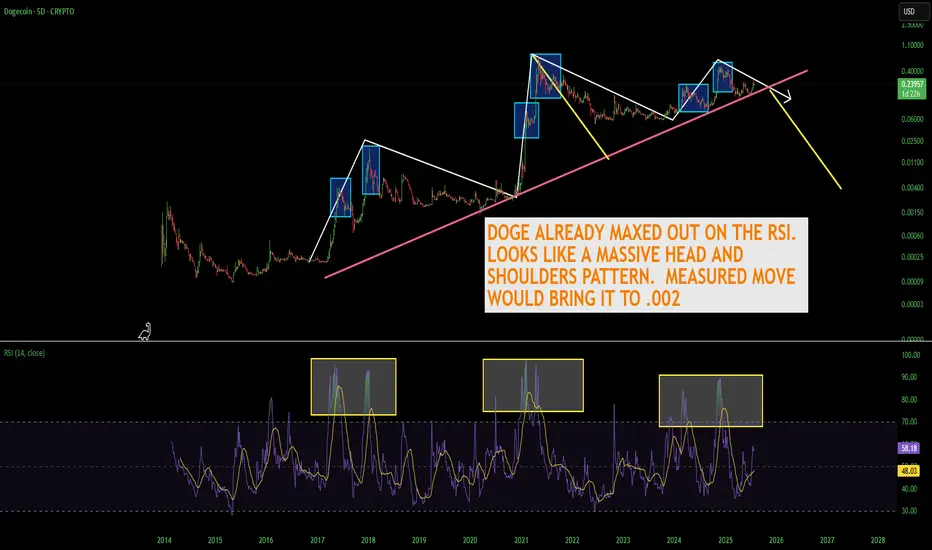
THE TRUTH ABOUT DOGECOINDogecoin is looking really toppy. As you can see the RSI has peaked out early before a new high which is alarming. I think Doge is in serious trouble here as the meme craze starts to shift into newer memes. If the head and shoulders pattern plays out you're looking at a catastrophic drop down to 2 tenths of a penny. Doge is EXTREMELY overvalued and needs to come back down to earth. Don't forget there is close to 15 million Doge mined per day forever. It appears with the way the RSI peaked and price didn't break the high that Doge has reached a plateau in price even if the market cap continues to go up.
Not financial advice just my opinion.
J-ETH
Ethereum Weekly Recap & Gameplan | 27.07.2025📈 Market Context:
ETH followed the broader crypto market momentum led by Bitcoin, supported by institutional demand and positive macro policies in the U.S.
Last week’s plan played out cleanly — we saw strong gains from the 1H demand zone.
🧾 Weekly Recap:
• Price swept 4H swing liquidity and formed a 1H bullish BOS
• Created a solid 1H demand zone, from which price bounced strongly
• Momentum remained bullish as forecasted in last week’s post
📌 Technical Outlook:
→ Expecting a short retracement into 4H liquidity levels around 3761$ or 3702$
→ Then a continuation move towards ATH zone
🎯 Setup Trigger:
What I’m watching:
✅ Sweep of 4H liquidity
✅ Bullish BOS on 15M–30M
→ This will serve as the confirmation for long entries
📋 Trade Management:
• Stoploss: Below the confirmation swing low
• Target: 4100$
💬 If you found this helpful, don’t forget to like, comment, and follow — I share setups like this every week!

ETH/USDT 4H Chart📊 General Context
Ethereum is rising in a strong short-term uptrend, supported by a rising trendline (orange).
Current price: 3831 USDT
We are approaching a significant resistance level around 3842–3850 USDT (green line).
Technical support is located around 3760 USDT (previous consolidation level and 50/200 SMA).
🔍 Technical Levels
Resistance:
3842–3850 USDT – local high, currently being tested.
4006 USDT – key psychological level and the last local high on the chart.
Support:
3762 USDT – previous resistance, currently turned into support (may be tested in a correction).
3650 USDT – strong technical support, confirmed several times in the past.
SMA50 and SMA200 – currently just below the price, also acting as dynamic support.
📈 Technical Indicators
MACD:
The histogram is rising and positive → bullish momentum.
The MACD line crosses the signal line from below → a buy signal.
RSI (14):
Currently: around 64 → not yet overbought, but close to the overbought zone.
Slightly rising trend, but may suggest impending market overheating with further gains.
🧭 Trend
Short-term: strong uptrend (trend line, green candles, breakout from consolidation).
Medium-term: higher lows and higher highs – the uptrend is maintained.
The price is holding above the 50 and 200 SMAs – confirming bullish sentiment.
⚠️ What to watch next?
A 4-hour candle close above 3842 USDT → confirmation of a breakout, a potential attack on 4000–4010 USDT.
A break of the trend line (orange) → a possible correction to 3760 or even 3650 USDT is possible.
An RSI rise above 70 → an overbought signal, a possible pullback or consolidation.

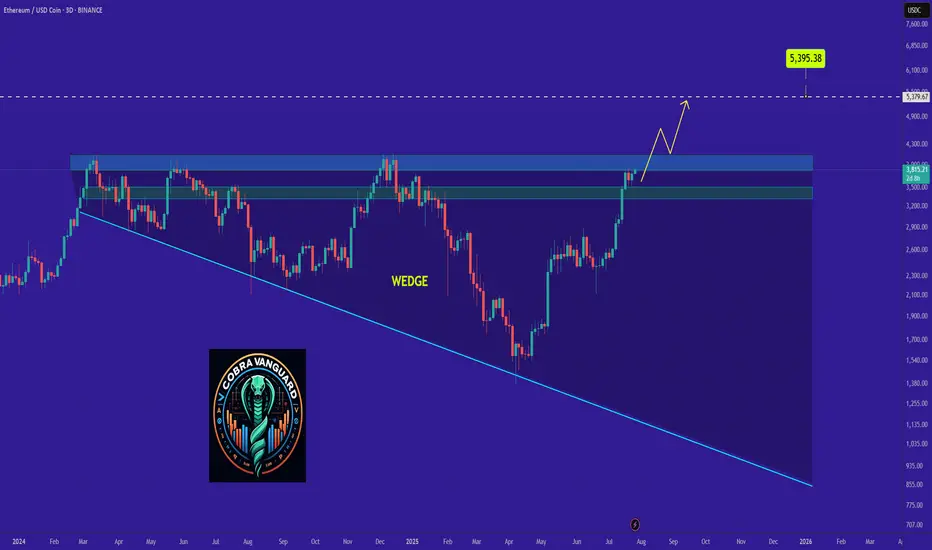
Why ETH Remains Bullish and Its Next Potential Move !The ETH will increase $200 and reach to the top of the wedge in the coming days .
We can be hopeful that after breaking out of the wedge, we will see significant price growth.
Best regards CobraVanguard.💚
Give me some energy !!
✨We spend hours finding potential opportunities and writing useful ideas, we would be happy if you support us.
Best regards CobraVanguard.💚
_ _ _ _ __ _ _ _ _ _ _ _ _ _ _ _ _ _ _ _ _ _ _ _ _ _ _ _ _ _ _ _
✅Thank you, and for more ideas, hit ❤️Like❤️ and 🌟Follow🌟!
⚠️Things can change...
The markets are always changing and even with all these signals, the market changes tend to be strong and fast!!
$ETH Mid-TermLooking at Ethereum from a mid-term perspective, it’s currently sitting near its price ceiling, suggesting a potential need for a correction. Of course, it’s also possible that this level could be broken, depending on overall market conditions. However, the primary scenario is that it fails to break through and pulls back, with the potential reversal zone identified based on Fibonacci levels. On the other hand, the 55 EMA is also providing solid support.
If Ethereum manages to break above this resistance, then we'll wait for either a confirmation or a pullback before entering a long position

Closing the Week on ETH 1H
ETH is about to close the week just above the 0.236 Fib level.
The 50MA is crossing this key level, and the 200MA is close behind — showing alignment across moving averages.
MLR > SMA > BB Center confirms the current uptrend.
Volume is picking up slightly, though it’s Sunday — so expectations remain tempered.
RSI is nearing overbought but still has room to push higher.
MACD supports the bullish momentum.
Taken together, these signs lean bullish for the weekly close.
But this is crypto — and anything can happen in the final hours.
We’ll be here to watch it unfold.
Always take profits and manage risk.
Interaction is welcome.

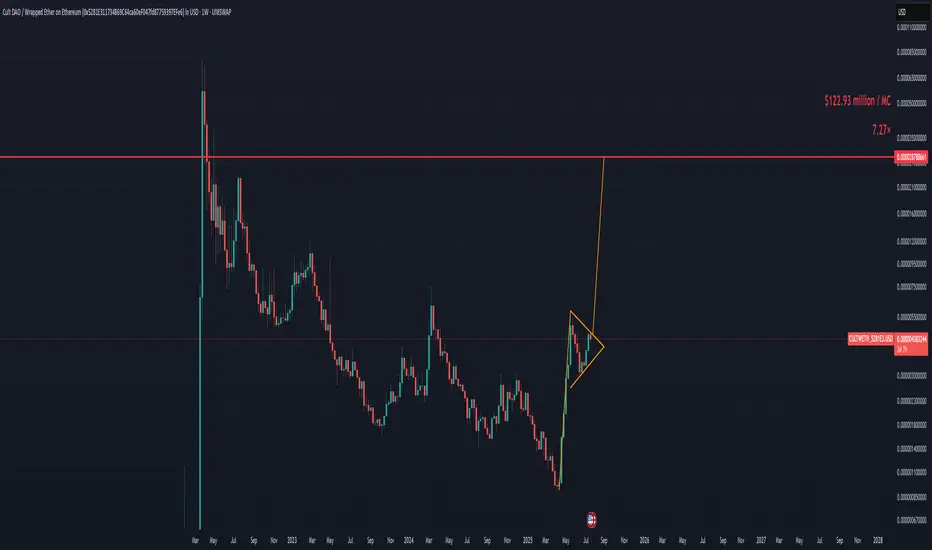
Brace for Impact: CULT DAO’s Bull Flag Points to Violent Upside!If you missed the last 500% wave from CULT DAO, fear not you’re just in time if you’re reading this.
My bottom call was slightly off, but since the lows, it's up 500% and it's just getting warmed up.
We are now forming a giant bull flag that will take CULT DAO straight to $122 million a 7.27x from this price.
I will be publishing CULT DAO TA’s until we hit a one billion dollar market cap, which we should reach sometime in Q4 2025.
Seeing a giant bull flag forming as we enter the final phase of the bull market is beautiful.
Prepare accordingly. Time is limited. We will blast off in under 30 days.
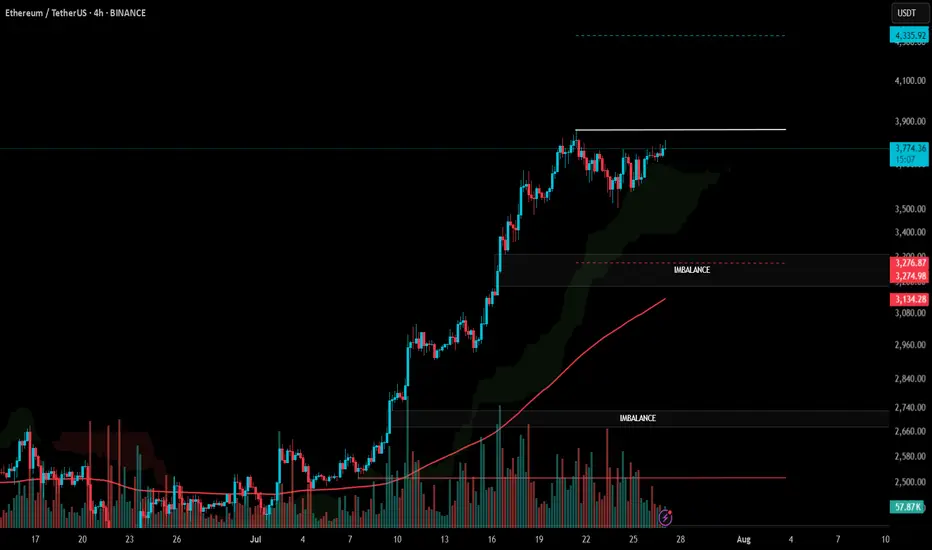
#ETH Update #5 – July 27, 2025#ETH Update #5 – July 27, 2025
Ethereum is attempting to revisit the levels of its previous impulsive move without having completed a proper correction. The fact that Ethereum has not made a retracement around 3280 and is instead pushing toward a new ATH does not seem very healthy to me. If it had completed the correction, it would have also balanced an existing imbalance in the structure.
When we look at the recent candles, we observe a lack of volume. This volume weakness is not sufficient to break the resistance at the previous high. If Ethereum breaks the 3900 dollar resistance level with a strong candle, it could move toward the 4335 dollar zone.
However, it should not be forgotten that there is still an imbalance and a correction zone around 3280 dollars. If the price decides to return to that level, it would mean an approximately 15% pullback from here. This could pose significant risk for altcoins, and we might see corrections of up to 40% in some.
Ethereum is currently one of the riskier assets for either taking a long or short position. Therefore, I do not recommend opening any position at this stage.
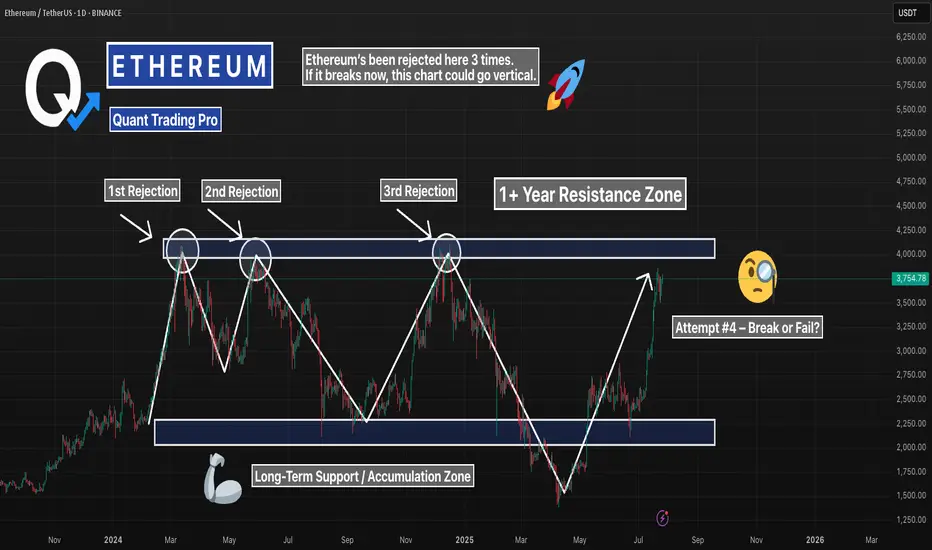
ETH Daily – Triple Rejection Zone Back in PlayEthereum’s pushing back into one of the most important resistance zones on the chart — the same level that’s caused three major rejections in the past year.
Now we’re testing it again, but this time momentum’s different. Daily structure is stronger, volume’s climbing, and bulls are showing no hesitation.
Here’s what matters:
– Triple top? If rejected again, this zone holds the trend hostage
– Break + retest? That’s the setup bulls have been waiting for
– Either way, this is a high-stakes level — and price won’t stay here long
Eyes on ETH. This zone will decide the next leg.
#ETH #Ethereum #TripleTop #ResistanceTest #CryptoTrading #DailyChart #TechnicalAnalysis #QuantTradingPro
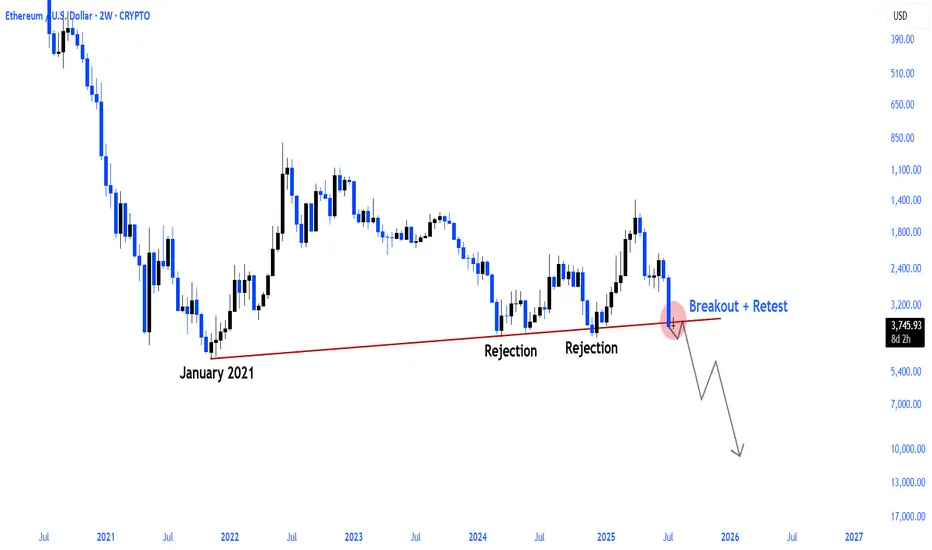
$ETH MAJOR FALLING TREND BREAKOUT!CRYPTOCAP:ETH MAJOR FALLING TREND BREAK AND RETEST COMPLETE.
Eth season seems to be just around the corner
MORE TO COME
ETHUSDT Short Trade IdeaShort ETHUSDT at $3,745.22 with a target of $3,561.34.
Reason for Short: The 4-hour chart shows a symmetrical triangle pattern with resistance around $3,745-$3,800. The price is testing this upper trendline, and a recent bearish candle suggests potential rejection. The DEMA at $3,747.75 indicates overextension, supporting a pullback.
What I See: Heavy sell pressure is forming near $3,745, with the triangle nearing a breakout/breakdown point. Support lies around $3,561, aligning with prior lows.
Stop Loss: Set at $3,802, above the recent high and triangle resistance, to avoid a bullish breakout.
Trade Rationale: A breakdown from the triangle with volume confirmation could drive the price to $3,561. The tight stop above resistance minimizes risk while targeting a key support level.


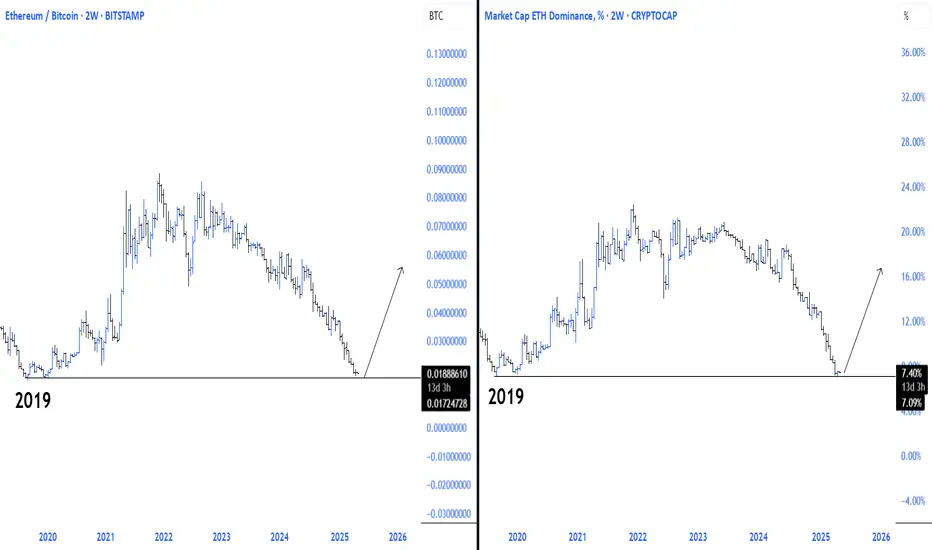
Ethereum Bitcoin pair bottom confirmed!As confirmed by CRYPTOCAP:ETH \ CRYPTOCAP:BTC momentum, we can say that a local bottom was seen at 2019 accumulation levels. With a major reversal from the current region, we can see major movements across Altcoins, with Ethereum being an undeniable leading force and leader for altcoins.

ETHBTC x ETH.DETHBTC x ETH.D
Ethereum bitcoin pair and ethereum dominance will gain upward momentum with the reaction it receives from the major support line in 2019
The better Ethereum is, the better Altcoins will be.
BTC setup looks good for 5R.Looks like BTC is about to make another leg up toward 135K. Playing a 5:1 R:R on this setup
Entry: 119,000
Stop Loss: 116,000
Target: 135,000

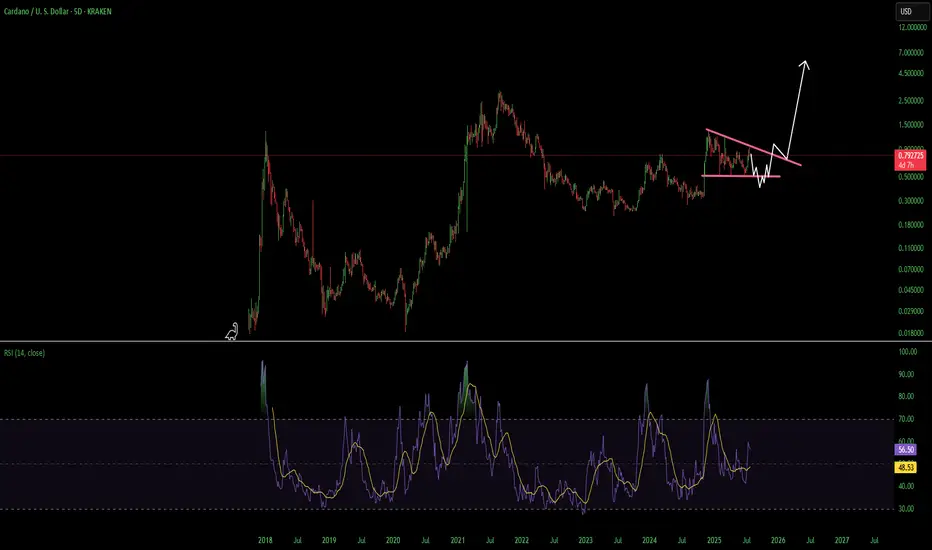
ADA Cardano Decsending Triangle Use Caution HereCardano had a heck of a move but i think its going to erase most if not all of it before it goes on its next leg up. A break over the overhead resistance line and finding support above would invalidate this. Not financial advice just my opinion. Thank you
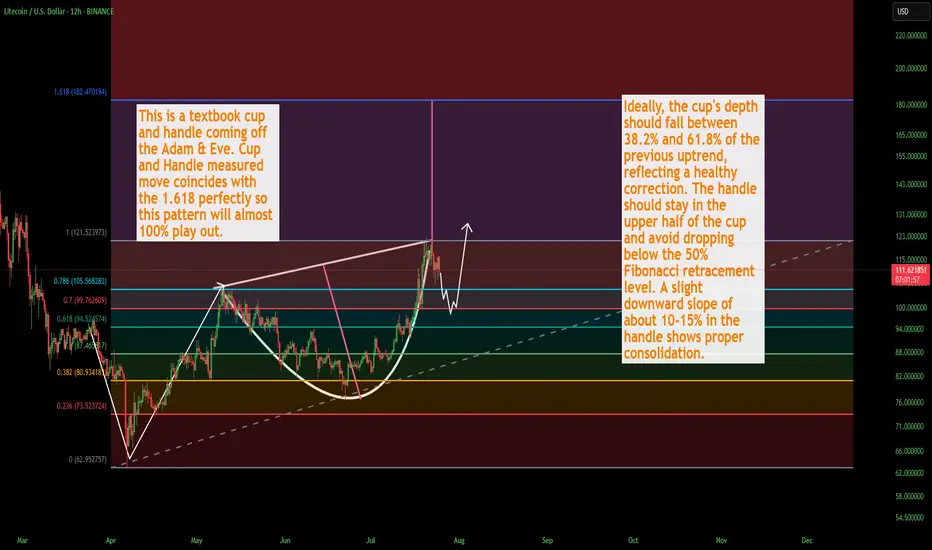
LTC Litecoin USD Textbook Cup & HandleLitecoin should finish its correction over the weekend and as we get into August the momentum will shift back to the upside. This is a washout of over-leveraged positionsbefore the next massive leg up. I still see a correction down to about 100 dollars. Could be a wick lower but not too confident. There is quite a bit of strength in Litecoin, and for good damn reason.
Not financial advice just my opinion. Thank you
ETH/USDT: Bearish Reversal After Hitting the Decision PointHello guys!
After a strong rally, ETH finally hit the Decision Point (DP) zone marked above. Like what I said:
And we’ve already seen signs of rejection from that level.
🔹 The ascending trendline is broken
🔹 A key support got engulfed
🔹 Price is now forming a bearish structure
The target zone is mapped out around $3,500 – $3,470, where previous demand sits.
We might see a small pullback before continuation, but overall momentum is shifting downward.
Wait for confirmations and protect your capital

Ethereum will retest the $3,500 level ┆ HolderStatOKX:ETHUSDT is trending upward with $3,100 as the next resistance. Breakout aims for $3,250. $2,875 remains critical support. Bullish momentum intact.

ETH on the 1H
After rejecting the 0.236 Fib level, price found support at the 200MA.
RSI cooled off slightly, giving room for another move before hitting overbought.
MACD just flipped bullish, pushing price higher.
MLR > SMA > BB Center — structure confirms upward momentum.
Now price is back at the Fib level.
It looks fresher than yesterday, but needs clean closes above to build traction for a real breakout.
We’ll be here watching.
Always take profits and manage risk.
Interaction is welcome.

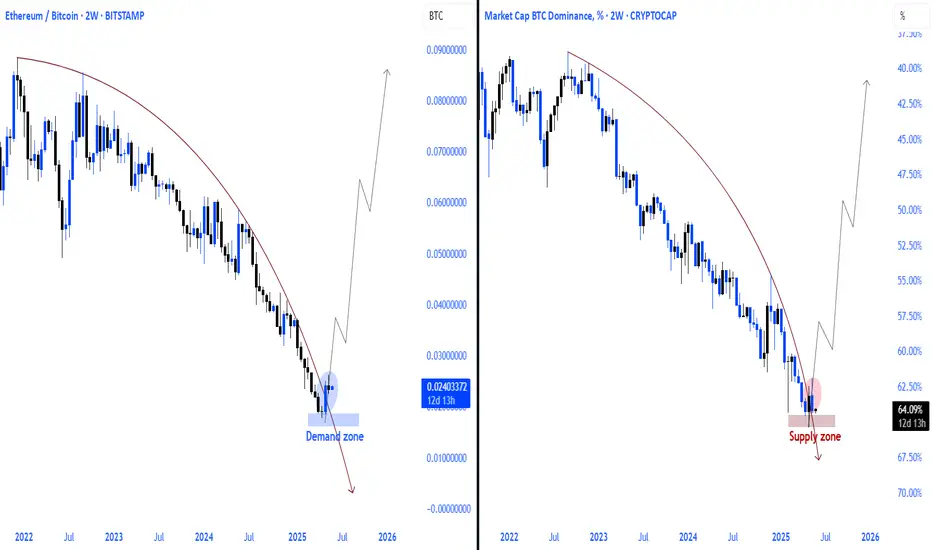
ETH/BTC vs btc dominanceethereum received a reaction as we expected from the current demand zone in the bitcoin pair, and it seems inevitable that the upward momentum from the current area will continue. on the bitcoin dominance side, the same situation exists, but I think we will witness a bearish absolute process.
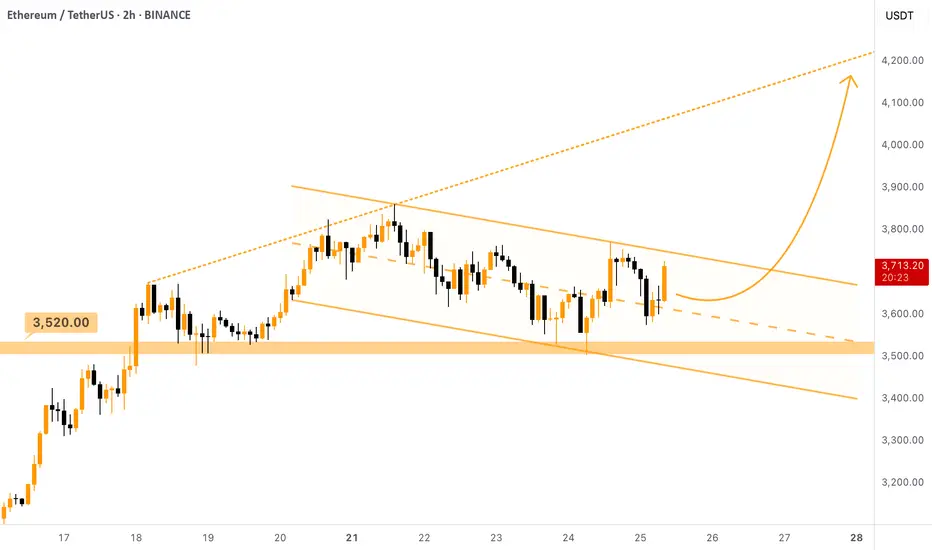
$ETH - Taking Lead Over $BTC (again)Ethereum is strong as ever here. Despite Bitcoin dumped due to the FUD of Galaxy Digital selling CRYPTOCAP:BTC worth of $3.5B, Ethereum managed not stay above the support and even umped!
It is currently forming a Descending Channel (bullish pattern) above the $3520 support level. Local setup. Once this channel is broken upwards, we can expect the price to move towards the ascending resistance that was set a week ago, target is $4100 - $4200 .
You can either enter a trade here or wait for the breakout of the descending channel, the second option is safer.
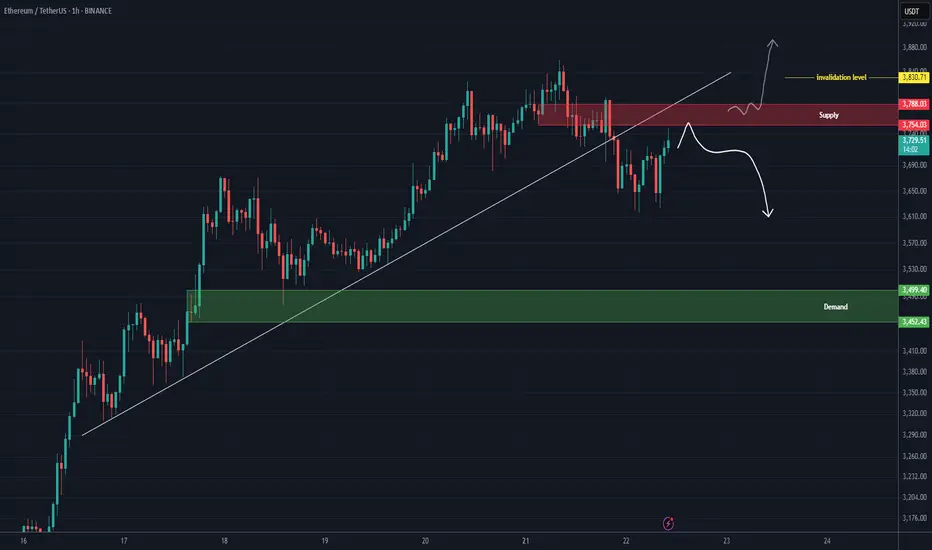
ETH analysis (1H)A trendline has been broken, and a resistance zone has formed on the chart. As long as Ethereum fails to hold above the red zone, the price may experience a drop.
The green box can be considered the target.
If the price stabilizes above the red zone and a daily candle closes above the invalidation level, this analysis will be invalidated.
For risk management, please don't forget stop loss and capital management
Comment if you have any questions
Thank You