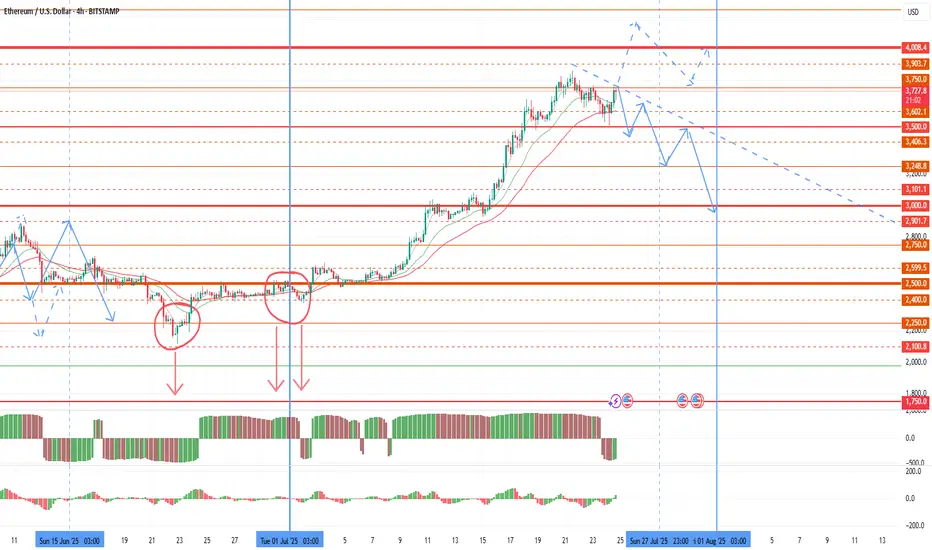
Possible market drawdown before the end of the monthToday I want to review the market and give a warning on further purchases. Since the last review, as expected, volatility in the market began to grow with a flat of about 2500 on ether until the half-year change. The growth of the euro and oil gave rise to a 4k retest in the new half of the year. However, the half-year has opened below 2,500, which is a technical selling signal that bears will use at the end of each major period. A large volume of sales was also left before the half-year change, which can be retested up to 2100-2250. The first pullback is already possible for the current monthly candle, with its pinbar reversal up to 2750-2900 on ether. This pullback started yesterday and is likely to accelerate in the last weekly candle of the month. Further sales are highly likely to continue in the first half of the new month as part of the shadow drawing for the new monthly candle. In an optimistic scenario, the bulls will be able to take 4,000 by the end of the week, in which case the pullback on the current monthly candle will be compensated.
Given the increased likelihood of sales in the market, I recommend fixing profits by the end of the week and reducing the number of coins in operation. The current rollback for some coins will also end with the assignment of the monitoring tag at the beginning of the month and a further collapse, which puts pressure on the coins.
Most of the coins that I considered for work provided good opportunities for making money, especially the growth impulses of pivx and data with sharp breakouts stood out. Adx fio chess cos token also showed growth, but at a smoother pace. The most negative dynamics was given by slf, which eventually received the monitoring tag, and I will not consider it in the future.
Despite the pleasant impulses of 50%+ for individual fantokens, this group as a whole shows extremely negative dynamics relative to the market, and remains in the most oversold position, even relative to coins with the monitoring tag. In an optimistic scenario, fantokens will become interesting to speculators against the background of the general decline of altcoins that has begun, and we can expect a good bull run on them before the end of the month. In a negative scenario, binance may be preparing to assign the monitoring tag to some tokens of this group or chz. In this regard, I leave such tokens as atm acm city porto Lazio as the most undervalued in a small lot. But at the beginning of the month, I also recommend keeping short stops on them in the first half of the day of the first week of the new month to insure against assigning the monitoring tag. Or temporarily sell them for a given period.
In addition to fan tokens, I will choose new coins for operation after assigning the monitoring tag in the new month.
J-ETH
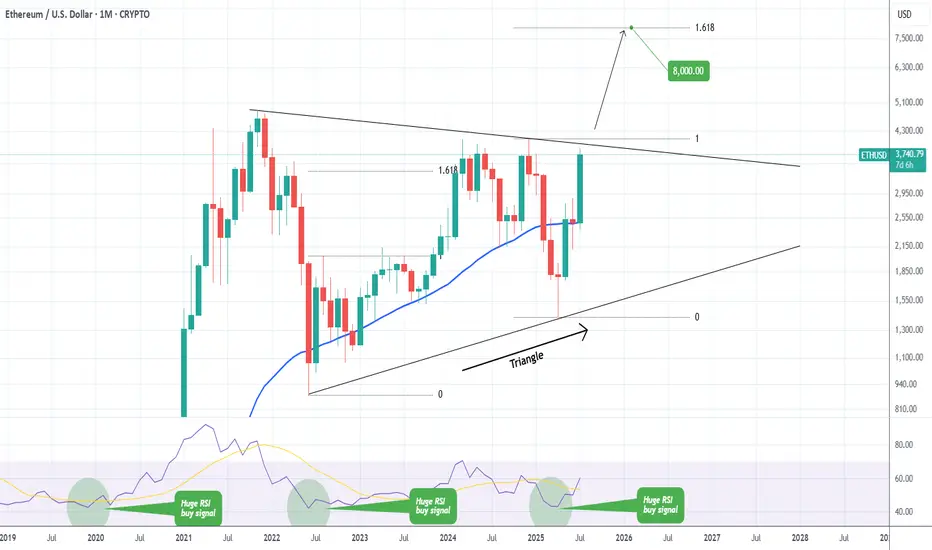
ETHEREUM Massive Triangle break-out ahead??Ethereum (ETHUSD) has been trading within a 4-year Triangle for the entirety of this Cycle. The recent post April rally has been the most aggressive since the parabolic rally that led to the Top of the previous Cycle.
The price is now almost on the top (Lower Highs trend-line) of the Triangle. A break above it, can initiate an aggressive Bullish Leg towards the 1.618 Fibonacci extension ($8000), which was the level that was marginally exceeded during ETH's first rally of this Cycle.
-------------------------------------------------------------------------------
** Please LIKE 👍, FOLLOW ✅, SHARE 🙌 and COMMENT ✍ if you enjoy this idea! Also share your ideas and charts in the comments section below! This is best way to keep it relevant, support us, keep the content here free and allow the idea to reach as many people as possible. **
-------------------------------------------------------------------------------
💸💸💸💸💸💸
👇 👇 👇 👇 👇 👇
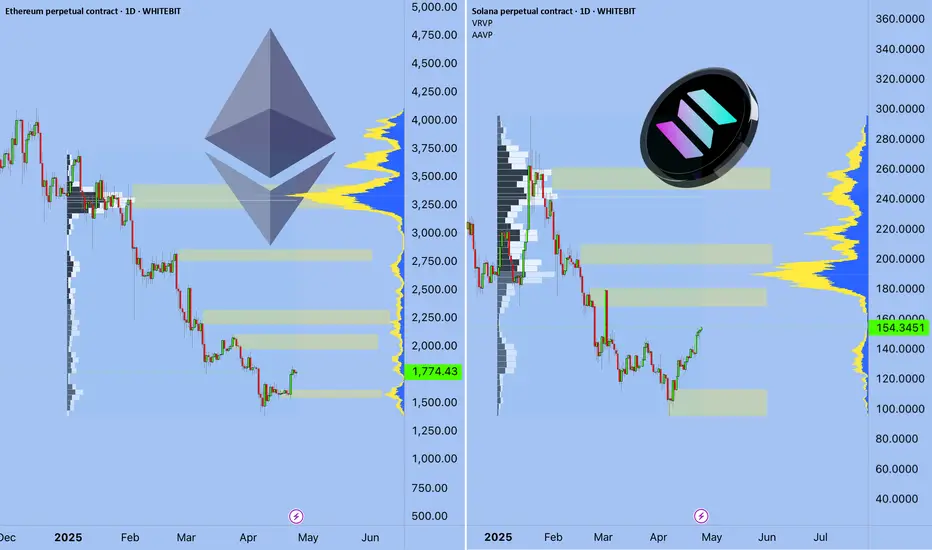
Ethereum vs SolanaIn 2025, the competition between Ethereum and Solana is no longer just a rivalry — it’s a pivotal chapter in blockchain evolution.
We are witnessing a clash of two philosophies:
Ethereum — maturity, security, and deep ecosystem
vs.
Solana — speed, efficiency, and adaptability.
📈 Price Resilience vs. Market Legacy
While Ethereum still holds the crown in market cap and institutional trust, Solana is rewriting the rules with superior transaction speed and cost-effectiveness.
The question is no longer "Who is better?"
It’s "Who is evolving faster?"
⚡ Key Drivers Shaping the Ethereum-Solana Rivalry
1️⃣ Scalability vs. Stability
Solana leads with up to 65,000 TPS, attracting high-frequency traders, NFT creators, and DeFi innovators.
Ethereum, relying on its Layer-2 solutions, tries to balance security with scalability.
2️⃣ Institutional Shifts
Funds like Galaxy Digital and Ark Invest are reallocating capital towards Solana, betting on efficiency and growth.
Ethereum, meanwhile, is waiting on ETF approvals to regain momentum.
3️⃣ Technological Innovation
Ethereum focuses on sharding and Layer-2 expansion.
Solana pushes aggressive ecosystem growth but pays the price with occasional network instability.
📊 Market Performance Snapshot — 2025
Ethereum: ▼ 56% YTD | ~$1,600
Solana: ▼ 40% YTD | ~$135
Solana’s DEX market share jumped to 39.6% in Q1, driven by meme coins and retail traders.
Ethereum’s dominance continues to erode under macro pressures and rising competition.
But don’t be fooled — Ethereum's foundation remains strong. Institutional adoption and infrastructure upgrades still offer potential for a rebound.
📉 ETH/BTC Looks Like a Meme
ETH/BTC:
SOL/BTC: Potential -50% in next 160 weeks ➡️
ETH/SOL:
⚡ Where Did the Liquidity Go?
The real question isn’t why ETH is dropping —
It’s why no one cares.
Layer 2 solutions — Arbitrum, Optimism, Base — have drained liquidity from Ethereum’s mainnet.
DeFi activity? → Migrated to L2
Users? → Choosing lower fees and speed
Ethereum L1? → A blockchain for whales and archives
No liquidity = No rally
No narrative = No attention
Funds are betting on Solana and L2, not Ethereum’s base layer.
🎯 When Could ETH Take Off?
Only if we see:
A strong “Liquidity Returns to L1” narrative (RWA could be a trigger)
Spot ETH ETFs launching with institutional accumulation
A new DeFi wave on L1 (unlikely with current gas fees)
Or simply — when the market decides to pump forgotten assets
For now, Ethereum is about patience.
Smart money is flowing into L2, Solana, and high-risk narratives.
🕒 But Time Will Tell...
Today, we debate ETH vs. SOL.
Tomorrow — the bull market ends, and we’ll be discussing entirely different narratives.
Are you SOL or ETH?
As always, stay one step ahead.
Best regards,
EXCAVO
______________________________
Disclosure: I am part of Trade Nation's Influencer program and receive a monthly fee for using their TradingView charts in my analysis.
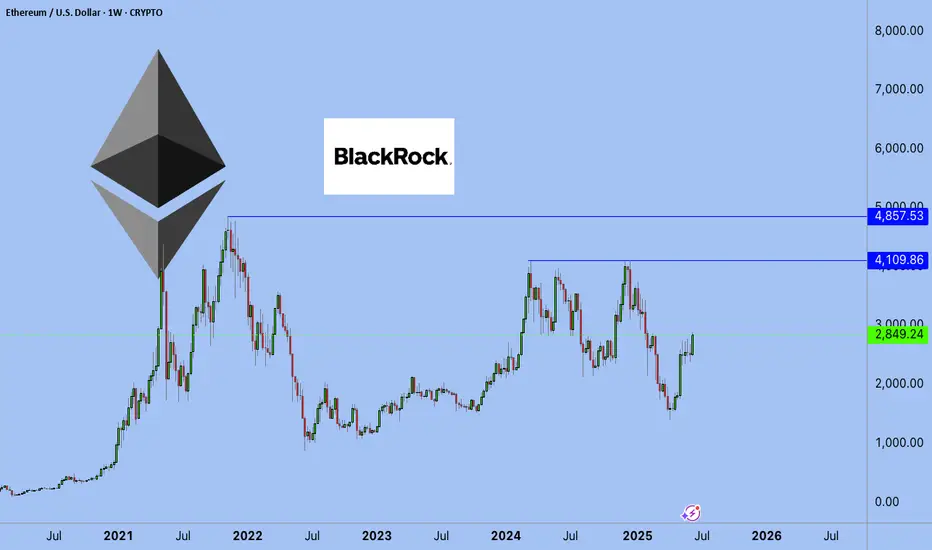
ETHEREUM: THE NEW BOND OF THE DIGITAL WORLDPrice isn’t the goal. Price is the side effect.
Meanwhile, BlackRock - a black hole with a trust-backed logo - just absorbed 42,000 ETH more.
Yesterday, you may have read this "regular" headline:
BlackRock increases its Ethereum exposure to $4 billion, adding $109.5 million via ETFs.
But here’s what you missed: there are no random numbers on the market.
When a player like this moves - it’s not hype. It’s a blueprint for the future.
Ethereum is no longer an altcoin.
It’s no longer speculation. It’s a financial infrastructure, already recognized by law, exchanges, and institutions.
What does this mean?
💡 Ethereum is now a digital bond - with yield flowing from blocks.
Profit is no longer built on promises, but on the structure of the chain itself.
Trust lies not in faces, but in code.
Growth is not artificial — it’s architectural.
And here’s why this is terrifyingly beautiful:
While you sleep, they are building an era.
Each ETF purchase removes ETH from circulation - permanently. Because:
✅ This ETH is gone from the open market
✅ It won’t be panic-sold
✅ It becomes income-bearing collateral, not a speculative asset
Still waiting for an entry signal?
The big players are already in.
This is no longer crypto - this is cash flow infrastructure, embedded into the digital economy.
And when pension funds, insurers, and sovereign investors move into Ethereum - they will come via ETFs.
Not because it’s trendy, but because it’s regulated, stable, and profitable.
📉 When institutional demand meets vanishing supply - the price won’t simply rise. It will explode, not as growth, but as a structural liquidity shift.
Ethereum is:
💸 Staking = passive yield
🔗 Backbone of DeFi
🖼 Fuel for NFTs
⚙️ Millions of transactions per second
⚖️ A regulated ETF asset
This is the new digital bond system, where the bet isn’t on the dollar - it’s on ETH as an income-producing asset.
💥 While you're reading this, the game is already on.
ETFs are rewriting the rules of time-ownership.
No hype. Just filings. Just intention.
Best regards EXCAVO
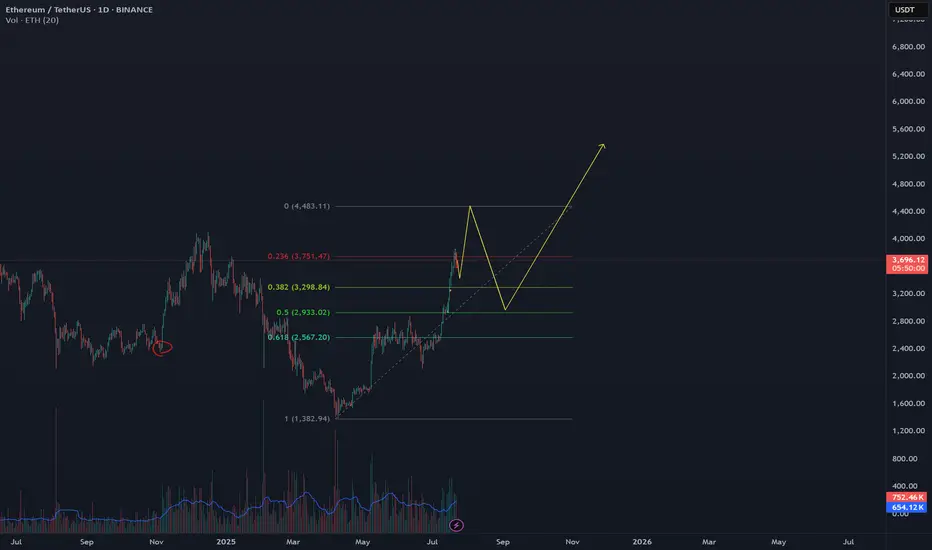
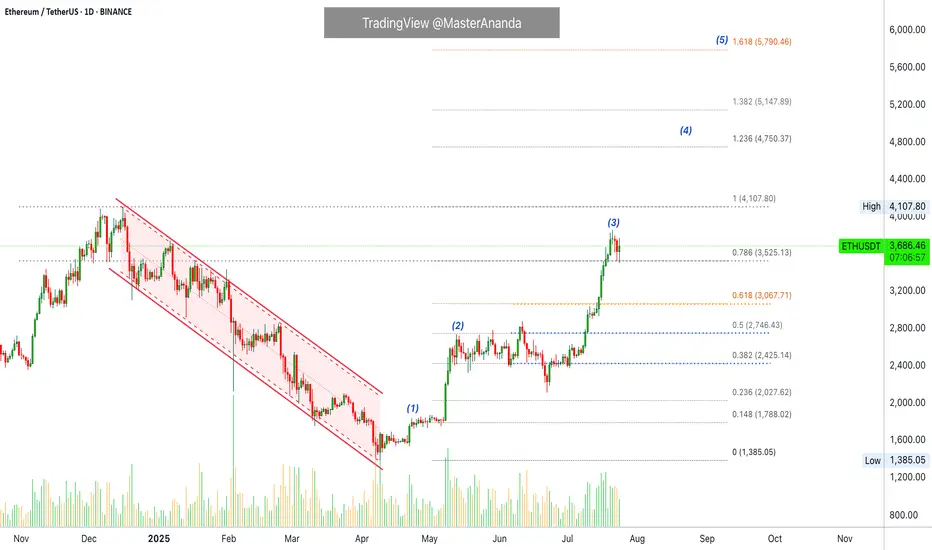
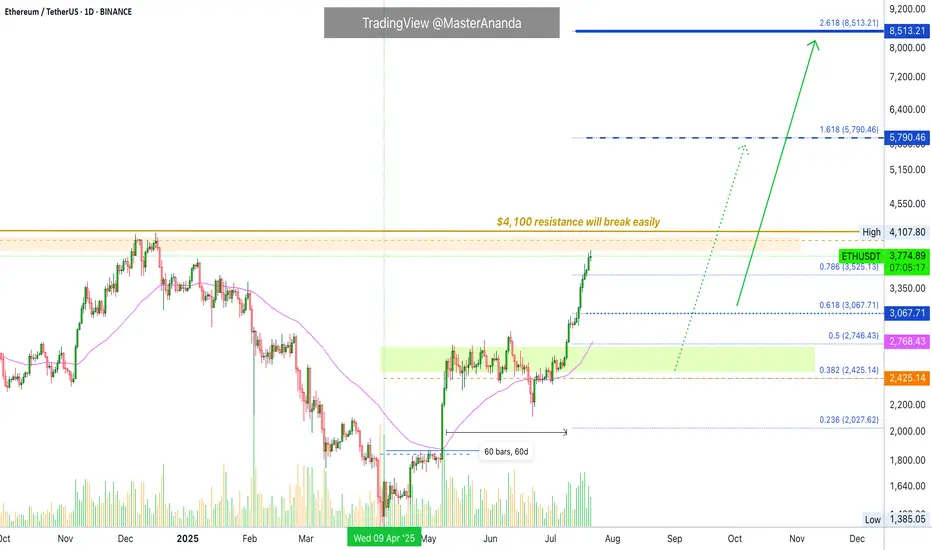
Why Ethereum Will Continue Growing · Trading Above ResistanceEthereum started its latest bullish on the 9th of April. Each advance has been preceded by a period of consolidation.
ETHUSDT (Ether) recovered from its bottom range 23-April, immediately it went sideways for 14 days before moving forward (1). As soon as Ethereum reached $2,700, we have the same pattern but extended, more sideways before moving forward. See this as (2) on the chart. This time the consolidation period lasted 57 days.
The last advance was even stronger (3), Ethereum peaked at $3,860 and we can expect another sideways period, a pause, repeating the same pattern as before. Now, there is an interesting part. The first is a prediction: This consolidation period wont be as long as the second one. The second is related to resistance and support. Notice how ETHUSDT peaked above 0.786 Fib. and this level is being tested as support. The fact that bullish action managed to conquer this level and stop above it, not below, favors the bulls. This means that the market is strong and set to continue growing. There is no significant bearish volume on the red days and the action is neutral so we can expect an advance; the next high will be a new all-time high. We will name it (4) on the chart.
This price pattern should repeat giving us additional growth. After a new all-time high, there will be resistance shy of 6K. And then we expect higher prices with Ethereum peaking around $8,500. Depending on how this level is handled, we can look for $10,000 or even $11,000.
Right now the chart is bullish and points higher.
Continue to hold long-term. It is still too early to fold; it is too early to sell. We are going higher.
Thank you for reading.
Namaste.
ETH 1H — Decision Point Ahead
ETH just confirmed a bullish RSI divergence, with price finding support at the 200MA.
MACD supports the move, and the trend structure is clean: MLR > SMA > BB Center.
Now, price is hovering at the 0.236 Fib level.
A few strong closes above it could open the door for more upside.
If rejected, we might revisit the 200MA for another test.
Either way — we’ll find out soon.
Always take profits and manage risk.
Interaction is welcome.

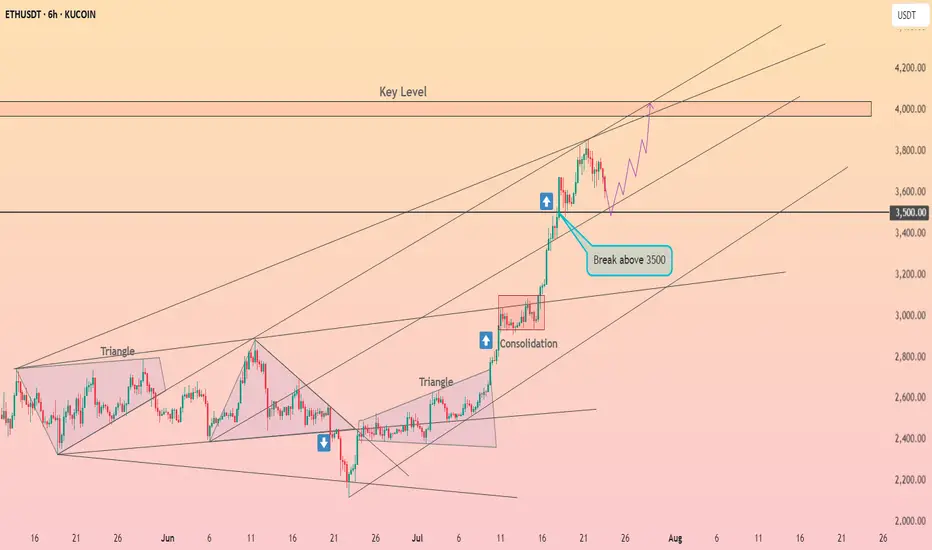
Ethereum will retest $3,500 ┆ HolderStatOKX:ETHUSDT bounced from $2,875 and is approaching $3,100. Breakout may target $3,250 next. Bullish structure remains.
ETH Dominance – Golden Cross, New Era?This is ETH Dominance on the Daily chart.
A golden cross just printed, and the last time we saw this, at similar levels, was February 2020. Back then, dominance climbed steadily, bouncing off the 200MA repeatedly.
Today, price is approaching the 0.236 Fib level, which could act as short-term resistance and send us back to retest the 200MA as support.
But unlike 2020, everything has changed:
– ETH is getting institutional support via ETF flows
– The SEC confirmed ETH is not a security
– The RWA narrative is gaining serious traction
That’s why this golden cross could mean more than just a signal, it may be the start of a much stronger structural uptrend.
My humble guess?
ETH Dominance continues climbing with the 200MA as support.
It won’t be a smooth ride, but the direction might be set.
Always take profits and manage risk.
Interaction is welcome.

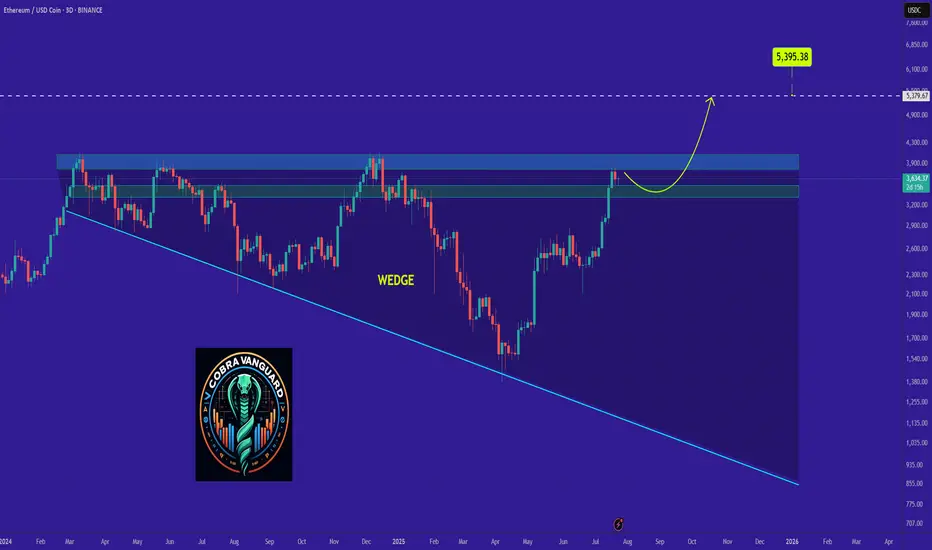
ETH's situation+ Target PredictionThe price has reached the upper boundary of the wedge, which could lead to a slight price drop. We can be hopeful that after breaking out of the wedge, we will see significant price growth.
Give me some energy !!
✨We spend hours finding potential opportunities and writing useful ideas, we would be happy if you support us.
Best regards CobraVanguard.💚
_ _ _ _ __ _ _ _ _ _ _ _ _ _ _ _ _ _ _ _ _ _ _ _ _ _ _ _ _ _ _ _
✅Thank you, and for more ideas, hit ❤️Like❤️ and 🌟Follow🌟!
⚠️Things can change...
The markets are always changing and even with all these signals, the market changes tend to be strong and fast!!
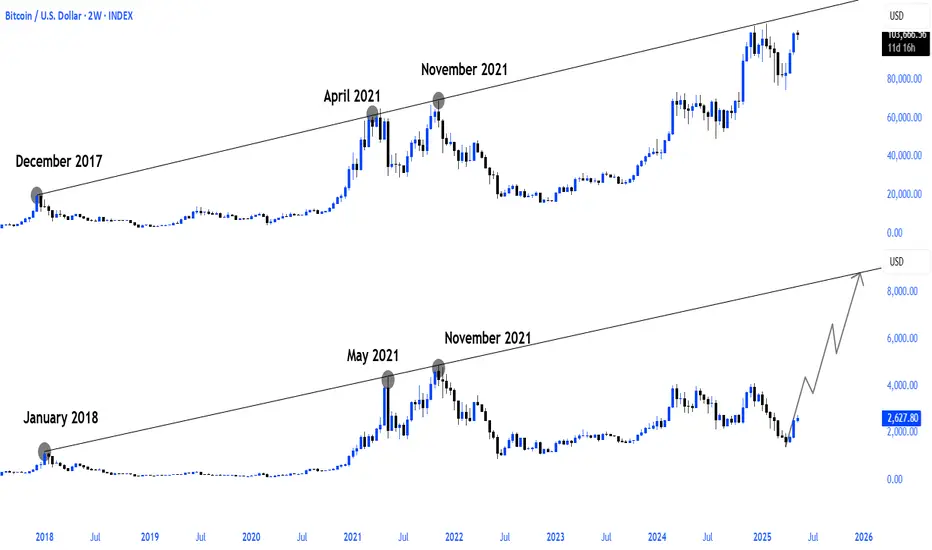
btc vs. ethBitcoin vs. Ethereum 🔃
It is obvious that Ethereum has not yet made a real run compared to other cycles compared to Bitcoin, and I think that the current correlation gap will close in the coming period.
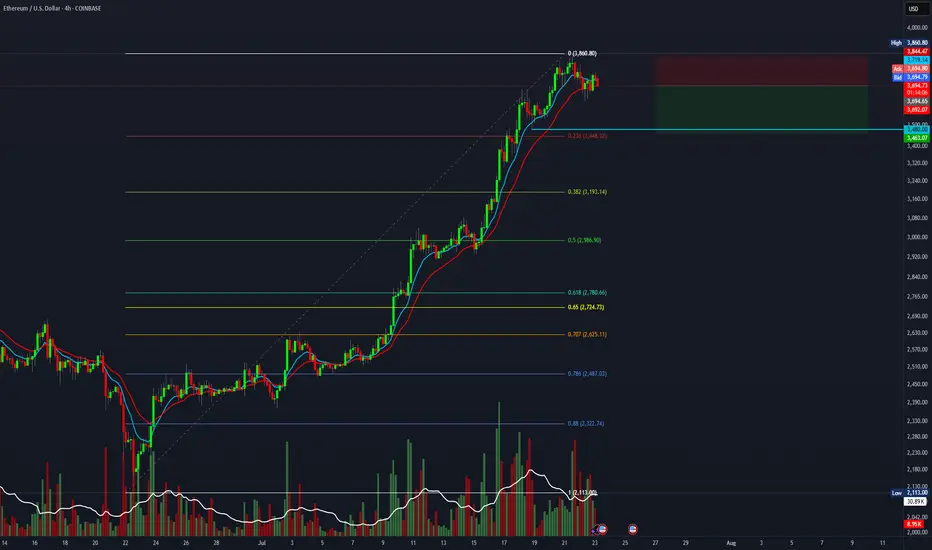
$ETH Hit Our Targets and was rejectedCRYPTOCAP:ETH hit our signal take profit target at $3820 and was rejected at the High Volume Node EQ to the penny.
That appears to have completed wave 3 of this motif wave. Wave 4 has an expected target of the R2 daily pivot and 0.236-0.382 Fibonacci retracement, $3260 before continuing to the upside in wave 5 with a target of the all time high.
This aligns with my views of a significant pullback at the end of August and September which is typical after a summer rally.
No divergences yet in daily RSI.
Safe trading

Ethereum is Trending HigherSince April trough, Ethereum has risen by 179%, delivering a higher rate of return than Bitcoin at 66%. But most of our attention is on Bitcoin, breaking above the 120,000 level.
Why is Ethereum quietly gaining ground —and what does the future hold for Ethereum?
Mirco Bitcoin Futures and Options
Ticker: MET
Minimum fluctuation:
$0.50 per ether = $0.05 per contract
Disclaimer:
• What presented here is not a recommendation, please consult your licensed broker.
• Our mission is to create lateral thinking skills for every investor and trader, knowing when to take a calculated risk with market uncertainty and a bolder risk when opportunity arises.
CME Real-time Market Data help identify trading set-ups in real-time and express my market views. If you have futures in your trading portfolio, you can check out on CME Group data plans available that suit your trading needs tradingview.sweetlogin.com

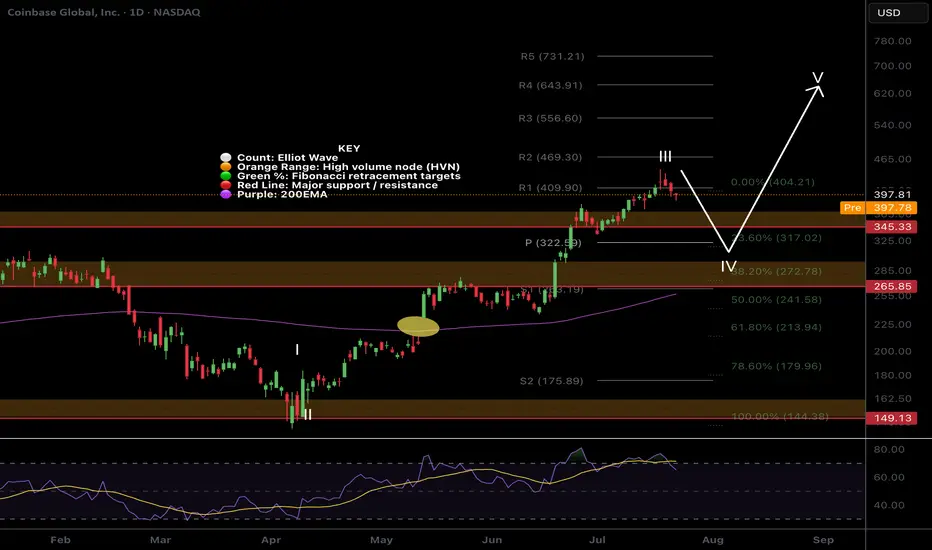
$COIN Wave 4 pullback?NASDAQ:COIN had a tremendous run, a text book Elliot wave 3 but has confirmed bearish divergence on the daily RSI.
The trend is strong so wave 4 could be shallow, only reaching the previous all time high, High Volume Node and 0.236 Fibonacci retracement and daily pivot point between $322-345
Further decline brings up the High Volume Node support at 0.382 Fib retracement and ascending daily 200EMA! Also a highly probable scenario!
Long term outlook remains around $600 target
Safe trading.
Ethusdt buy / long setupEth has a good pullback yesterday. Eth showing strong momentum against all the market. Long at cmp 3641, first tp is 3960 the next is 4.1k. must use sl.

Short swing setup on ETH, targeting 1.5R.It's time for a healthy pullback on ETH. This short setup offers a 1.5:1 risk-to-reward ratio with a target of $3,500.
Entry at $3,725
Stop loss at $3,850
Target at $3,500.
Ethereum Update · Minor Break Below $4,000, Nothing ChangesOk. Straight up has been confirmed but as you already know, the market never moves straight down neither straight up. It seems Ethereum is about to take a small break. This shouldn't alarm you nor be a concern, we are set for sustained long-term growth. When bullish momentum dies down, the market tends to take a break, a pause, before additional growth.
Please remember that these breaks are very tricky, they can last just a few days, say 3-6 days, just as they can go for weeks. It is very hard to predict. In fact, we don't try to predict the duration of those, we simply focus on the bigger picture and know that a new all-time high will be hit in the coming months. This new all-time high will be followed by additional growth.
The short-term can be tricky though. Ethereum will continue rising, but watch out, it can make a pause and this time can be used wisely to profit beautifully from smaller altcoins. Don't let your capital just sit around when it can grow.
Ethereum is awesome but it is also a giant. The smaller altcoins is where the true opportunities lie. The opportunity to quadruple in a matter of months. And this process can be repeated several times for the duration of the bullish cycle.
Namaste.
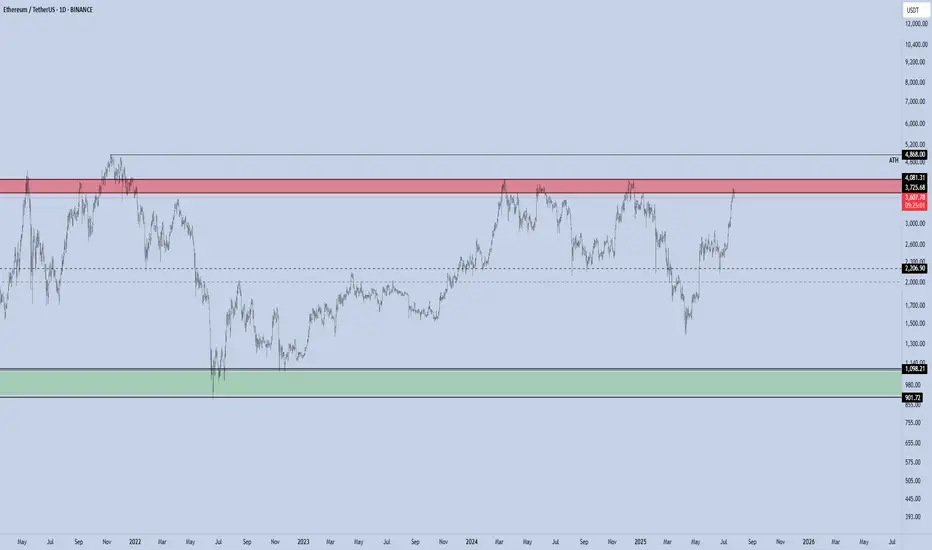
ETH - Altseason ??ETH has rallied sharply and is now entering the major resistance zone between $3,725 and $4,081, which has repeatedly acted as a local top during previous cycles.
This red zone represents a high-supply area, and historically ETH has struggled to break and hold above it without a significant catalyst.
Rejection here could lead to a pullback toward the $2,300–$2,000 range.
A clean breakout and weekly close above $4,081 would flip this resistance into support and open the path toward the all-time high (ATH) at $4,868.
If ETH reclaims this red zone and flips it to support, it will act as a major trigger for a broad Altseason.
Historically, such ETH strength is a key confirmation that capital is rotating from BTC into the altcoin market.
Currently, momentum is favoring bulls unless this red supply zone causes a strong rejection.
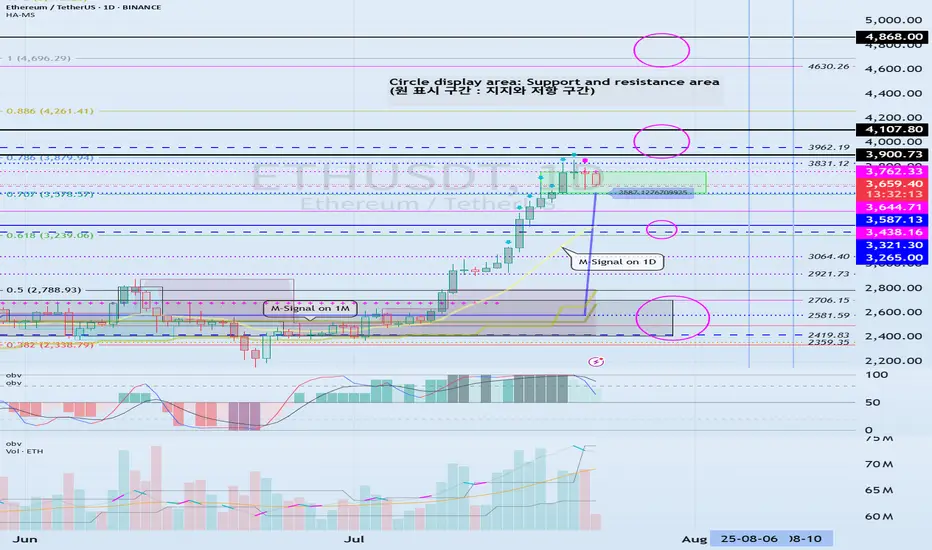
Check if HA-High indicator is forming at 3587.13
Hello, traders.
If you "Follow", you can always get the latest information quickly.
Have a nice day today.
-------------------------------------
(ETHUSDT 1D chart)
HA-High indicator is showing that it is about to form at 3587.13.
Accordingly, if the HA-High indicator is newly created, the support in the 3587.13-3762.33 section is an important issue.
If it falls below 3587.13, it is likely to touch the M-Signal indicator on the 1D chart.
Therefore, we should check whether it touches the area around 3265.0-3321.30 and rises.
-
This can be seen as a time to test whether it will continue the first step-up trend while rising in the important section of 2419.83-2706.15.
ETH's volatility period is around August 6-10, but we should check what kind of movement it shows after passing the volatility period of BTC.
-
Thank you for reading to the end.
I hope you have a successful transaction.
--------------------------------------------------
- This is an explanation of the big picture.
(3-year bull market, 1-year bear market pattern)
I will explain more details when the bear market starts.
------------------------------------------------------
People don't like the truth! Let's be honest, people don't like honesty. They prefer ideas that affirm their own beliefs.
When I read articles and posts from newer traders, it's often from a place of "all in" diamond hands and the notion that things go up forever.
I've been a trader for over 25 years now, and the game isn't about making a quick buck, it's about making money over and over again. This got me thinking, the issue is when you deal with a small account you require leverage, small timeframes and of course the "shit" or bust mindset. If you lose a thousand dollars, $10,000 even $100,000 - what does it matter? That's no different than a game of poker in Vegas.
The idea of being 80% in drawdown, is alien to me. The idea of one trade and one win is also a crazy notion.
Instead of playing with the future, there is an easier way to work. This isn't about slow and boring, it's about psychology and discipline. 10% returns on a million-dollar account isn't all that difficult. Instead of aiming for 300x returns on an alt coin (due to the account size being tiny) You can make less of a percentage gain with a larger account size.
In terms of psychology - the word " HOPE " is used, way too often, it's used when you hope a stock or the price of Bitcoin goes up, it's used when you hope the position comes back in your favour, it's used when you want your 10,000 bucks to double.
This isn't trading, it's gambling.
The truth is, it's not the winners that make you a good trader. It's the way you deal with the losses.
Once you learn proper risk management, a downtrend in a market move is a 1-2% loss coupled with a new opportunity to reverse the bias.
As a disciplined trader, the game is played differently.
Let's assume you don't have $100k spare - prop firms are a great option, OPM = other people's money.
Remove the risk and increase the leverage, all whilst trading with discipline.
The market goes through many phases, cycles and crashes.
You don't always need something as catastrophic to take place, but if you are all in on a position. You need to understand that losses can be severe and long-lasting.
When everyone sees an oasis in the desert, it's often a mirage.
You only have to look at the Japanese lesson in 1989, when the Nikkei was unstoppable-until it wasn't. For that short space in time, everyone was a day trader, housewives to taxi drivers.
Everyone's a genius in a Bull market.
Then comes the crash. The recovery time on that crash?
34-years!!!
I have covered several aspects of psychology here on TradingView;
When it comes to trading, if you are able to keep playing. It's a worthwhile game. If you are gambling, it's a game whereby the house often wins.
Right now, stocks are worth more than their earnings. Gold is up near all-time highs, crypto, indices the same.
All I am saying is if you are all in. Be careful!
Disclaimer
This idea does not constitute as financial advice. It is for educational purposes only, our principal trader has over 25 years' experience in stocks, ETF's, and Forex. Hence each trade setup might have different hold times, entry or exit conditions, and will vary from the post/idea shared here. You can use the information from this post to make your own trading plan for the instrument discussed. Trading carries a risk; a high percentage of retail traders lose money. Please keep this in mind when entering any trade. Stay safe.
Ethereum Breakout Could Spark the Next Altseason!A Massive Altseason Is Brewing… 🚀
Ethereum just flashed a major monthly breakout after printing a clean Morning Star reversal right at key support.
Now it's pushing against the upper resistance zone, a structure that held it back for over two years.
If CRYPTOCAP:ETH breaks and closes above this level, it won’t just be bullish for Ethereum — it could ignite the biggest altcoin season since 2021.
Why it matters:
📌 ETH is the heart of the altcoin ecosystem.
📌Historical breakouts like this led to 1500%+ moves.
📌The pattern and price action are lining up perfectly again.
Once Ethereum breaks cleanly above $4,000, expect altcoins to explode across the board — Layer 2s, DeFi, AI tokens, and even the meme coins could all start flying.
Keep your eyes on ETH. Its breakout is the spark… the altseason fire is coming.
DYOR | Not Financial Advice

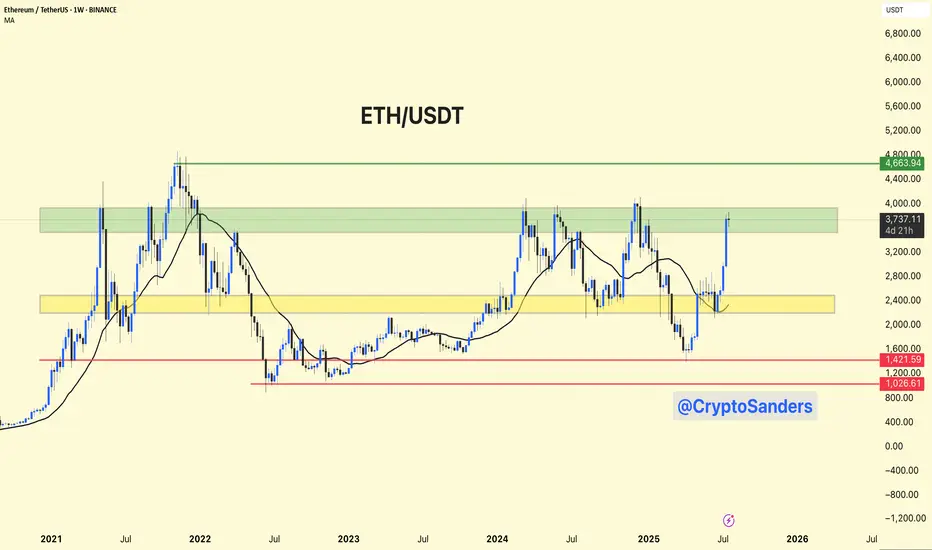
ETH/USDT – Weekly Chart Analysis !! ETH/USDT – Weekly Chart Analysis
ETH is testing a major historical resistance between $3,700 – $4,000 (highlighted green zone).
A clean breakout above this level could push price toward the next key resistance at ~$4,660.
Previous accumulation zone around $2,400 – $2,800 (yellow box) now acts as strong support.
Long-term floor at $1,420 and $1,025, though currently far below.
Bullish Breakout Potential: If ETH sustains above the green resistance, it may retest $4,660+.
A failure to break above $4K could lead to a healthy pullback toward the yellow zone (~$2,800).
Stay updated and manage your risk accordingly.
DYOR | NFA
ETH: Eyes Resistance, But Correction Still LoomsEthereum has also seen a modest pullback since yesterday morning, but here too, it’s too soon to confirm a high for turquoise wave B. Accordingly, we anticipate further gains in this corrective rally—potentially up to resistance at $4,107—before the subsequent turquoise wave C takes over and drives the price down into the green long Target Zone ($935.82–$494.15). Within this range, we primarily expect the low of the wave- correction, which has now lasted more than four years, setting the stage for a long-term trend reversal to the upside. According to to our alternative scneario, magenta wave alt.(1) would complete with the next high. The following pullback, attributed to wave alt.(2), would then only extend into the slightly adjusted magenta Target Zone ($2,622–$1,914) before a move to new all-time highs (probability: 35%).
📈 Over 190 precise analyses, clear entry points, and defined Target Zones - that's what we do (for more: look to the right).

gold vs ethIf we follow this fractal, we should top around $4k and then a pullback to $3k followed by news highs in Q4