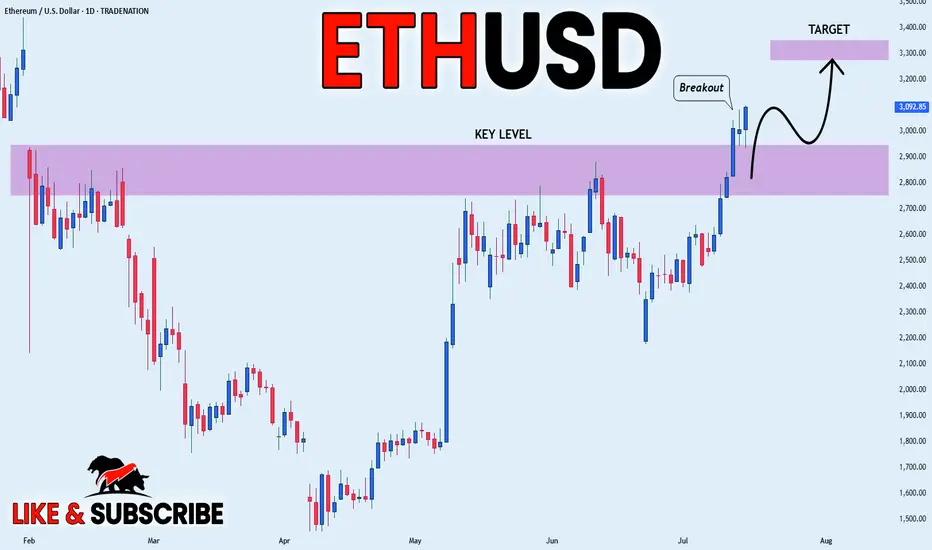
ETHEREUM WILL KEEP GROWING|LONG|
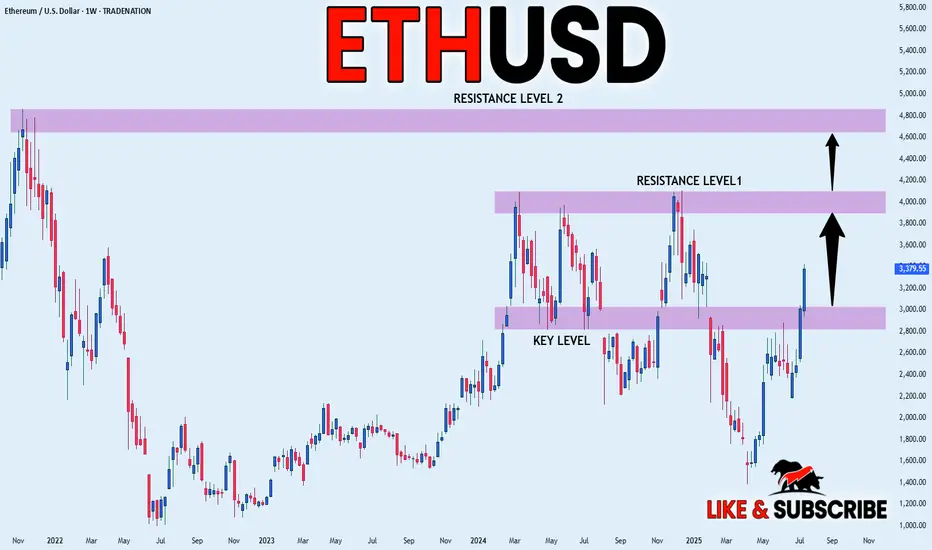
✅ETHEREUM is trading in a
Strong uptrend and the coin
Broke the important horizontal level
Of 3000$ which is now a support
And we are very bullish biased
And we think that ETH will
Reach at least the previous ATH
Of just short of 5000$ but the
First target is to reach and break
A resistance level of 4100$
LONG🚀
✅Like and subscribe to never miss a new idea!✅
Disclosure: I am part of Trade Nation's Influencer program and receive a monthly fee for using their TradingView charts in my analysis.
J-ETH
#ETH Update #4 – July 17, 2025#ETH Update #4 – July 17, 2025
Ethereum is currently facing a significant resistance zone. The recent bullish move has been very steep, which often leads to a correction. If that happens, the first potential retracement level is around $3,010.
If Ethereum continues to rally without correcting, the next upside target is $3,700. However, USDT Dominance has reached a support level. If that support holds, we could see capital rotation into USDT, accelerating a pullback in ETH.
At this point, a slowdown in Ethereum’s momentum is likely. If you're holding altcoins, it might be a good moment to take some profits.

BRIEFING Week #29-30 : BTC stalling, ETH & then Alts ?Here's your weekly update ! Brought to you each weekend with years of track-record history..
Don't forget to hit the like/follow button if you feel like this post deserves it ;)
That's the best way to support me and help pushing this content to other users.
Kindly,
Phil

Major Breakout– Ethereum Broke Free from 'Clashing Resistances'🚀💥 Major Breakout – Ethereum Broke Free from the Clashing Resistances 🔓🟣
ETH has finally done it.
After months of battling overlapping resistances — the Clashing Stones, as we called them — Ethereum has broken out, and $2,912 is now acting as support, not resistance.
This breakout isn't just technical, it’s structural.
The previous 1-2-3 rejection setup has now been invalidated.
🔎 Chart Summary:
✅ $2,912 = confirmed breakout zone
🎯 Destination 1: $4,881 (if Vitalik’s asleep 😴)
🚀 Destination 2: $6,443 (if he wakes up 💡)
🔭 Scroll up for Destination 3
This is the real ETH breakout we’ve waited for — not hopium, not chop. This is clear structure.
If BTC stabilizes near 114,921+, ETH could enter outperformance mode and gain serious traction on the ETH/BTC chart.
📢 Keep your eyes on narrative catalysts:
ETH ETF, L2 growth, and Vitalik waking up...
We are officially off the resistance — and heading to where few have charted before.
One Love,
The FXPROFESSOR 💙
📌 Long — as long as $2,912 holds. If it fails, you already know what to do.
Disclosure: I am happy to be part of the Trade Nation's Influencer program and receive a monthly fee for using their TradingView charts in my analysis. Awesome broker, where the trader really comes first! 🌟🤝📈

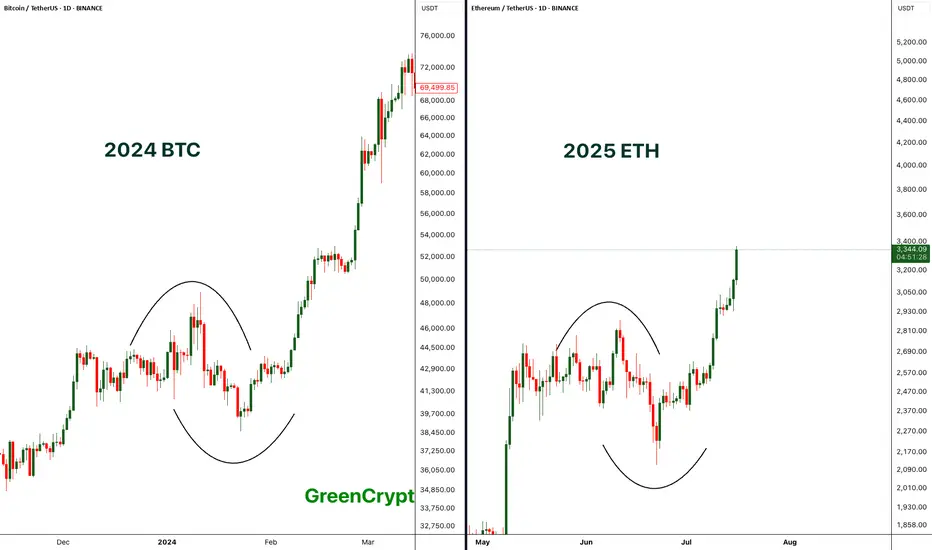
Comparing BTC 2024 with ETH 2025 - Perfect Match- If compare the chart pattern of BTC from 2024 with the current 2025 ETH pattern, wee see exactly similar chart patterns being formed here.
- Price started consolidating then it had fake breakout towards both the sides and finally the real breakout.
- BTC breakout push the price towards the new all time high above 69K, if we ETH follows similar trend then we can expect new all time high on ETH.
Let's see how it plays out.
Stay tuned for more updates.
Cheers
GreenCrypto
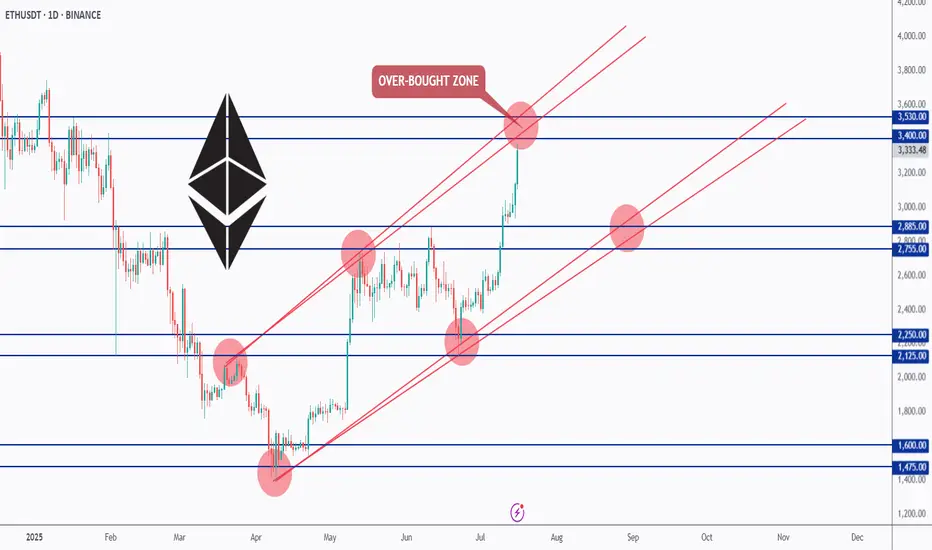
ETH Testing Overbought Zone — What’s Next?📊ETH has been overall bullish, trading inside this rising red channel for months.
After breaking above the $2,885 resistance, bulls took full control, and price is now approaching the upper red trendline — an overbought zone where we’ve seen rejections before.
As long as ETH holds above the $2,885 zone, the bulls remain in control. But since we’re near a strong resistance and the top of the channel, we’ll be waiting for a potential correction or at least a slowdown in momentum before looking for fresh entries.
📌 Key levels to watch:
Resistance: $3,400 – $3,530
Support: $2,885 – $2,755
Let’s stay patient and follow the market’s lead. 🧠
Let me know your thoughts in the comments 👇
📚 Always follow your trading plan regarding entry, risk management, and trade management.
Good luck!
All Strategies Are Good; If Managed Properly!
~Richard Nasr
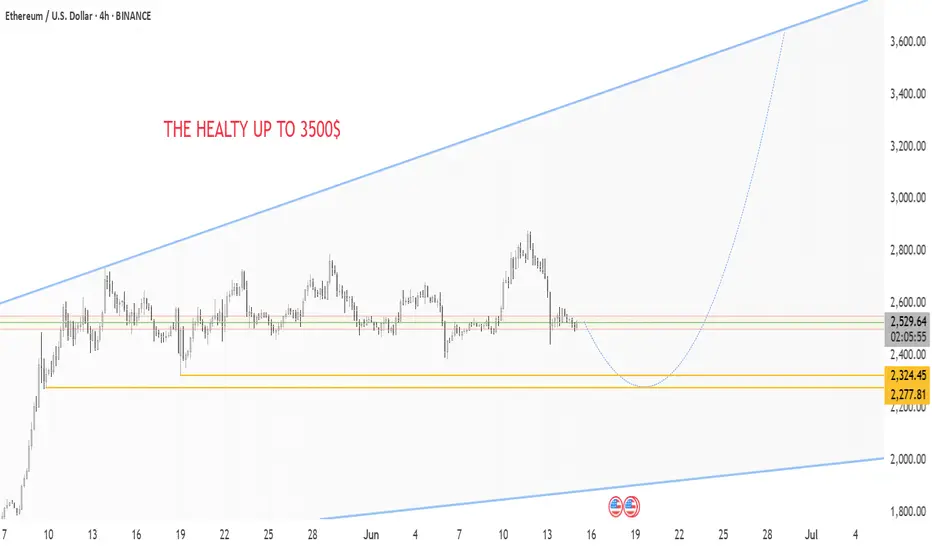
ETH/USD: The Great Ethereum Bounce is HERE!🚀 THE MOON MISSION (Resistance Zone)
HEALTY TARGET: $3,500 - Your text says it all!
Upper Trendline: Acting as launch pad
Psychological Resistance: $3,000 round number
🟢 CURRENT LAUNCH PAD
Price: $2,529.15 - Breaking above key resistance
Previous Resistance: $2,324.45 - Now turned support
Support Zone: $2,277.81 - Strong foundation
🔴 DANGER ZONE (Abort Mission)
Critical Support: Lower trendline around $2,000
Major Support: $2,277.81 level must hold
💡BUY ZONE: $2,100 - $2,180 🎯
⚠️STOP LOSS: $1999 (Previous resistance) ⚠️
TAKE PROFIT 1: $2,650 (Take 50% profits) 🔥
TAKE PROFIT 2: $3,300 (Let winners run!) 🔥
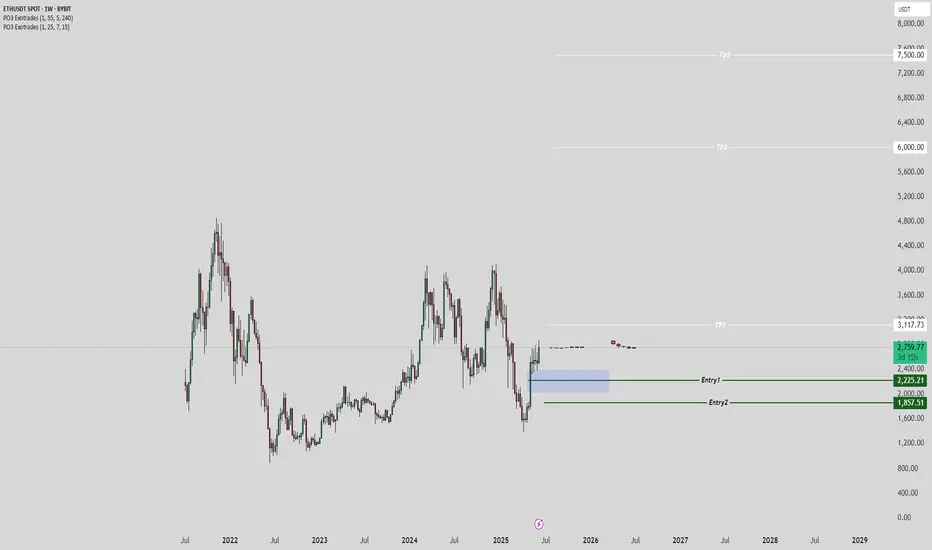
Ethereum's Road to $7500 – Strategic Entries & Profit Optimizati🔵 Entry Zone: My first position is placed at $2225.5, aligning with a strong support level, while a secondary entry at $1857.5 serves as an additional safeguard against unexpected market swings—lowering my average purchase price and protecting capital.
💰 Profit-Taking Strategy: For low-risk traders, securing a 40% profit from the first entry is a prudent move to lock in gains early. However, my long-term target remains ambitious.
🚀 Main Target: Based on valuation models and fundamental news, Ethereum’s upside potential points toward $7500. However, I personally plan to secure 90% of my holdings at $6000, ensuring strong profit realization while leaving room for further upside.
This setup balances risk management, smart positioning, and strategic profit optimization. Let’s see how ETH’s trajectory unfolds!
Entry1: 2225.5
Entry 2: 1857.5
If your second entry is successful, you are required to withdraw 50 to 70 percent of your capital to maintain your capital. I will definitely update this setup.
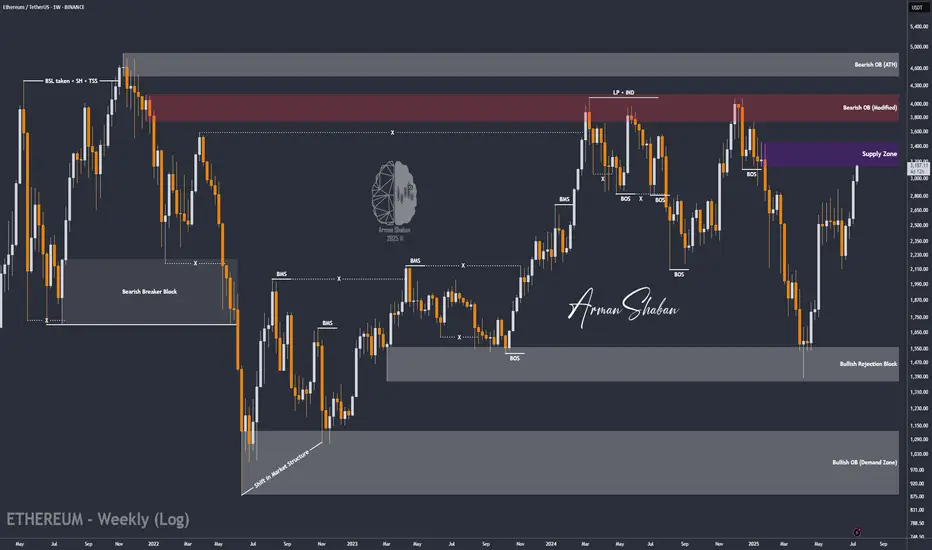
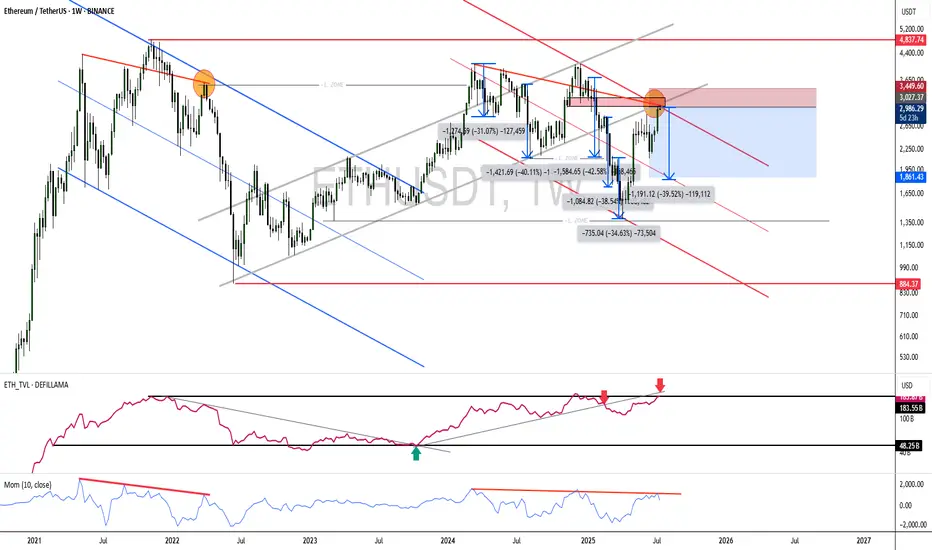
ETH/USDT : $3000 Reached, It's time foe $4000? (READ)By analyzing the Ethereum chart on the weekly timeframe, we can see that the price has finally broken the strong $2700 resistance and pushed toward the next target at $3000! Currently trading around $3150 and now within the $3130–$3440 zone, I expect a short-term rejection from this area. However, given the overall market trend, this level may not hold for long, and we could soon see a breakout toward the next targets at $3500, $3740, $4100, and $4470!
Please support me with your likes and comments to motivate me to share more analysis with you and share your opinion about the possible trend of this chart with me !
Best Regards , Arman Shaban
THE LATEST ANALYSIS :
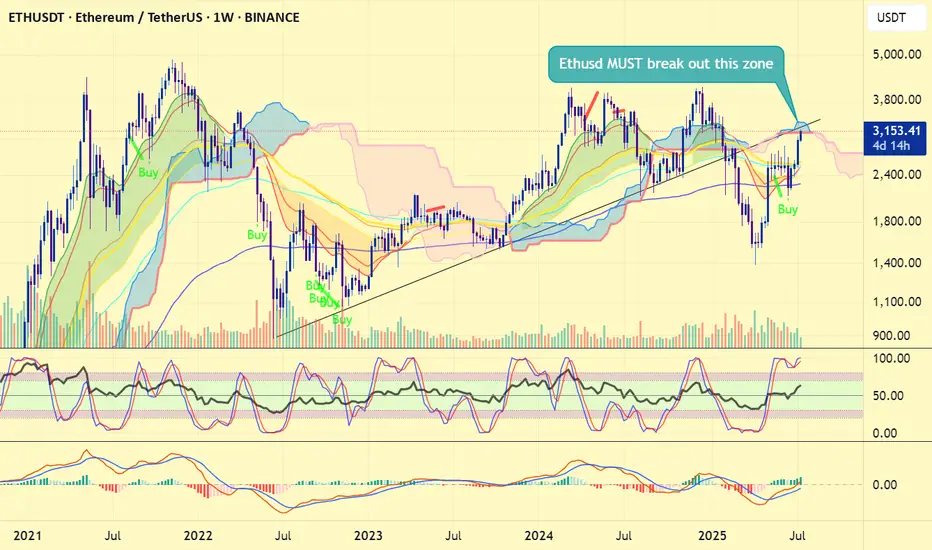
Ethereum price is critical now#ethereum #eth price is now testing very very important resistance zone now and this also the bearish retest if #ethusd fails to leap over 3500 usd. 4 months ago, #ethusdt breakdown the 3 years of trendline, heavily dumped below 1400 usd and bounced. Now, CRYPTOCAP:ETH is testing this 3 years of trendline resistance zone + weekly ichimoku cloud.
Therefore ETH price has no other chance to at least reclaim 3450 - 3500 usd. True bullrun requires a new ATH. Heavy declination at current zone will not be tasty. This week' s close will determine the things i think.
Not financial advice.
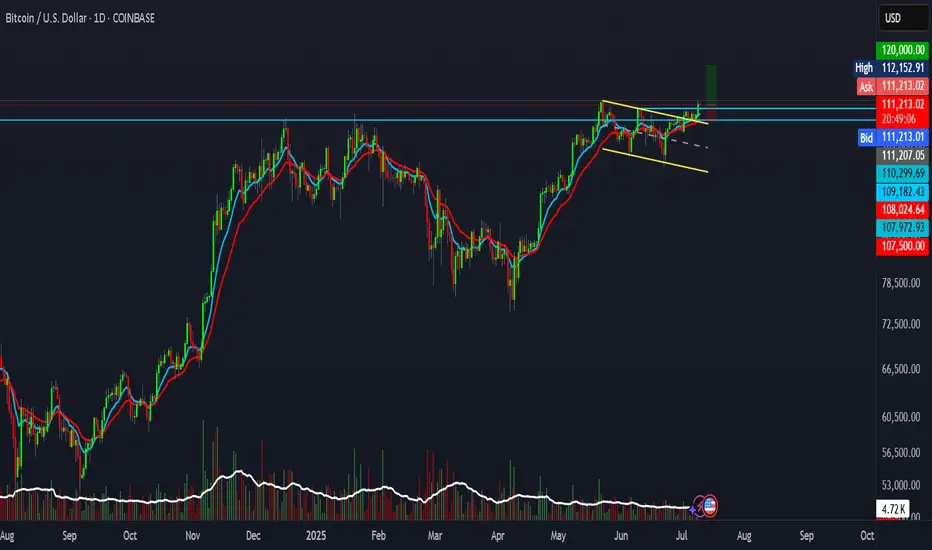
BTC setup with 2R R:R.BTC is showing signs of a real breakout.
This setup offers a 2:1 risk-reward ratio.
Entry: 111,207
Stop Loss: 107,500
Target: 120,000
Not financial advice.
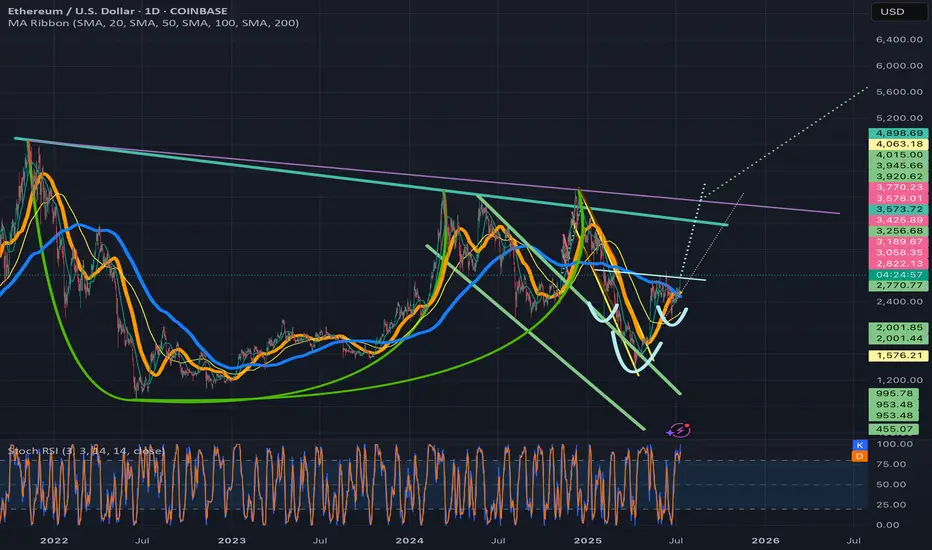
Ethusd breaking above invh&sEthusd chart has a similar set upas the total2 chart, a cup and handle that is breaking up from a smaller inverse head and shoulders that will complete the handle to the cup. Ethereum actually has two potential to trendlines for its cup and handle and I wouldn’t be surprised if both are valid. The breakout target for the inverse head and shoulder pattern will take price action above both of them. Once we solidify the top trendline for the cup and handle patterns as support the breakout target for it is $7161. Ethereum just recently had a golden cross on the daily which adds to the probability the inverse head and shoulder pattern breakout will be validated. *not financial advice*
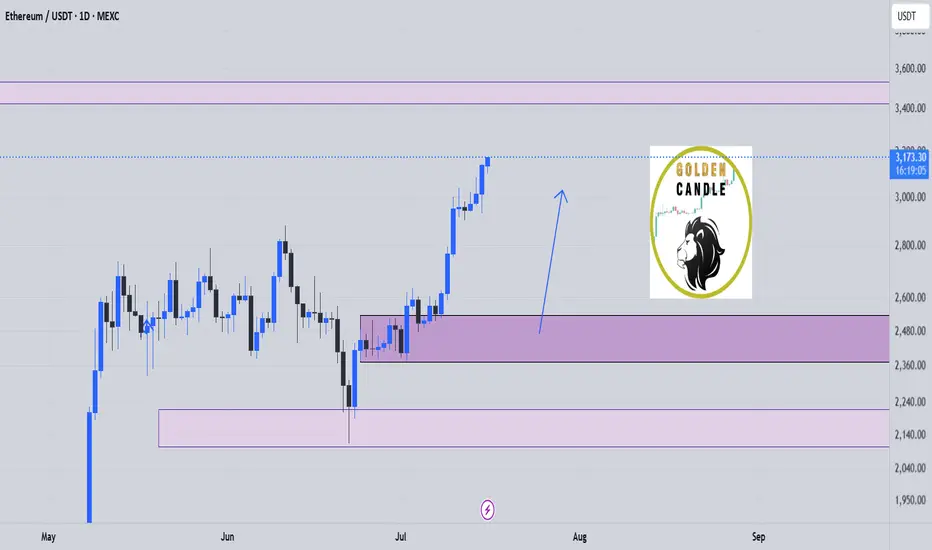
eth buy longterm"🌟 Welcome to Golden Candle! 🌟
We're a team of 📈 passionate traders 📉 who love sharing our 🔍 technical analysis insights 🔎 with the TradingView community. 🌎
Our goal is to provide 💡 valuable perspectives 💡 on market trends and patterns, but 🚫 please note that our analyses are not intended as buy or sell recommendations. 🚫
Instead, they reflect our own 💭 personal attitudes and thoughts. 💭
Follow along and 📚 learn 📚 from our analyses! 📊💡"
ETH might just be setting up for a monster move!Something BIG is brewing with #Ethereum...
👀 And it’s being quietly triggered by a law almost no one was talking about, till today.
A new rally could be closer than you think. Here's the full story 🧵👇
Last month, the U.S. Senate passed the Genius Act — the first serious law aimed at regulating stablecoins.
Sounds boring? It's not.
Because this act could light a fire under ETH... and hardly anyone sees it coming.
Stablecoins like CRYPTOCAP:USDC will soon have clear rules to follow.
That opens the doors for banks, funds, and institutions to use them legally — and massively.
And who benefits most from that? You guessed it: Ethereum.
Ethereum hosts nearly 50% of ALL stablecoin supply.
It's the core infrastructure of the stablecoin economy.
That means:
More stablecoin adoption → More activity on ETH → More gas fees → More ETH burned.
And it doesn’t stop there.
Right now, Ethereum handles about 60% of all stablecoin transactions.
Tron is in second place… with just 15%.
This is ETH's game to lose.
Here’s where it gets juicy:
ETH gas fees = ETH getting burned.
Rising stablecoin usage doesn’t just mean more revenue for the network…
It means less ETH in circulation.
And you know what that does to price.
Oh — and the smart money knows.
Since mid-2024, ETH whales have been quietly accumulating.
Whale holdings just hit their highest level since 2021.
Last time that happened?
Right before a massive rally.
Also… Ethereum activity is already spiking on-chain.
Transaction volume is rising, fast.
The last two times we saw this setup?
🔹 2016–2017
🔹 2020–2021
ETH went on to crush ATHs both times.
Circle — the company behind USDC — just IPO’d in June.
Their stock? Skyrocketed!
The stablecoin dominoes are falling fast...
And Ethereum is sitting at the center of it all.
To sum it up:
✅ Regulatory clarity (Genius Act)
✅ Institutional greenlight for stablecoins
✅ ETH is the foundation
✅ Whales accumulating
✅ On-chain activity heating up
✅ Supply burn kicking in
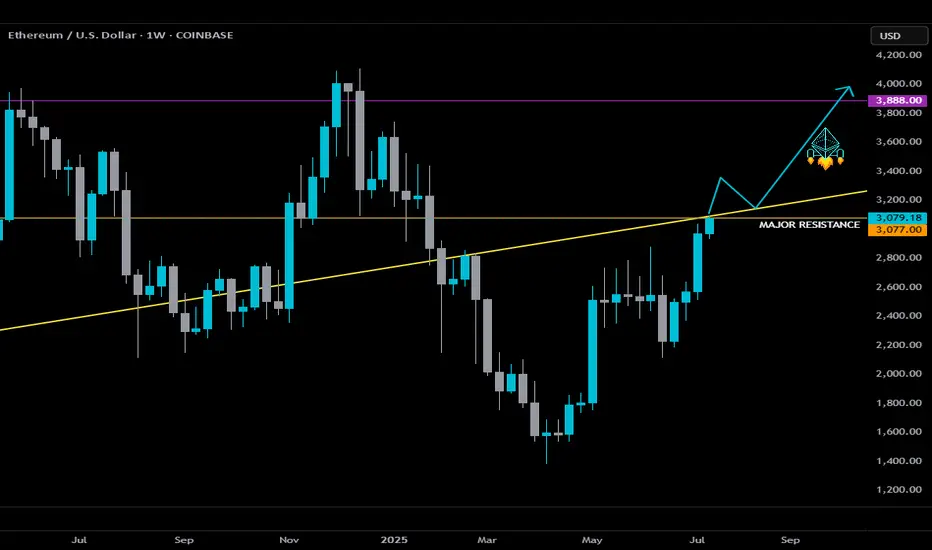
The House just rejected a key vote on the GENIUS Act.
🚨 Regulatory momentum just hit a speed bump — but the charts will tell you the real story.
Pass or fail... ETH might just be setting up for a monster move.
Here’s the set up…
If ETH can secure a Weekly close above the orange major resistance and confirm a breakout above the yellow ascending trendline, we could experience LIFTOFF. 🚀
NFA... For edutainment purposes only!
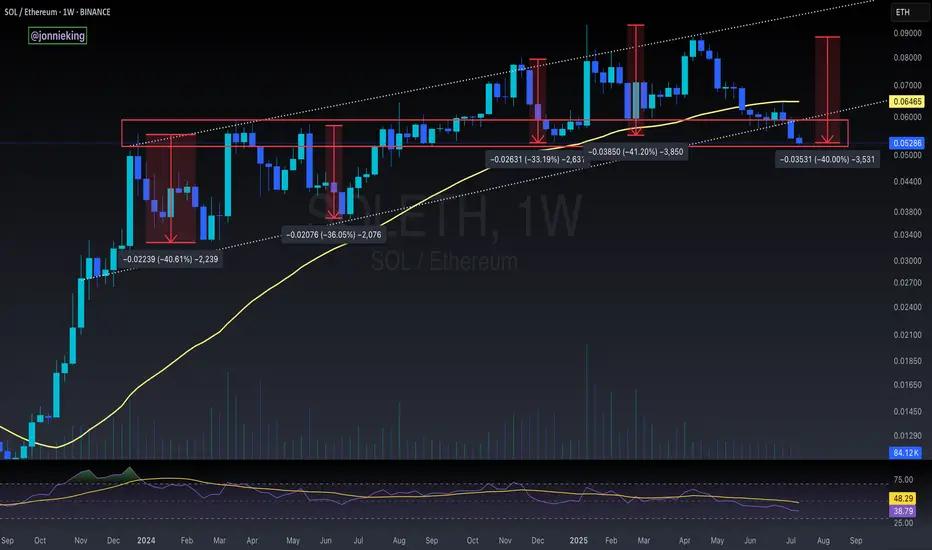
SOL / ETH at Critical Inflection PointSOL / ETH loses the 50WMA.
Has been trading below it for the past 7 weeks, something we haven't seen since 2021.
Has also broken down from the 8 month bull flag / parallel channel. Retesting the key POI I've been eyeing.
HOPIUM: We've seen great rallies after CRYPTOCAP:SOL goes down ~40% vs CRYPTOCAP:ETH , which it is at now. We SHOULD see a turnaround here soon.
And I still believe SOL will greatly outperform ETH this cycle, especially when the ETF launches and Alt Season kickstarts.
Right now we're seeing a typical market cycle BTC > ETH > Large Caps > Mid Caps > Micro Caps
ETHEREUM WILL KEEP GROWING|LONG|
✅ETHEREUM is going up
Now and the coin made a bullish
Breakout of the key horizontal
Level of 3000$ and the breakout
Is confirmed so we are bullish
Biased and we will be expecting
A further bullish move up
LONG🚀
✅Like and subscribe to never miss a new idea!✅
Disclosure: I am part of Trade Nation's Influencer program and receive a monthly fee for using their TradingView charts in my analysis.
HolderStat┆ETHUSD prepare for a breakthroughBINANCE:ETHUSDT is trending upward with strong conviction after triangle breakouts and clearing the $2,900 level. Structure points toward a move into the $3,300–$3,400 region. The trend is reinforced by repeated bullish retests and channel momentum.

ETH/USDTETH is showing a similar structure to BTC, with a visible gap in play. A partial or full fill of the gap, followed by a bullish structure break on lower timeframes, would be a strong signal of buyer strength.
Waiting for confirmation before acting.

#ETH Update #3 – July 15, 2025#ETH Update #3 – July 15, 2025
After its recent impulsive move, Ethereum appeared to make a slight correction. However, this correction did not complete and instead formed a second peak. Since a full correction hasn't played out yet, caution is still warranted when trading Ethereum.
The first correction level is around $2,850, the second around $2,780, and the third around $2,700. If Ethereum pulls back to the second correction level, it will balance out the second imbalance zone created during the last impulse, which could allow for a healthier continuation upward.
As long as Ethereum doesn't break down below the $2,900 zone, I do not expect a correction. But if it does break below $2,900, corrections are likely to occur one after another.
At this point, neither a long nor a short position seems suitable for Ethereum.

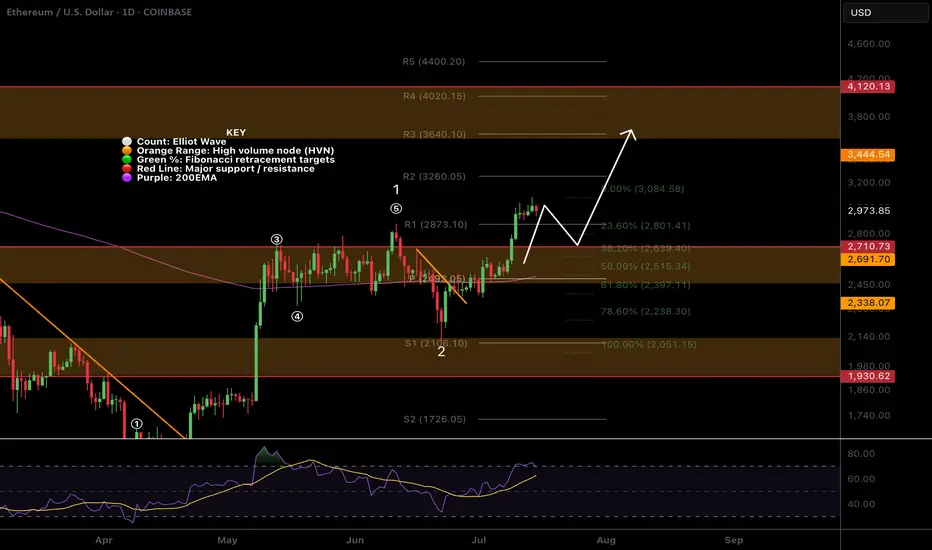
$ETH Pullback to $2630 Support?CRYPTOCAP:ETH has a great week pushing through resistance and making new local highs after testing the daily 200EMA and daily pivot as support.
Price is likely to retest the swing high and previous resistance as support around $2600-2700, also the .382 Fibonacci retracement.
RSI is printing daily bearish divergence in overbought from the wave (3) top to current as it did at the wave (5) top seeing large rejection. The retest of $2600 would reset RSI.
Price is ultimately set to test $3600 as the next resistance if the Elliot wave count is correct.
Analysis is invalidated below $2050
Safe trading
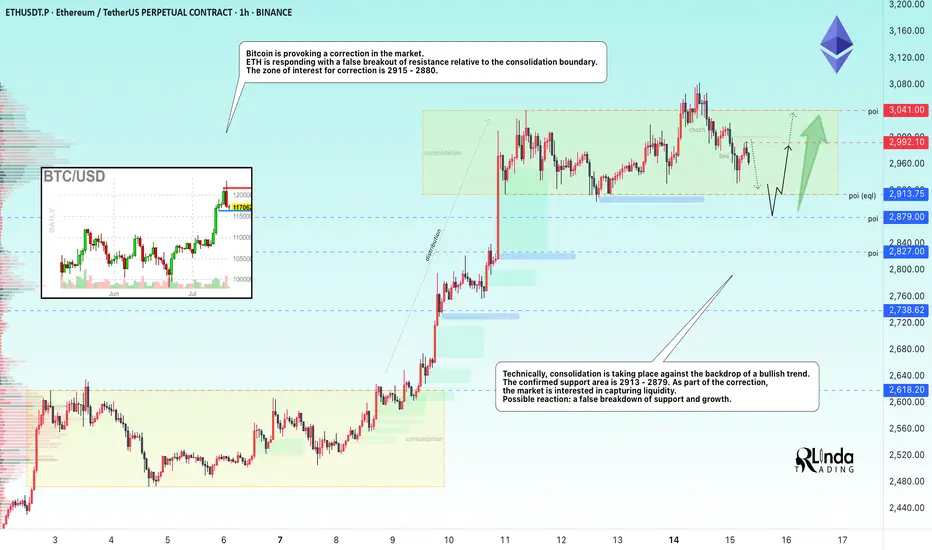
ETHEREUM → Correction to 2900 before growth BINANCE:ETHUSDT is entering a correction after a strong breakout of resistance. At the same time, Bitcoin is falling from 123K to 116K, triggering a pullback across the entire market...
On D1, ETH is facing strong resistance and is not yet ready to break it (it lacks strength after the rally). The most likely scenario after a false breakout is a correction to support. But the main focus is on Bitcoin — will there be a correction or a reversal of the local trend? If the flagship continues its decline, the cryptocurrency market will humbly follow suit.
ETH has a nearest zone of interest at 2913, where liquidity capture could attract buyers, but I do not rule out the possibility that the correction could go much deeper before further growth, for example to 2879-2827 (support on D1).
Resistance levels: 2992, 3041
Support levels: 2913.7, 2879, 2827
Technically, consolidation against a bullish trend. Confirmed support area 2913 - 2879. As part of the correction, the market is interested in capturing liquidity. If, against the backdrop of the current correction, the bulls manage to hold their ground above the specified support, ETH may still surprise us with its growth :)
Best regards, R. Linda!
Is ETH overextended and due for a correction?For those holding ETH, this is a good point to set up a hedge using derivatives.
If the price keeps going up (which I think is unlikely at this moment—perhaps it will move sideways), buying at these levels is crazy.
In fact, there’s been a recent rally, full of people on X and YouTube saying this is the big moment to buy… That immediately raises a red flag for me!
And what about the FEDFUNDS? Have you taken a look? Haha, just something to think about.
--
After a long time away from TradingView and the community, I’m back to breathe some life into it!
Missed you all — let’s enjoy life and make the most of what it has to offer!
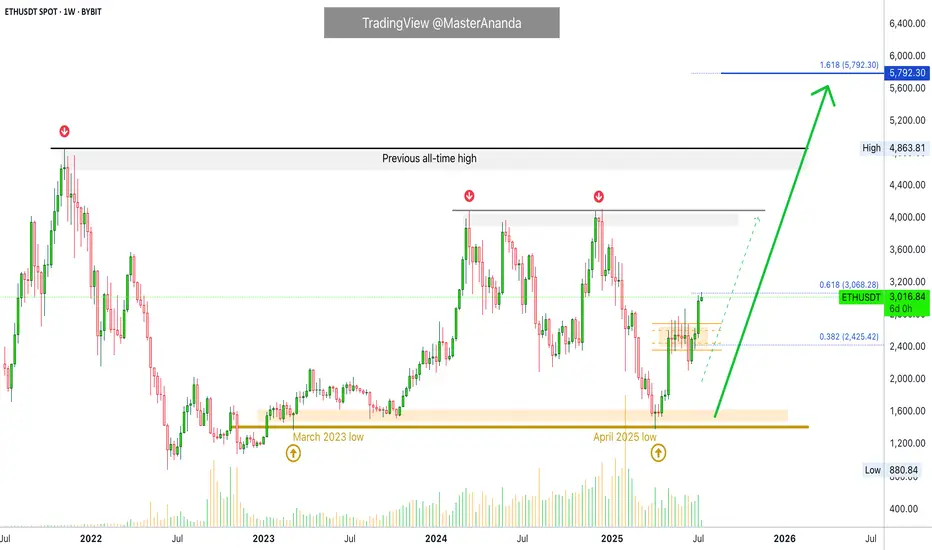
Can a Bear Market Start With Ethereum At $3,000?Ethereum produced sideways action for 49 days, 7 weeks. Immediately after seeing this I realized the next logical step was a bullish breakout, and the market moved up. But this isn't all. Ethereum is still trading at $3,000, more than $1,800 away from its all-time high.
Now, thinking about the doubt that always creeps up when the market becomes bullish confirmed, I want to clear things up if at least for you. While others can continue to doubt and will continue to do so, many others will even SHORT and lose everything, you will be happy knowing that the market will experience additional growth. You will also be making profits as the market grows. You will be happy because you know for a fact, based on data, that we are set to experience sustained long-term growth.
A bear market can only develop after a bull market. A bull market ends in a major high or new all-time high. Current conditions for ETHUSDT are far from being "peaky." There is no new all-time high. Actually, prices are still relatively low.
First Ethereum needs to challenge its previous all-time high, create a new one and then we can talk about a bear market or correction. We know for a fact that Ethereum is bullish based on recent price action and the chart. We know for a fact that Ethereum will grow because Bitcoin is already high up. Ethereum is the #2 Crypto and what Bitcoin does it tends to follow.
Bitcoin is super strong but this is not to be confused as weakness. Weakness comes when the market has been growing for too long, growth becomes heavy and a drop happens next. Strength happens when the market has been sideways for months, breaks up and produces a major advance (now). This type of pattern predicts additional growth.
Bitcoin is the king and what Bitcoin does the rest follows. You can expect additional growth.
The reason why the bullish cycle is not yet over is because prices are still too low. Many altcoins are trading near all-time lows. Think about it. A bear market develops from all-time highs and bull markets develop from all-time lows. We are only at the start of a major bullish cycle, phase and wave.
The proof is in the chart. A major low was hit 7-April 2025, the lowest since March 2023. This marks the end of the correction and the start of the 2025 bullish phase. I don't know if Ethereum will grow for years or only for a few months. I know with 100% certainty that the Cryptocurrency market will continue to grow. You can bet your house on it.
Thanks a lot for your continued support.
Namaste.