GBPUSD | 26.06.2025SELL 1.37400 | STOP 1.38200 | TAKE 1.36400 | After consolidation around the medium-term highs, a corrective downward movement is likely and price consolidation under the level of 1.37000.
J-GBPUSD

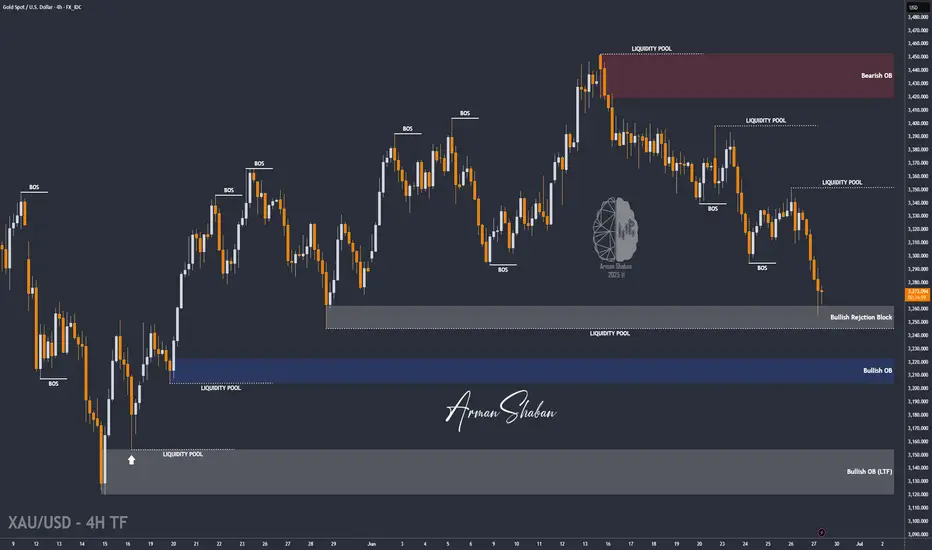
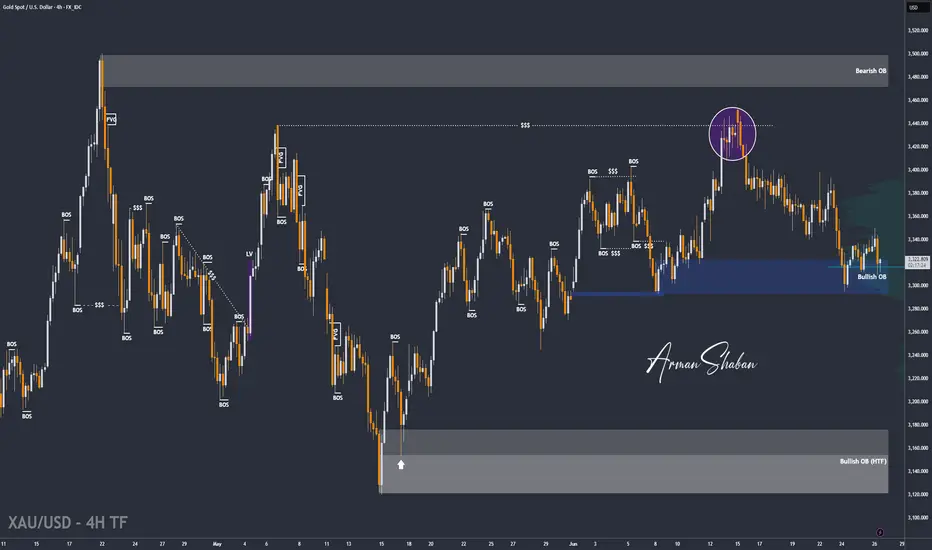
XAUUSD : Ready for More Upside Before Another Fall ?By analyzing the gold chart on the 4-hour timeframe, we can see that price initially followed our bullish scenario, climbing 140 pips up to $3336. However, after hitting that level, gold reversed and entered the bearish scenario, dropping below $3300 and eventually finding support around $3255.
This area acted as a strong demand zone, and we’ve since seen a rebound. Currently, gold is trading around $3273, and as long as price holds above the marked demand zone (Bullish Rejection Block), we may expect another bullish move before price potentially targets the liquidity below $3245 and $3203.
Please support me with your likes and comments to motivate me to share more analysis with you and share your opinion about the possible trend of this chart with me !
Best Regards , Arman Shaban
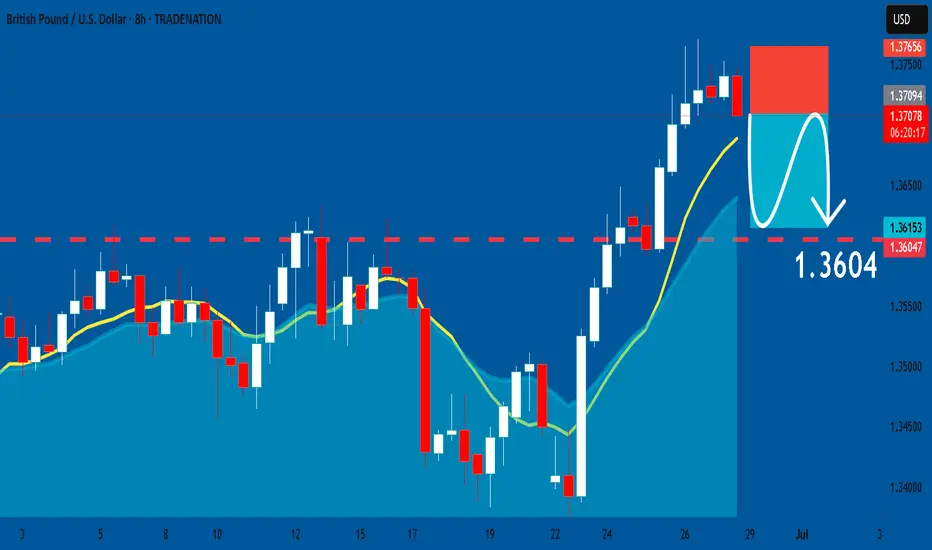
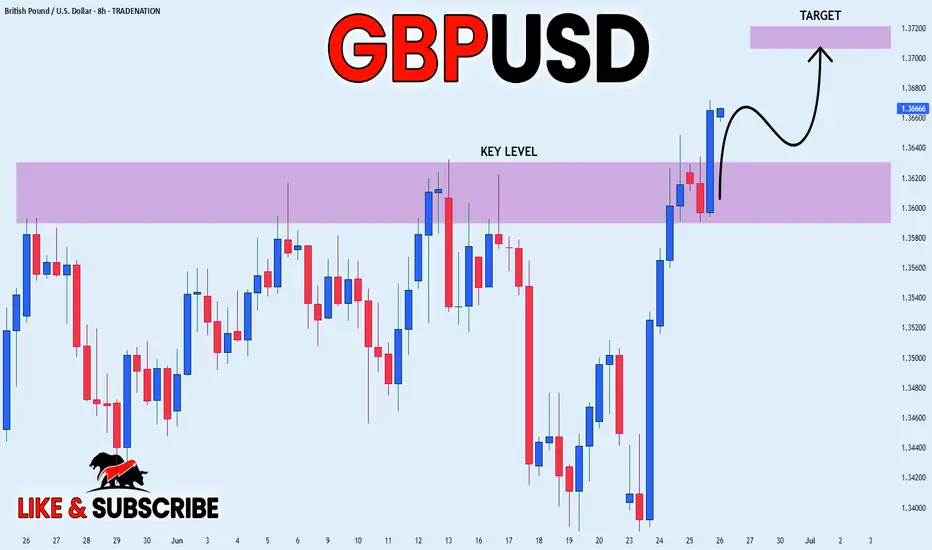
GBPUSD: Short Signal with Entry/SL/TP
GBPUSD
- Classic bearish pattern
- Our team expects retracement
SUGGESTED TRADE:
Swing Trade
Sell GBPUSD
Entry - 1.3710
Stop - 1.3765
Take - 1.3604
Our Risk - 1%
Start protection of your profits from lower levels
Disclosure: I am part of Trade Nation's Influencer program and receive a monthly fee for using their TradingView charts in my analysis.
❤️ Please, support our work with like & comment! ❤️
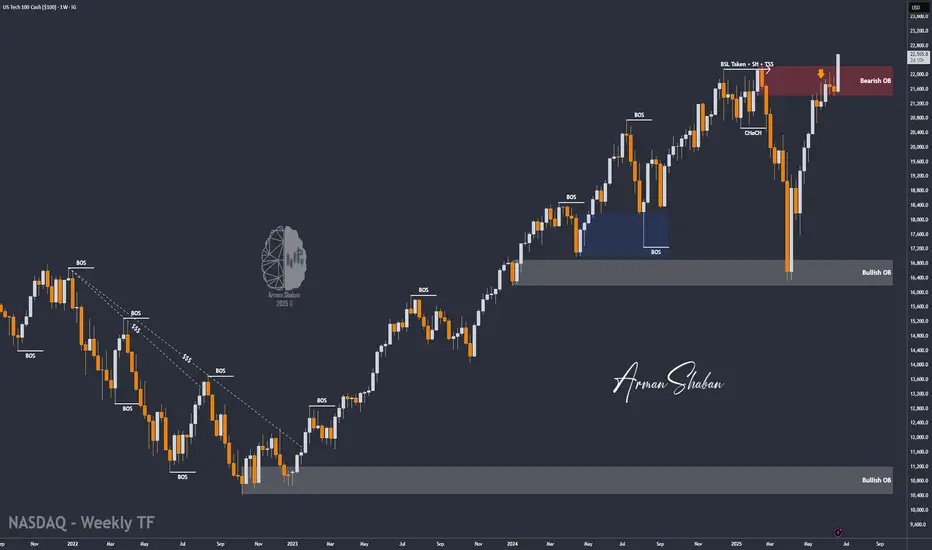
Nasdaq Hits New ATH at $22,570 – Eyes Now on $23,200 and $24,000By analyzing the #Nasdaq chart on the weekly timeframe, we can see that the index followed our previous analysis perfectly, hitting the $22,400 target and printing a new all-time high at $22,570!
Momentum remains strong and bullish, and we expect price to continue climbing toward the next targets. Based on the original projection, upcoming targets are $23,200 and $24,000.
Stay tuned for the next update!
Please support me with your likes and comments to motivate me to share more analysis with you and share your opinion about the possible trend of this chart with me !
Best Regards , Arman Shaban
Fundamental Market Analysis for June 27, 2025 GBPUSDThe GBP/USD pair held positive momentum near 1.3735 during Asian trading on Friday.
Concerns over the Fed's future independence continue to undermine the US Dollar and create a tailwind for the major pair. U.S. President Donald Trump's announcement that he is considering selecting the next Fed chairman ahead of schedule, which has spurred fresh controversy over U.S. rate cuts. Trump said the list of potential successors to Powell had shrunk to “three or four people”, without naming any finalists.
In addition, weaker-than-expected US gross domestic product (GDP) data also sent the dollar lower. The U.S. economy contracted faster than expected in the first three months of this year, falling 0.5%, the U.S. Bureau of Economic Analysis (BEA) reported on Thursday. The figure was below the previous estimate and the market consensus of -0.2%.
Bank of England Governor Andrew Bailey warned earlier this week that interest rates are likely to continue to fall. At its June meeting, the UK central bank left interest rates unchanged at 4.25%, although three of the nine members of the Monetary Policy Committee (MPC) voted to cut interest rates.
Trading recommendation: BUY 1.3750, SL 1.3690, TP 1.3865

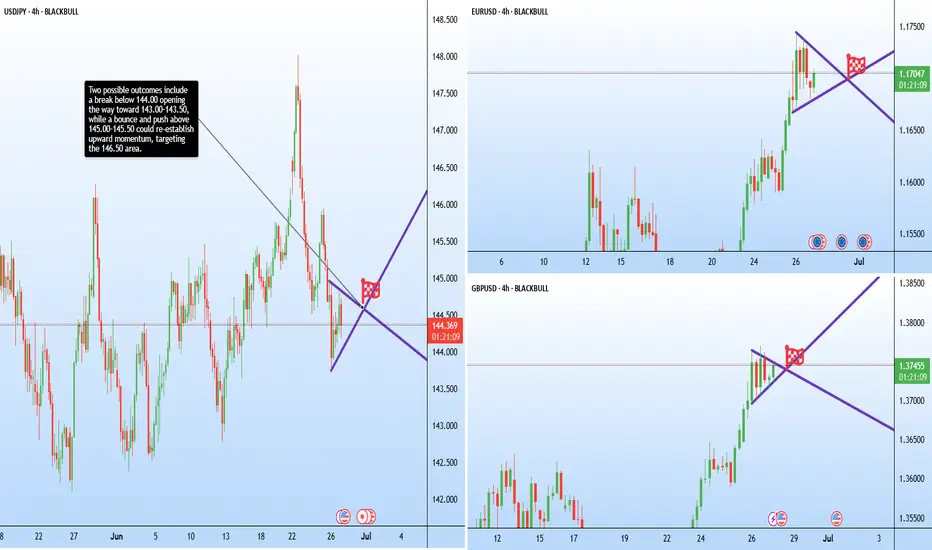
Can PCE data rescue the dollar? JPY, EUR, GBP setup in playThe latest U.S. PCE report is set for release at 8:30am EDT, with both headline and core inflation expected at 0.1% month-on-month.
As the Fed’s preferred inflation measure, today’s figures could influence interest rate expectations. A stronger print may reduce the case for a July rate cut, while a softer result could add pressure on the U.S. dollar.
The dollar has already weakened this week amid speculation over central bank independence (trump is reportedly considering nominating Fed chair Jerome Powell’s successor earlier than normal in order to undermine the current chair).
Pairs to watch include, EUR/USD, GBP/USD, USD/JPY with symmetrical triangle formations suggesting breakout potential in either direction for all once the data hits.
take profit smashedlast post highlighted the buy i was on and now target 🎯 has been smashed. Seeing more opportunities on both buy and sell

Gold Pullback Into Demand – Is Another Bullish Leg Coming?By analyzing the gold chart on the 4-hour timeframe, we can see that, as expected, price began to rise from the $3323 area and reached up to $3350. After this move, gold experienced a minor correction down to $3310, which aligns with a key demand zone.
Currently, gold is trading around $3322, and if price holds above $3313, we can expect another bullish move with $3333 as the first target and $3350 as the second.
This outlook will be invalidated if price closes below $3309.
Please support me with your likes and comments to motivate me to share more analysis with you and share your opinion about the possible trend of this chart with me !
Best Regards , Arman Shaban
GBPUSDGBPUSD price is near the support zone 1.33917. If the price cannot break through 1.33917, it is expected that the price will have a chance to bounce back. Consider buying in the red zone.
🔥Trading futures, forex, CFDs and stocks carries a risk of loss.
Please consider carefully whether such trading is suitable for you.
>>GooD Luck 😊
❤️ Like and subscribe to never miss a new idea!
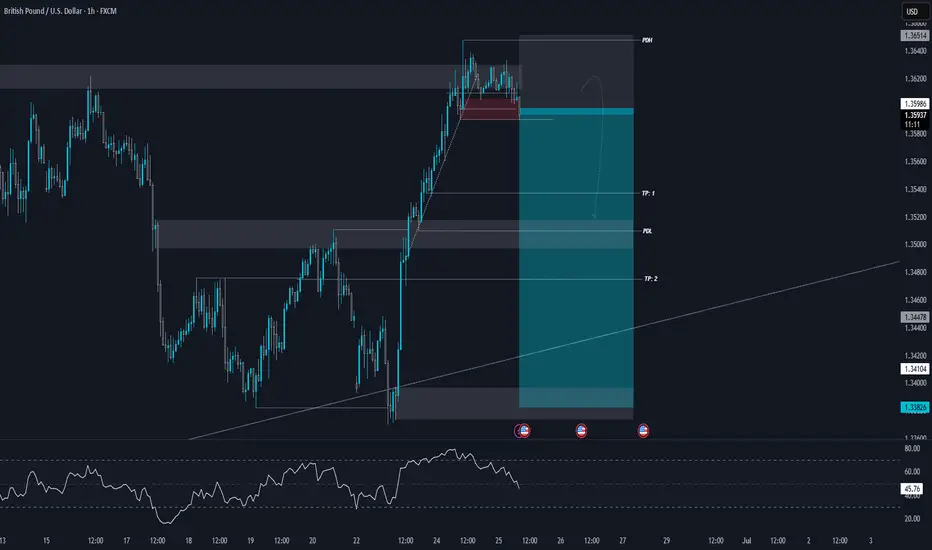
GBPUSD 1H | Bearish Divergence GBPUSD has reached a critical technical zone where multiple confluences are signaling a downside correction:
✅ Bearish Divergence spotted on RSI at the top, indicating momentum exhaustion.
✅ Price got rejected from a strong Daily Supply Zone, showing clear institutional selling pressure.
✅ On the LTF (Lower Timeframe), structure has shifted — new Lower Highs (LH) and Lower Lows (LL) are now printing, confirming a short-term bearish trend change.
✅ Price also broke the LTF trendline and is retesting, adding further bearish confluence.
📊 Bias:
Expecting a corrective move to the downside with targets around previous liquidity zones:
⚠️ Market is still sensitive to USD fundamentals this week, so watch key news events for volatility spikes.
🔔 Wait for proper confirmations and manage risk accordingly.
Riding the Wave or Facing a Pullback? Key Levels to WatchGBPUSD: Riding the Wave or Facing a Pullback? Key Levels to Watch!
Hello TradingView Community!
The GBPUSD pair is currently under the spotlight, experiencing significant movements driven by a mix of market sentiment and economic indicators.
🌍 Fundamental Snapshot: GBP's Lift vs. Underlying Pressures
The British Pound has seen a notable surge, climbing near 1.3765 against the US Dollar. This uplift is primarily fueled by market hopes for an imminent announcement of Fed Chair Powell's successor by President Trump, hinting at potential future dovish shifts in Fed policy. Such speculation could dampen USD's strength, benefiting GBPUSD.
However, the outlook isn't entirely clear-cut for the Pound. Fed Chair Powell has cautioned that tariff-induced inflation might prove persistent, adding a layer of complexity to the broader USD sentiment. Domestically, UK employers are reportedly planning workforce reductions to offset rising social security contributions, which could weigh on the GBP.
In essence, GBPUSD is benefiting from potential USD weakness linked to Fed policy expectations, but traders should remain vigilant about internal economic pressures within the UK.
📊 GBPUSD Technical Analysis (H4/M30 Chart):
Our technical analysis of the GBPUSD chart (image_b6d4de.png) reveals a clear uptrend, marked by consistent higher highs and higher lows. The EMAs are also in a bullish alignment, reinforcing this upward momentum.
Key Resistance (Potential Sell Zone): We identify significant resistance at 1.38366. This level could attract selling pressure, suggesting a potential price reversal or consolidation after hitting this mark.
Key Support Levels (Potential Buy Zones):
Initial support lies at 1.36648.
A stronger support area is at 1.36158. These levels could act as bounce points after any corrective moves.
🎯 GBPUSD Trading Plan:
BUY Zone 1 (Near Current Support):
Entry: Consider entries around 1.36648.
SL: 1.36500 (just below support).
TP: Target incremental gains towards 1.36800, 1.37000, 1.37200, 1.37400, 1.37600, 1.37800, 1.38000, and potentially 1.38300 (just shy of major resistance).
BUY Zone 2 (Stronger Support):
Entry: Look for entries around 1.36158.
SL: 1.36000 (below strong support).
TP: Target incremental gains towards 1.36300, 1.36500, 1.36700, 1.37000, 1.37300, 1.37600, 1.38000, and 1.38300.
SELL Zone (At Resistance):
Entry: Consider short entries around 1.38366.
SL: 1.38500 (just above resistance).
TP: Target incremental declines towards 1.38200, 1.38000, 1.37800, 1.37500, 1.37200, 1.37000, 1.36800, and 1.36648 (targeting support).
⚠️ Key Factors to Monitor:
Fed Leadership News: Any official announcement regarding the Fed Chair succession will trigger significant USD volatility.
UK Economic Data: Upcoming reports on employment, inflation, and GDP will directly impact the Pound.
BoE Statements: Monetary policy stances from the Bank of England.
US Inflation/Employment Data: Continues to influence overall USD strength.
Trade wisely and always prioritize robust risk management! Wishing everyone a successful trading day!

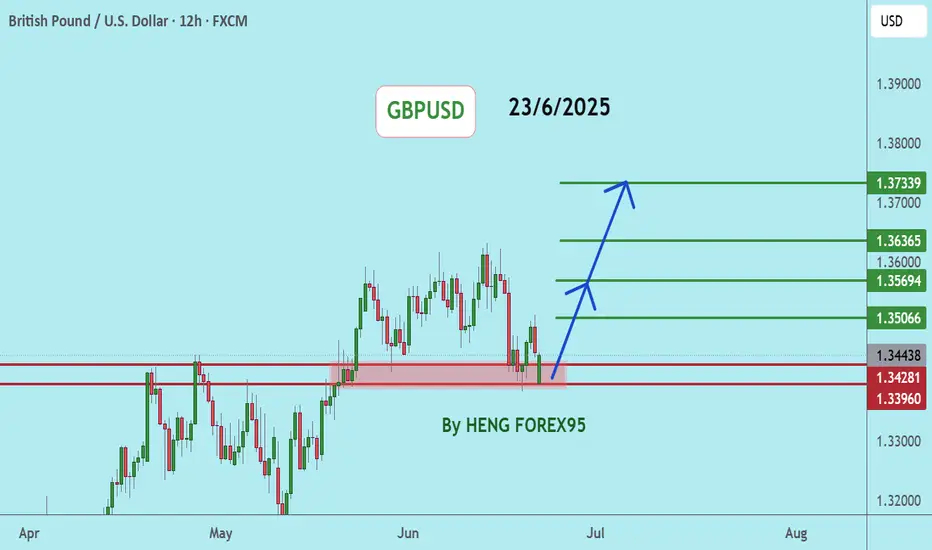
WHY GBPUSD BULLISH ???GBPUSD is unfolding exactly as anticipated, with price now hovering around the 1.3740 region and maintaining strong bullish momentum. Price has successfully bounced from the key support zone near 1.3430, which was previously a major resistance turned into solid demand. This level held firmly during multiple retests, confirming a clean breakout-retest continuation pattern. As long as this structure remains intact, I continue to hold a bullish bias targeting 1.4000 in the coming sessions.
From a fundamental perspective, the British Pound is gaining strength on the back of improved UK economic sentiment. The latest UK inflation data surprised to the upside, pushing annual CPI back above 3%, which reinforces expectations that the Bank of England may need to act sooner rather than later on rate hikes. Markets are now pricing in higher probability of a rate adjustment before the end of Q3 2025. Meanwhile, the US Dollar is under moderate pressure as recent soft labor data and downward revisions in consumer confidence readings have dampened expectations for further tightening from the Fed.
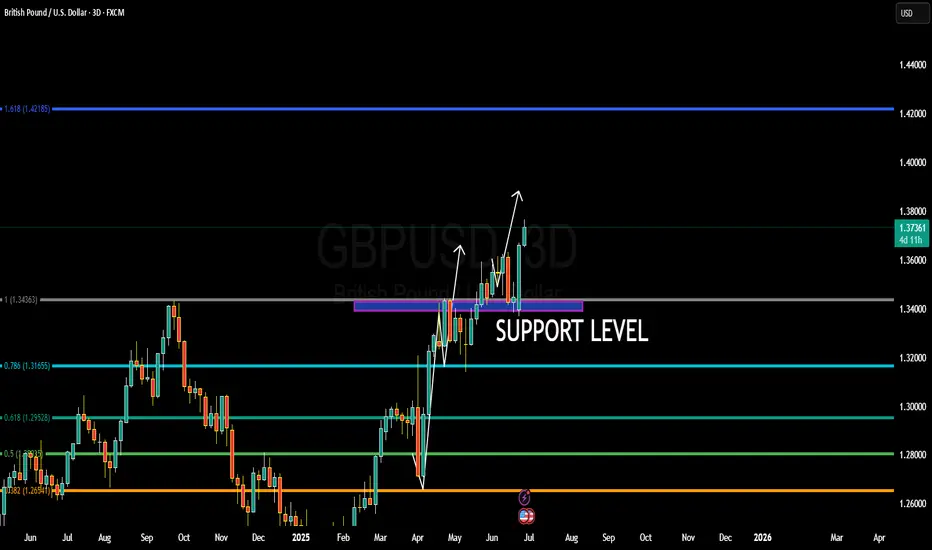
Technically, GBPUSD has cleared major Fibonacci resistance levels and is now forming higher highs and higher lows across the higher timeframes. The current bullish wave is fueled by clean institutional demand and strong price action momentum. If the pair can sustain above 1.3650–1.3680, a swift move toward the psychological 1.4000 handle is highly probable. The 1.4218 Fibonacci extension aligns as a longer-term secondary target for swing traders holding this bullish continuation.
This setup offers a solid blend of macroeconomic backing and technical structure. GBPUSD remains one of the top trending forex pairs right now, favored by strong price action, central bank divergence, and global capital rotation. I'm closely monitoring for intraday pullbacks to add long positions, aiming for extended upside as the market follows through on this bullish breakout continuation.
GBPUSD INTRADAY sideways consolidation breakoutThe GBPUSD currency pair continues to exhibit a bullish price action bias, supported by a sustained rising trend. Recent intraday movement reflects a sideways consolidation breakout, suggesting potential continuation of the broader uptrend.
Key Technical Level: 1.3600
This level marks the prior consolidation range and now acts as pivotal support. A corrective pullback toward 1.3600 followed by a bullish rejection would reinforce the bullish trend, targeting the next resistance levels at:
1.3825 – Near-term resistance
1.3865 – Minor swing high
1.3900 – Longer-term bullish objective
On the other hand, a decisive daily close below 1.3600 would invalidate the bullish setup, shifting the outlook to bearish in the short term. This could trigger a deeper retracement toward:
1.3550 – Initial support
1.3500 – Key downside target
Conclusion:
As long as 1.3600 holds as support, the technical outlook remains bullish, favoring long positions on dips. A confirmed break below this level would signal a shift in sentiment and open the door to a corrective pullback phase.
This communication is for informational purposes only and should not be viewed as any form of recommendation as to a particular course of action or as investment advice. It is not intended as an offer or solicitation for the purchase or sale of any financial instrument or as an official confirmation of any transaction. Opinions, estimates and assumptions expressed herein are made as of the date of this communication and are subject to change without notice. This communication has been prepared based upon information, including market prices, data and other information, believed to be reliable; however, Trade Nation does not warrant its completeness or accuracy. All market prices and market data contained in or attached to this communication are indicative and subject to change without notice.

GBPUSD Hits Channel Highs – Watch for Exhaustion or BreakoutGBPUSD continues its impressive rally, tapping into the upper boundary of a clean ascending channel across the 1D and 4H timeframes.
🔹 Daily:
Structure remains bullish with price pressing into long-term channel resistance near 1.3765. This is a key inflection point — bulls may need fresh momentum to break above.
🔹 4H:
Sharp impulsive move has stretched to the upside channel line. RSI likely overextended. Look for signs of exhaustion or bearish divergence here.
🔹 1H / 23m:
Lower timeframes show aggressive bullish control, but price is stalling near the highs. If we break structure or reject this zone, we could see a correction toward 1.3660 or deeper.
📉 If rejection occurs here, short opportunities may present toward mid-range or trendline support.
📈 If we break and close above 1.3780 with volume, continuation toward 1.3850 becomes likely.
💡Key Levels:
• Resistance: 1.3780, 1.3850
• Support: 1.3660, 1.3600

Could the price reverse from here?The Cable (GBP?USD) is reacting off the pivot and could reverse to the 1st support which acts as a pullback support.
Pivot: 1.3710
1st Support: 1.3620
1st Resistance: 1.3799
Risk Warning:
Trading Forex and CFDs carries a high level of risk to your capital and you should only trade with money you can afford to lose. Trading Forex and CFDs may not be suitable for all investors, so please ensure that you fully understand the risks involved and seek independent advice if necessary.
Disclaimer:
The above opinions given constitute general market commentary, and do not constitute the opinion or advice of IC Markets or any form of personal or investment advice.
Any opinions, news, research, analyses, prices, other information, or links to third-party sites contained on this website are provided on an "as-is" basis, are intended only to be informative, is not an advice nor a recommendation, nor research, or a record of our trading prices, or an offer of, or solicitation for a transaction in any financial instrument and thus should not be treated as such. The information provided does not involve any specific investment objectives, financial situation and needs of any specific person who may receive it. Please be aware, that past performance is not a reliable indicator of future performance and/or results. Past Performance or Forward-looking scenarios based upon the reasonable beliefs of the third-party provider are not a guarantee of future performance. Actual results may differ materially from those anticipated in forward-looking or past performance statements. IC Markets makes no representation or warranty and assumes no liability as to the accuracy or completeness of the information provided, nor any loss arising from any investment based on a recommendation, forecast or any information supplied by any third-party.

GBP_USD WILL KEEP GROWING|LONG|
✅GBP_USD broke the key structure level of 1.3620
While trading in an local uptrend
Which makes me bullish biased
And I think that after the retest of the broken level is complete
A rebound and bullish continuation will follow
LONG🚀
✅Like and subscribe to never miss a new idea!✅
Disclosure: I am part of Trade Nation's Influencer program and receive a monthly fee for using their TradingView charts in my analysis.
GBPUSD | 24.06.2025SELL 1.35900 | STOP 1.36500 | TAKE 1.35000 | Price movement in the range of the medium-term ascending channel.

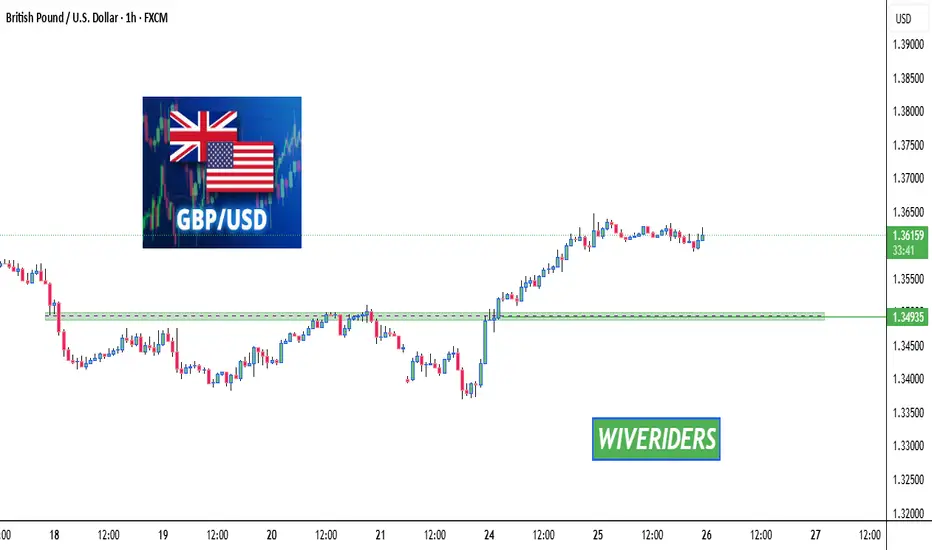
Waiting for Pullback at Green Support GBP/USD Forex Update – Waiting for Pullback at Green Support 📈
GBP/USD is currently in an uptrend. One option is to wait for a pullback to the green support zone level, where buyers could step in and push the price back up again. 📊
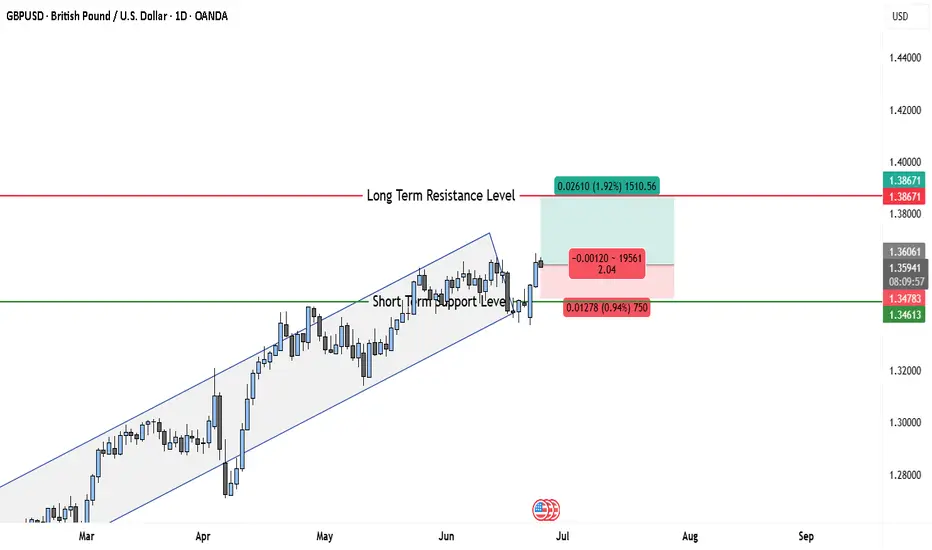
High-Reward GBPUSD Setup: Entry 1.3598, TP 1.3867, SL 1.3478The GBP/USD pair has recently shown a clean bullish breakout from a short-term consolidation zone. Price has decisively moved above the 1.3478–1.3480 support-turned-resistance level, which previously acted as a ceiling within a rising channel. This breakout is meaningful—it comes after a retracement toward the lower boundary of the ascending structure, suggesting that buyers are once again gaining control.
The recent bullish candle has closed strong and full-bodied, indicating momentum. Historically, as you mentioned, GBPUSD tends to follow through for a few sessions once a bullish breakout begins. This is visible in prior moves throughout March and April, where an initial spike was often followed by two or three additional bullish candles. That behavior adds confluence to this setup.
Moreover, there is a clear path for price to move toward the long-term resistance near 1.3867, which aligns well with prior supply zones and the upper boundary of historical price reactions.
📈 Trade Idea
• Entry: 1.3598 (current price after breakout confirmation)
• Stop Loss: 1.3478 (just below the support flip and last swing low)
• Take Profit: 1.3867 (next major resistance level)
• Risk–Reward Ratio: ~2.24:1
This setup offers a clean bullish continuation pattern with room to run. If the pair maintains its current momentum, reaching the target in the next few trading days is entirely plausible. Any daily close above 1.3600 with volume would further validate the trend.
GBPUSD - Expecting Bullish Continuation In The Short TermM15 - Strong bullish momentum followed by a pullback.
No opposite signs.
Until the two Fibonacci support zones hold I expect the price to move higher further.
If you enjoy this idea, don’t forget to LIKE 👍, FOLLOW ✅, SHARE 🙌, and COMMENT ✍! Drop your thoughts and charts below to keep the discussion going. Your support helps keep this content free and reach more people! 🚀
--------------------------------------------------------------------------------------------------------------------

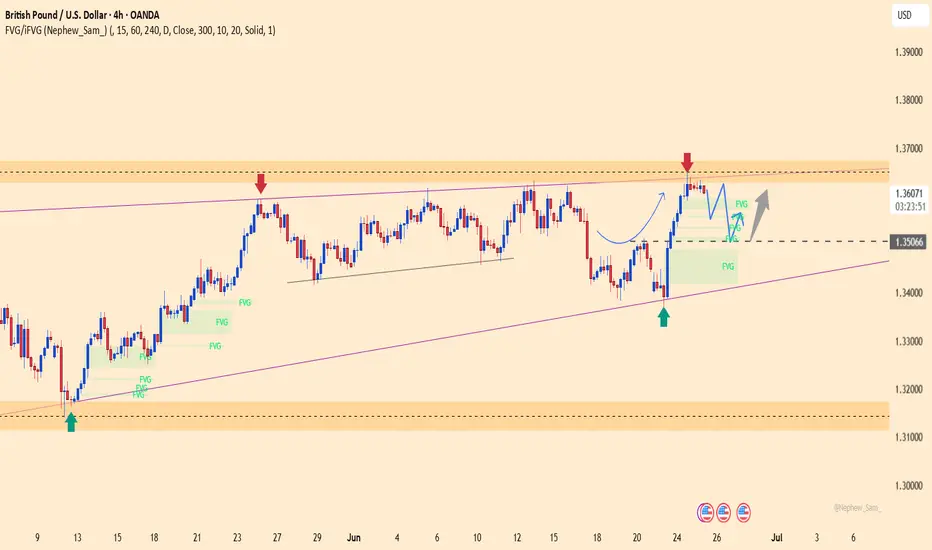
GBPUSD – Bullish Structure Holds, Waiting for a Clean RetestGBPUSD recently bounced strongly from the ascending trendline and hit resistance at 1.36300. The price is now slightly correcting, with a high probability of retesting the 1.35000 support zone – an area of FVG and technical confluence.
The bullish structure remains intact as long as price holds above this level. Positive UK Services PMI data further supports the medium-term uptrend.
Are you waiting for the pullback to jump in?
GBPUSD is in the Selling DirectionHello Traders
In This Chart GBPUSD HOURLY Forex Forecast By FOREX PLANET
today GBPUSD analysis 👆
🟢This Chart includes_ (GBPUSD market update)
🟢What is The Next Opportunity on GBPUSD Market
🟢how to Enter to the Valid Entry With Assurance Profit
This CHART is For Trader's that Want to Improve Their Technical Analysis Skills and Their Trading By Understanding How To Analyze The Market Using Multiple Timeframes and Understanding The Bigger Picture on the Charts

Risk Sentiment Improves, GBP/USD Nears 1.3650GBP/USD extended its rally for a third session, trading around 1.3620 and holding close to Tuesday’s high of 1.3648, its strongest level since February 2022. The pair continues to benefit from improved risk appetite as Middle East tensions ease following Trump’s announcement of a ceasefire between Iran and Israel.
Despite the initial increase, investors remain cautious as doubts persist over the ceasefire’s durability and potential nuclear negotiations with Iran. Focus is also on Iran’s enriched uranium stockpile, which continues to raise geopolitical concerns.
Meanwhile, Powell, in his congressional testimony, signaled that rate cuts are unlikely before Q4. He acknowledged that new tariffs could push inflation higher from June but maintained that the Fed is prepared to ease policy once conditions allow.
Resistance is seen at 1.3655, while support holds at 1.3540.
